Teen Driving Performance Associated with Distraction, ADHD, and Other Risk Factors (2025)
Chapter: 2 Research Approach

CHAPTER 2
Research Approach
Two naturalistic driving datasets, the SHRP 2 NDS and the SPDS NDS, funded by the National Institutes of Health (NIH), were employed to evaluate the association between visual inattention and crash risk for teen drivers. The two NDS datasets are described in the following sections of this chapter and are summarized in Table 1.
Description of SHRP 2 NDS
The SHRP 2 NDS collected driving performance data on approximately 3,500 participants for a period of either 12 or 24 months. This analysis, which is focused on novice teen drivers, used a subset of this larger dataset, analyzing a cohort of 254 drivers aged 16 to 17 years (with an average age of 16.7 years at recruitment), as well as an additional 234 teen drivers aged 18 to 19 years. These teen drivers drove for up to 24 months, accumulating a total of ∼1,800,000 miles, and were involved in 149 crashes. Of the 254 recruited participants, 27 participants aged 16 to 17 years self-reported receiving an ADHD diagnosis.
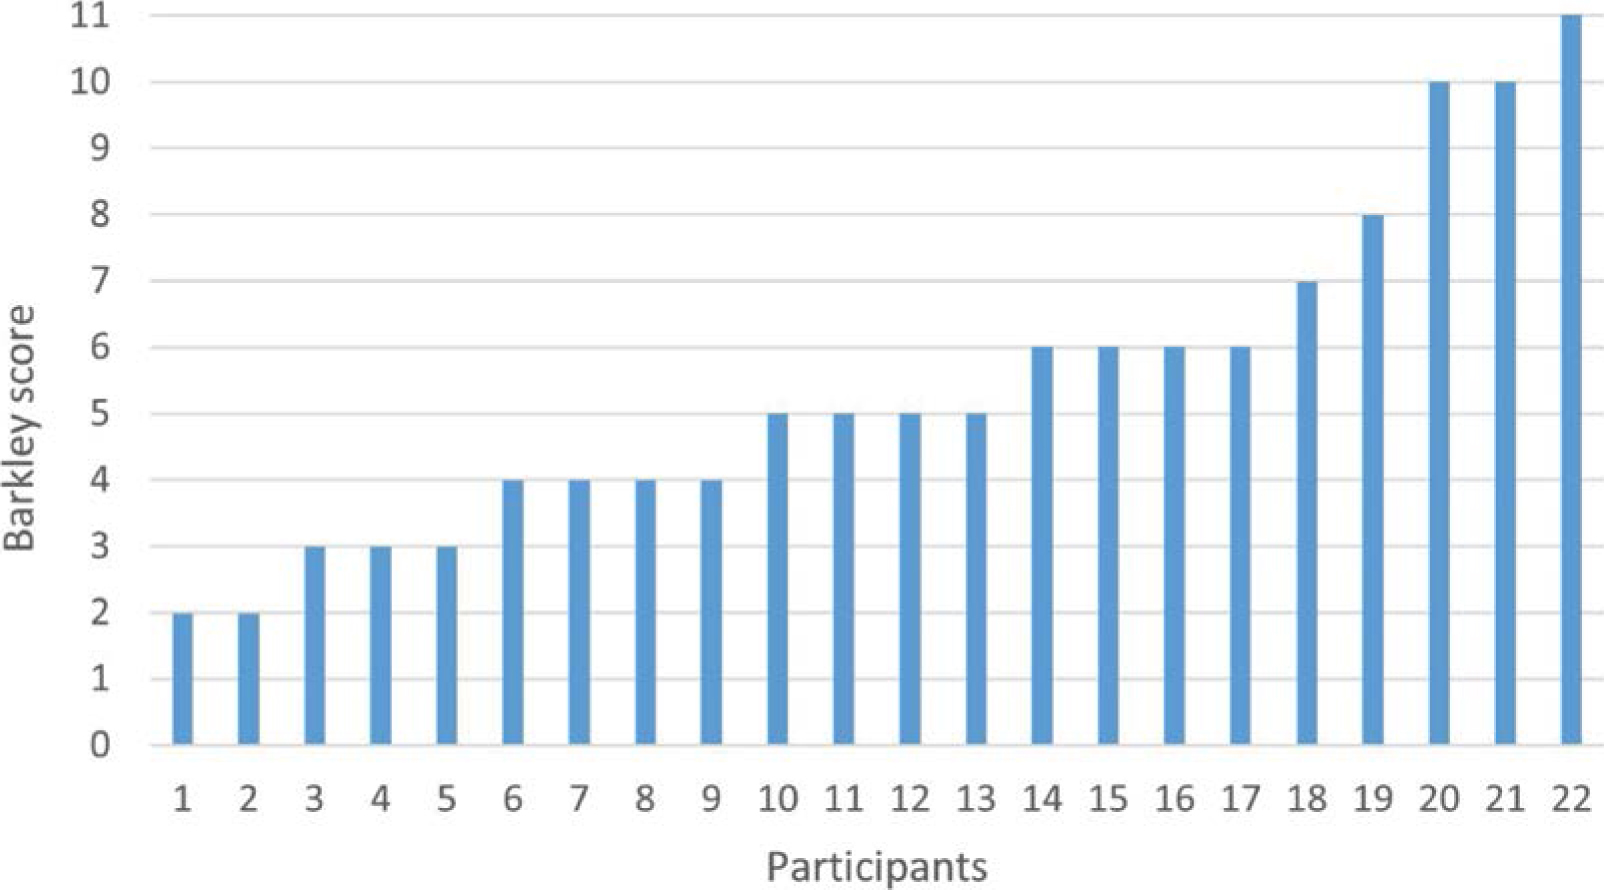
To increase sample size and examine the age- and experience-related eye-glance behavior, five participants aged 18 to 19 years who self-reported ADHD symptoms were considered in the analysis. However, out of 32 participants aged 16 to 19 years, only 22 participants had valid eye-glance data: 17 participants were aged 16 to 17 years, and five participants were aged 18 to 19 years. Data from adolescents who exhibited no symptoms of ADHD were obtained from the SHRP 2 NDS dataset to be used for comparison. SHRP 2 NDS data are available to all researchers who have completed the required human subjects training. A short, clinical, ADHD screening assessment operationalizes ADHD symptoms in terms of six specific behaviors. Each of the six items in the screening is scored as either: never or rarely (0), sometimes (1), often (2), or very often (3). The sum across all six items is the Barkley score. If the Barkley score for an individual is greater than or equal to 7, then this is an indication that further clinical evaluation may be warranted (Dingus et al., 2015). Figure 1 shows the distribution of Barkley scores of 22 participants with ADHD. Only five participants have a Barkley score of 7 or higher.
Description of SPDS NDS
The SPDS NDS collected both learnerʼs permit driving data and independent driving data from 82 novice teen drivers (with an average age of 15.6 years at recruitment). All participants were recruited within 3 weeks of obtaining their learnerʼs permit. During the independent driving phase of data collection, the teens drove a total of ∼380,000 miles, and the dataset includes 60 crashes. The analyses include 12 months of independent driving by all 82 participants.
|
SHRP 2 |
SPDS |
||
|---|---|---|---|---|
Age |
16–19 years |
16–17 years |
||
Licensure Stage |
Independent driving phase (not required to start at date of licensure) |
Independent driving phase (starting at licensure) |
||
Average Age at Recruitment |
16.7 |
15.6 |
||
Miles |
1,800,000 |
380,000 |
||
Crashes |
149 |
60 |
||
Number of Non-ADHD |
488 |
82 |
||
Number of ADHD Teen Drivers |
22 |
n/a |
||
Mean Age at Licensure |
16.23 |
16.56 |
||
Location |
NY, FL, NC, WA, PA, IN |
VA |
||
Age |
16–17 Years |
18–19 Years |
16–17 Years |
|
Sex |
Female |
52.7% |
51% |
52% |
Male |
47.3% |
49% |
48% |
|
Ethnicity |
Not Hispanic or Latino |
94% |
98% |
94% |
Hispanic or Latino |
6% |
2% |
6% |
|
Race |
White |
91% |
90% |
92% |
Other |
9% |
10% |
8% |
|
Long Description.
A vertical bar chart displays Barkley scores for 22 participants, with each participant represented by a bar numbered from 1 to 22 on the x-axis. The y-axis shows Barkley scores ranging from 0 to 11. The bars increase incrementally in height from left to right, reflecting rising scores. Participants 1 and 2 have a score of 2, participants 3 through 5 score 3, participants 6 through 9 score 4, and participants 10 through 13 score 5. Participants 14 through 17 score 6, participant 18 scores 7, participant 19 scores 8, participants 20 and 21 score 10, and participant 22 has the highest score of 11.
Institutional Review Board and Data Use License Process
The research team successfully applied for Institutional Review Board (IRB) approval through the Virginia Tech IRB. Upon receipt of approval, the research team then successfully applied for data use licenses (DULs) to obtain access to the SHRP 2 NDS and SPDS NDS datasets for teen drivers (16- and 17-year-olds). Note that the SHRP 2 NDS has a formal process for all interested researchers to obtain a DUL (restricted public access), whereas the SPDS NDS data set is restricted to NIH-approved researchers (restricted access).
Overview of Data Reduction
Using the trigger thresholds developed from previous NDSs, event databases were created for both the SHRP 2 NDS and the SPDS NDS. Similar data coding protocols to those developed for previous studies were used for both safety-critical event (SCE) coding and baseline coding to ensure comparable sampling and coded variables across both studies. VTTI software was used to scan the files of participating drivers to look for kinematic thresholds that were indicative of a probable SCE. Once triggered events were identified, each one was reviewed by a trained coder to determine validity. Valid events were categorized into one of four SCE types. The operational definitions of crash, near-crash, crash-relevant conflict, and non-conflict are as follows:
- Crash: Any contact that the subject vehicle has with an object, either moving or fixed, at any speed. Also included are non-premeditated departures of the roadway where at least one tire leaves the paved or intended travel surface of the road.
- Near-Crash: Any circumstance that requires a rapid evasive maneuver by the subject vehicle, any other vehicle, pedestrian, cyclist, or animal to avoid a crash.
- Crash-Relevant Conflict: This refers to any circumstance that requires an evasive maneuver on the part of the participant vehicle or any other vehicle, pedestrian, cyclist, or animal that is less urgent than a rapid evasive maneuver (as defined previously in “Near-Crash”) but greater in urgency than a “normal maneuver” to avoid a crash. A crash-avoidance response can include braking, steering, accelerating, or any combination of control inputs.
- Non-Conflict: This refers to any incident or maneuver within the bounds of “normal driving” behaviors and scenarios that is accurately represented by the time series data that created the flagged event. The driver may react to situational conditions and events, but the reaction is not evasive, and the situation does not place the subject or others at elevated risk.
Once these classifications were complete, VTTIʼs trained data coders then further reviewed the crashes, near-crashes, and crash-relevant conflicts. The reduction protocols used were identical for both the SHRP 2 NDS and the SPDS NDS.
Independent and Dependent Variables
This study examined the association of crash risk and various off-road glance durations in teen drivers with and without ADHD. Crash risk was modeled using mixed-effects logistic regression with a random intercept, adjusting for EOR and other independent variables to evaluate the association of EOR and crashes. In the model, the response variable was the safety outcome (crash or no-crash), while the explanatory variables included age, driving phase, ADHD diagnosis, and durations of eye glance. ORs were used to compare CNCs during independent driving in the SPDS NDS, as well as in ADHD and age groups in SHRP 2 NDS relative to baseline events. The primary analysis focused on the prevalence and ORs of various eye-glance durations across independent variables of interest. A detailed description of the variables used in these analyses is provided in the following paragraphs.
SCEs
The SCEs are CNC events. The time window of a CNC started 20 seconds prior to precipitating events (Event Start) and ended 10 seconds after the conflict ended. The baseline events were all 21 seconds long. Eye-glance data were used for a 6-second time period for both CNC and baseline events. This 6-second period included 5 seconds prior to the precipitating event and 1 second after; whereas the 6-second period for baseline events was the last 6 seconds of the 21-second baseline event. The tables in the appendix list the frequency of SCEs and baselines.
EOR
The predictor of interest was the duration of EOR. A 6-second window prior to each CNC event was coded for secondary task engagement and eye-glance duration. Following the same protocol, coders viewed the video footage of the 6-second control road segments to assess the presence of secondary tasks and eye-glance duration. Two EOR variables were evaluated: (1) single longest EOR: the duration of the single longest glance away from the forward roadway during the 6-second window prior to a CNC involving a secondary task and during control road segments; and (2) total duration of EOR: the sum of time the driverʼs eyes were not on the forward roadway during the 6-second windows prior to each CNC involving a secondary task and during the 6 seconds of each baseline.
EOR risk analysis (total EOR and single longest EOR) was conducted using data from both the SPDS NDS and SHRP 2 NDS. ORs were estimated using mixed-effects logistic regression models, incorporating a driver-specific random term to account for the effect of SCEs and baseline events from the same driver. Five duration thresholds (i.e., 1 s, 2 s, 3 s, 4 s, and 5 s) were used to categorize all data into two duration groups for each threshold (e.g., ≥ 1 s versus < 1 s, ≥ 2 s versus < 2 s, etc.), following the approach of Simons-Morton et al. (2014) for both total EOR and single longest EOR. The reference group is the shorter EOR group (i.e., < 1 s, < 2 s, etc.). The mixed-effect model used safety outcome (crash or no-crash) as the response variable and five EOR duration thresholds as the explanatory variables. Separate models were fitted for each threshold value for total EOR and single longest EOR.
Driving Phases
The first year of independent driving after licensure is critical for teen drivers. Driving phases were separated into the following:
- Phase 1: First 6 independent driving months (Months 1 through 6)
- Phase 2: Second 6 independent driving months (Months 7 through 12)
ADHD
Adolescents with ADHD were identified using both Barkleyʼs Quick Screen Scores and self-reported diagnoses of ADHD in the health screens that were collected as part of the SHRP 2 NDS. Core symptoms of ADHD include hyperactivity, impulsivity, and inattention.
Age
Teen drivers showed higher risk for most secondary tasks than adult drivers (Guo et al., 2017). In this study, teen drivers were categorized into two age groups: 16 to 17 years and 18 to 19 years.


