Improving Virtual Public Involvement in Transportation Agencies (2026)
Chapter: 2 Exploring the Toolkit

CHAPTER 2
Exploring the Toolkit

2.1 Introduction
The world of virtual engagement tools is expanding rapidly. This chapter introduces many of the tools in use. It is organized into five sections, each representing a different tool category:
- Virtual Meetings and Events
- Interactive, Web-Based Engagement Tools
- Information/Presentation Tools to Support Engagement
- Promotional Tools
- Comprehensive Engagement Platforms
The first two categories are the two-way (or multiway) engagement tools that are the foundation of any virtual engagement effort. The first category refers to scheduled meetings and events; the second category covers on-demand or asynchronous virtual tools that participants engage with at their convenience. Often, an agency combines tools from these two categories (and in-person methods) to accommodate participants with a variety of needs and engagement preferences. The remaining tool categories include information and presentation tools to support VPI efforts, promotional tools to generate awareness and encourage participation, and tools that agencies and practitioners can use to manage the overall VPI process.
If you are new to VPI, you may want to scan the entire chapter to get a feel for the varied tools available; more experienced practitioners can use it as a reference. Brief examples are provided throughout the chapter.
Remember: Before selecting tools, it is important to determine engagement goals and identify the audiences you need to reach. Chapter 3 provides detailed guidance on defining these goals, planning a virtual engagement process, and selecting tools.
2.2 Virtual Meetings and Events
Virtual meetings and events are central to VPI practice. These are the live, scheduled forms of interaction that became a dominant form of public involvement during the COVID-19 pandemic and have remained popular with many agencies and the public. Virtual meetings use a variety of formats and technologies (Figure 1). This section briefly describes several common formats. More detailed information is in Chapter 5, Strategies for Effective Virtual Meetings. Chapter 5 also covers interactive elements that can enhance virtual meetings, such as live polling and whiteboarding.
Online Meetings
Online meetings are the most common and straightforward virtual meeting format. They typically involve participants joining a virtual platform using video conferencing software. Online meetings allow for real-time communication, video interactions, screen sharing, and collaborative features like chat, simple polling, breakout rooms, and virtual whiteboards. In addition to hosting a virtual public meeting through dedicated virtual meeting platforms, live streaming the meeting to social media platforms can significantly expand the reach and accessibility of virtual meetings and events.
In addition to open public meetings, online meetings are routinely used with smaller groups, such as advisory committee meetings, interagency consultations, and invitational stakeholder sessions.

Long Description.
The illustration is divided into five types: 1: Virtual Office Hours or Coffee Breaks. 2: Online meetings. 3: Telephone town halls. 4: Virtual workshops and charrettes. 5: Virtual focus groups.
For the Interstate Bridge Replacement Program, the Oregon and Washington DOTs conducted 12 online listening sessions with specific communities. These included speakers of four languages: BIPOC individuals (Black, Indigenous, and People of Color), people living with disabilities, homeless individuals and families, and older adults.
The Austin Transit Partnership held 20 virtual neighborhood-level working groups and community design workshops in 2022 for the Project Connect light rail initiative. Participants provided feedback on issues such as station access and preferred amenities.
For a Statewide Multimodal Transportation Plan update, Minnesota DOT hosted trivia-themed virtual gatherings that included storytelling. The series of virtual Letʼs Talk Transportation: Stories, Trivia, Conversations events allowed participants to learn about peopleʼs experiences and perspectives related to six core topics.
 Keep in Mind
- If a project is highly controversial, you will want to design the meeting format carefully and have experienced facilitators on hand.
- If a project or planning process is especially complex, you may need to share information ahead of time with participants by posting it online or creating informational videos.
- Online meetings can require high broadband speeds, so be mindful of the broadband capacity of the community you are serving. If it is a low-bandwidth area, limit meeting content that requires faster Internet speed (such as videos).
- Online meetings should always be paired with at least one form of self-paced, virtual engagement for people who want to participate but do not have time for a meeting or are not available at the specified meeting time.
Meeting-in-a-Box
Agencies have used a “meeting-in-a-box” or peer-led discussion as a collaborative approach that can be done virtually and in person. To hold a meeting-in-a-box, agencies recruit members of the public or community leaders to serve as discussion hosts and provide them with background information and discussion questions. Hosts then summarize the results of each discussion, providing a unique form of input for plans or projects. The meeting-in-a-box was initially designed to facilitate in-person engagement with a physical box of materials. This approach has been adapted in recent years to suit virtual meetings by developing and sharing materials that can be downloaded or accessed and shared online.
Telephone Town Halls
Telephone town halls provide an alternative meeting format that does not require Internet access—an important tool that can be deployed in areas with limited connectivity. These events operate much like a call-in radio program and can accommodate large audiences. Participants dial a designated phone number or are called directly at the time of the meeting and may have the option to ask questions or provide feedback through voice prompts. Telephone town halls can be combined with web-based visual elements such as slides or video streaming. Specialized vendors can assist by placing automated calls within a defined geographic area and managing the queue of callers who wish to speak.
For the Kansas National Electric Vehicle Infrastructure Plan, the Kansas DOT conducted a telephone town hall outreach event to reach disadvantaged communities directly. They dialed more than 20,000 Kansas residents via landlines and texted 5,000 mobile phones to invite them to participate in the town hall, also sending a link to the project website. English and Spanish simulcasts were provided. The event reached 3,471 people, and 1,108 joined the town hall.
Keep in Mind
- Telephone town halls are an excellent way to address access limitations and are especially well suited to rural communities with limited broadband.
- These events can easily accommodate many participants over great distances, making them especially good for large regional or corridor projects. However, in some cases you may want to pair these events with opportunities for more intimate dialogue.
- The audio-only platform used in many telephone town halls is less well suited to technically complex projects that require visual explanation. Telephone town halls for these types of projects might need to be combined with other methods of engagement.
- Setting up a telephone town hall usually requires contracting with an outside vendor for logistical setup and support. If you are planning for a community or region with multiple language requirements, be sure to ask vendors if they can accommodate those needs.
Virtual Workshops and Charrettes
Virtual methods can also be applied to interactive workshops and charrettes that directly involve the audience in a collaborative design or problem-solving process. Along with a virtual meeting platform, these workshops often use a shared visual workspace that allows participants to contribute ideas and comments in real time. They can be especially useful for working collaboratively through complex materials, such as in visioning sessions, problem-solving, or developing alternatives.
The City of West Sacramento held virtual design workshops for its Mobility Action Plan, in which participants designed prototypes for community mobility hubs. Each group worked on a shared screen, using a drag-and-drop exercise to place icons representing potential features on a blank canvas. Preferred solutions were identified among residents with ability differences, women with safety concerns, low-income residents, and people of color.
A virtual charrette for a project in Missoula, Montana, during the pandemic included residents and participants from native tribes far outside the city for whom downtown Missoula is an important destination. The virtual format provided a unique opportunity to bring a broader regional perspective to the project.
Keep in Mind
- Virtual workshops and charettes are best used during the planning, concept development, or design phase of a project.
- If large numbers of participants are expected, be sure to have an adequate number of trained facilitators to break out into smaller working groups during the event or be prepared to hold multiple versions of the same event.
- Workshops and charettes tend to attract participation from people affiliated with advocacy groups or other highly informed stakeholders (such as cyclist groups or neighborhood association members). Since this may be intimidating for other participants, supplement workshop activities with other methods of collecting input, such as comment forms or other on-demand engagement tools.
Virtual Focus Groups
Many transportation agencies now use virtual focus groups in addition to or in place of in-person focus groups when detailed, qualitative insight from targeted audiences is needed. Virtual focus groups can be used to explore transportation concerns, preferences, behaviors, or priorities as part of planning or program development. The virtual format allows the recruitment of participants over a wider geographic area and reduces facilitatorsʼ travel costs. Specialized vendors are available to assist with virtual recruitment, logistics, and payment arrangements.
In 2022 the Baltimore Regional Transportation Board formed a virtual advisory panel, Transportation CORE, to facilitate participation from throughout its large region. Panel members were selected through an open application process and participated in a variety of activities, including brainstorming on a topic, responding to polls or surveys, or attending a virtual meeting. In its first year in operation, CORE members participated in a regional Access Scan, provided input for a regional greenway project, and contributed ideas for the Unified Planning Work Program, among other activities.
Keep in Mind
- Focus groups are a great way to gather perspectives from segments of the population or demographic groups that may otherwise not participate in the process. They are best used as a supplement to a comprehensive engagement strategy.
- If you are planning focus groups, make sure to leave adequate lead time for recruitment, screening, and confirming participants. Recruitment and facilitation can be outsourced to experienced vendors. Alternatively, partnering with a community-based or local organization to co-host and recruit for focus groups is a great way to secure participation from hard-to-reach populations.
Virtual “Office Hours” or “Coffee Breaks”
Typically held during the day, virtual office hours (sometimes called coffee breaks) allow people to engage in brief interactions with agency staff and get answers to their questions about a project or other issue. This strategy is helpful when the public is likely to have questions and to provide a personal touch.
When developing its long-range plan, the Richmond Regional Transportation Planning Organization in Virginia hosted Connect with an Expert sessions that allowed members of the public to schedule one-on-one virtual conversations with team members. These virtual office hours were beneficial during the COVID-19 pandemic when agencies needed ways of interacting informally online with interested members of the public, and they remain useful.
Keep in Mind
- To accommodate participants who speak a language other than English, consider using a real-time translation service or having multilingual staff available.
- Office hours can also be beneficial for older adults or other populations that require a bit more one-on-one, specialized attention.
- Offering office hours is a terrific way to supplement on-demand engagement and provide an opportunity to ask questions and troubleshoot activities that are provided on a self-guided platform.
Virtual Public Meetings in the NEPA Process
Current FHWA policy is that project sponsors use a combination of in-person and VPI for public hearings and meetings during the environmental review process. Thus, the in-person component of the hearing can be supplemented and enhanced by other methods of public involvement, such as VPI strategies. Each state should include in its public involvement/public hearing program procedures to address the use of both in-person and VPI techniques to be approved under 23 CFR 771.111(h).
2.3 Beyond Meetings: Interactive, Web-Based Engagement
Virtual engagement tools that do not require live meeting participation have become common in recent years, beginning well before the COVID-19 pandemic. Sometimes known as on-demand or asynchronous engagement, these tools often require less time for participants than a meeting and may offer more privacy. They can be accessed whenever and wherever it is convenient, as long as Internet service is available. Examples of these tools are online open houses and interactive websites, surveys, interactive mapping and other forms of crowdsourcing, and online forums. On-demand engagement tools can also be used in tandem with in-person meetings. For example, a survey might be used before a meeting to identify participantsʼ questions or after the meeting for detailed follow-up. Most importantly, these tools provide those who are not able to attend a meeting with another option for participation.
Keep in Mind
- If possible, include multiple types of engagement tools on one site to provide participants with options. People will gravitate to the activity that is most comfortable or familiar to them.
- Clear and easy-to-follow instructions are essential. When possible, provide introductory/explanatory information in multiple formats. For example, provide an instructional video along with written step-by-step instructions for the activities offered.
- It is helpful to provide estimated time allotments for each activity. For example, a website could include a 10-minute icon for a mapping activity and a 5-minute icon for a short survey. Keep it simple. Recognize that the more complicated an engagement task is, the less likely people are to complete the task.
- Offer support. Provide a clear and direct method for contacting a project team member for technical questions or support. If possible, provide a phone number or email contact for a project team member who can answer questions and reply to any messages promptly.
- Close the loop. Include information on the website about how the information is being shared with and used by the project team. If you collect contact information, such as email addresses, be sure to send a thank-you to each participant.
- Be mindful of design and aesthetics. The look/feel of any website or web-based tool influences participants and users. Make sure the font size is large enough and easy to read. Use color mindfully to increase overall appeal, and ensure graphics, presentations, and other visual materials are thoughtfully designed and appealing. (See the Chapter 3 section on designing effective information for VPI and for information on ADA compliance and color-blind-friendly design, see Chapter 4.)
- Don’t forget to delight. Humans love rewards in all forms. Look for opportunities to embed your activities with delighters. See the section in Chapter 3 on benefits of delighters.
Online Open Houses
Online open houses are custom web pages that provide information and feedback opportunities similar to those available at an in-person open house meeting—but without the live staff presence. Formats vary from a simple web-based repository of meeting information to a virtual reality immersive “meeting room” with the ability to navigate through virtual displays. Whatever format is used, the information is often structured as a series of information stations on different topics, enabling participants to focus on those of interest to them. Information may be layered with a topical overview, video, and clickable documents for those wishing to drill down on a topic. Feedback opportunities, such as brief polls, can be provided at each station.
Online open houses (Figure 2) can serve as a standalone tool or be offered along with in-person open houses during a public involvement period. When offered in parallel with in-person open houses, they give people an alternative way to participate. They can also serve as a reference for meeting attendees wishing to see the information again. Options include posting an advance recording of the presentation that will be used at the live meetings or posting a recording of the actual meeting. When an online open house is used as a standalone tool, it can be helpful to schedule occasional virtual office hours during the time the meeting is available to allow for personal interaction and make sure the public can get questions answered.
Keep in Mind
- Online open houses are a great way to organize information on large projects that contain a significant amount of information or cover multiple topics.
- Some of the more sophisticated virtual open house platforms have very high broadband requirements and might be difficult for participants to access. If possible, provide an option suitable for low-broadband conditions as an accompaniment.
- Virtual reality open house platforms typically require specialized skills to set up. This work might need to be outsourced.
Interactive Websites
Dedicated project websites or project-specific web pages are a basic element of most public involvement programs for transportation projects. Frequently used for longer projects, websites

Long Description.
The screenshot titled ‘Welcome’ is followed by thank you for visiting our interactive virtual meeting room. In this room, you can watch a Welcome video on the screen, click the handouts on the table, and click the easel to the right to view more project information. Below the text, a person is presenting data on an informational handout, fact sheet, and frequently asked questions. The project overview displays a welcome video. On the right side, the welcome menu includes project design, potential detours, environmental impacts, air or noise impacts, property acquisitions, transit or tolling, live event or comment station. Image courtesy of Georgia DOT.
enable the public to see the big picture as a project develops, often providing a timetable to give readers a sense of the key decisions to be made and when touchpoints with the public will occur. However, the degree of interactivity and two-way engagement each website provides can vary significantly. Many project websites are largely one-way informational tools; others are full-fledged engagement hubs that serve as a portal to multiple engagement activities. Functional features that support two-way engagement include polls or surveys, interactive maps, crowdsourcing mechanisms, commenting opportunities, and the ability to sign up for email updates. To facilitate and encourage participation in virtual meetings, project websites can also include an event registration system or a direct link to access a live public meeting at the scheduled time.
Keep in Mind
- Dedicated websites are especially important for long projects because they provide a repository for relevant information for the public. For shorter projects, it may be easier to create a dedicated page on an existing website.
- Many platforms make it easy to build in accessibility and language options.
- It is good practice to include staff contact information and summaries of the public input received to date on the website.
Comment Forms
Comment forms, both online and on paper, are a longstanding tool for soliciting feedback. The forms are an important feature of most public involvement websites and online open houses. They can be used as a mechanism for gathering official public comments during a formal comment period for a project or for gathering informal feedback, such as comments/responses to an informational video or visual renderings posted on a website. Comment forms can include an option to sign up for future email updates. They may include a self-categorization feature
allowing participants to indicate the topic of their comment, which can aid staff in analyzing comments.
I-526 Lowcountry Corridor WEST Project: Charleston, South Carolina
South Carolina DOT held a hybrid meeting that involved a 20-minute live presentation and virtual 360-degree hearing room in a phase of planning for the I-526 Lowcountry Corridor WEST. This meeting included a comment session that allowed participants to submit comments in real time after the presentation. The DOT also provided opportunities for participants to submit comments over 6 days through a diverse range of platforms, including the project website, project email, project hotline, and by mail.
Keep in Mind
- Consider supplementing online comment forms with paper-based forms or suggestion boxes in areas with limited Internet access. Local organizations or officials may help you find the most secure location for these boxes to avoid theft or tampering. Staffed locations like public libraries generally work well.
- Comment forms can be used throughout a project life cycle and are a great way to keep engagement open in between formal engagement activities and phases.
Surveys
Digital surveys are a widely used tool for gathering opinions and data from the public and project stakeholders. They can be helpful in identifying trends and understanding the preferences and needs of different demographic groups. Surveys also provide agencies with valuable insights to inform decision-making and project planning. Project-specific surveys help gather input on transportation initiatives, like proposed road expansions, public transit improvements, or bike lane installations. These surveys are tailored to the projectʼs goals and can include questions about design preferences, environmental concerns, and potential effects on the community.
Web-based surveys are commonly used because of their accessibility and ease of distribution. Participants can complete web-based surveys from their computers or mobile devices, making them convenient for a broad audience (Figure 3). Surveys may also be distributed via text messaging or short message service (SMS). Since most people with a mobile phone can receive text messages, SMS surveys can help agencies reach a broad and diverse audience, including those who may not have smartphones or Internet access. Telephone surveys and polls are also helpful for reaching broader populations or for conducting more in-depth interviews. Additionally, agencies may offer paper-based versions of a survey or surveys on tablets at pop-up events and in communities with limited Internet access or where online completion is impractical.
In designing a survey, consider what type of data will be most useful. Close-ended questions, like multiple choice and ranking, result in quantitative data that can easily be analyzed with statistical tools. Open-ended questions, which allow respondents to write their responses, can be analyzed but require additional staff time for coding. It is generally good practice to limit the number of open-ended questions and provide a mix of open- and closed-ended question types. Many analytical tools can be used to explore survey data. For most online survey tools, this analysis is available on the survey platform itself. For example, Qualtrics allows users to create

Long Description.
The screenshot shows data on the Statewide Multimodal Transportation Plan, followed by ‘We’ve Got Questions!ʼ Three people are shown in the video, and icons include options for video, audio, and text. Below, the text includes MINNESOTA GO: Planning Minnesota’s transportation future. Image courtesy of Minnesota DOT.
surveys, distribute them, and analyze the resulting data. Other platforms like R or Stata require the data from the survey source to be brought in.
Keep in Mind
- Surveys conducted for a public involvement process are usually considered convenience samples, meaning people take the survey in response to a general, open call for survey participation, in contrast to surveys conducted through scientific sampling methods. In this case, the results are better interpreted as suggestive rather than statistically significant.
- Build from previously crafted surveys if relevant examples are available. Working from an existing survey template can help reduce the development time required.
- Pretest. Running a survey by potential respondents or even a staff member may indicate how well the public will receive the questionnaire. These pretests or user testing can also identify any issues with question wording, flow, length, or clarity through these tests (for more information on user testing, see Chapter 3).
- Keep it short. Less is more with surveys. Opt for the fewest questions possible to gather the feedback you need. The longer your survey, the more likely you are to have incomplete responses.
- Use plain language. As with many VPI tools and strategies, surveys should be written clearly and simply.
- When including demographic questions in a survey, it is helpful to provide context for participants as to why these questions are being asked. Include an explanatory note such as “Please answer a few short questions about yourself to help ensure we are receiving feedback from a broad range of residents.” Understanding the need to share demographic information can help overcome resistance to sharing anything personal.
- Surveys might be challenging for highly complex projects where choices cannot easily be explained in a limited amount of text.
- Surveys are a great tool to use in conjunction with meetings and workshops. Consider using an online survey in the weeks leading up to a virtual meeting or workshop to collect preliminary information from the public that can then be used to customize workshop discussions—giving you something like a head start!
South Lawrence Trafficway West Leg: City of Lawrence, Kansas
Kansas DOT hosted a virtual open house and followed up with a survey posted on their project website to obtain feedback about the virtual format. Five hundred sixty people responded to the survey, providing invaluable insights for the agency. Only 15% of survey respondents had attended the meeting, 79% were unaware of the open house, and 70% said they would attend a virtual meeting over an in-person one. Kansas DOT used this feedback to provide more opportunities for public participation through increased marketing efforts for virtual meetings in the future.
Open-Ended Crowdsourcing: Online Forums and Idea Walls
Online forums, discussion boards, and advisory panels are powerful, web-based, engagement tools that enable transportation agencies to facilitate open and interactive discussions with their communities and stakeholders. These platforms provide virtual spaces for individuals to engage in conversations, share ideas, express concerns, and collaborate on various transportation-related topics. They foster a sense of community and inclusiveness, allowing participants to voice opinions and contribute to decision-making.
A key feature of online forums is their ability to support structured discussions on specific subjects. Agencies can make dedicated discussion boards or panels focused on projects, initiatives, or policy matters. Participants can join these discussions, post questions, offer suggestions, and engage in conversations with agency representatives and fellow community members to
exchange ideas in real time. Moderating the content allows you to ensure that discussions remain civil and constructive by giving you the authority to review and approve content before it is made public. Additionally, these online forums often support multimedia integration, enabling participants to share images, documents, and videos that can enhance the depth of engagement.
A virtual idea wall is similar to an online forum in that it provides a blank canvas on which participants can share ideas. Typically, with an idea wall, participants will post virtual sticky notes with suggestions and comments. These platforms may include the ability to upvote or downvote ideas. These platforms allow a diverse audience, including individuals with varying levels of technical expertise, to participate in discussions. Participants generally like the opportunity to share specific ideas as well as comment on or like other ideas. The ability to browse othersʼ comments may also spark ideas or inspire an interest in participating in the discussion. However, these open forums can sometimes engender fear of negative feedback from other participants or trolling.
Keep in Mind
- These tools can encourage dialogue among participants and are best used when the public has a chance to become informed about a project over time.
- Carefully monitor these forums to protect the integrity of the tool as a meaningful place for engagement. Ground rules for appropriate behavior should be clear and straightforward for participants. Clearly identify who will have access to the feedback and how it will be used.
- Clearly identify whether comments can be posted anonymously. Anonymous posts might encourage some shyer members of the public to participate, but they might also inspire others to post inappropriate comments or overly negative feedback.
- If the platform allows upvoting via a thumbs-up or other choice button, consider making votes viewable to only the administrator to avoid selection bias from other members of the public. Also, ensure that each participant can vote only once per choice.
- If possible, the agency should actively moderate the forum to organize similar comments and ideas together, making it easier for members of the public to skim through posts and ideas and avoid the volume of commentary becoming overwhelming.
- Consider using color or animation to indicate to users that their interactions (such as liking or posting a comment) have been recorded. See the note on delighters in Chapter 3.
- Agencies can also ensure that discussions are accessible to all by providing clear instructions, user-friendly and accessible interfaces, and support for multiple languages. For more information on accessibility, see Chapter 4.
Closed-Ended Crowdsourcing: Rankings, Trade-Offs, Allocations
In contrast to open-ended crowdsourcing, many other tools are available to gather public input in a more structured format that provides a set of choices, options, or constraints to navigate. Some types of public engagement goals are better achieved through these activities. Examples follow.
- Preference ranking. An opportunity for participants to rank their preferences when given a set of potential goals or strategies for a transportation plan or project.
- Visual preference. Respondents rate or evaluate preferences when given images of potential future conditions or potential interventions. This can be especially helpful for projects with a significant aesthetic component.
- Trade-offs. “Would you rather?” trade-off exercises that help participants understand constraints and select preferences among competing goals, such as having more frequent bus service on weekdays versus having more evening and weekend coverage.
- Allocation tools. These tools, such as participatory budgeting, allow participants to express spending priorities among a set of potential investments.
In the spirit of providing choices for participants, most of these crowdsourcing tools can be used either individually or as part of a more comprehensive engagement website. Some can be incorporated into a survey, depending on the survey platform used. They can also be used during virtual or in-person meetings by the entire group of participants, in breakout sessions, or one-on-one with a tablet or laptop (or on paper) at an in-person meeting.
Keep in Mind
- Some participants prefer being presented with a set of options to choose from, especially if they are not familiar with the transportation planning process or are intimidated by a blank canvas. Providing choices/options can also shorten the time required to complete the activity.
- Other users might find closed-ended crowdsource tools limiting in terms of the breadth of information they can share. Where possible, include an optional open-ended comment section or the ability to add other choices to the available options with a note.
Interactive Mapping
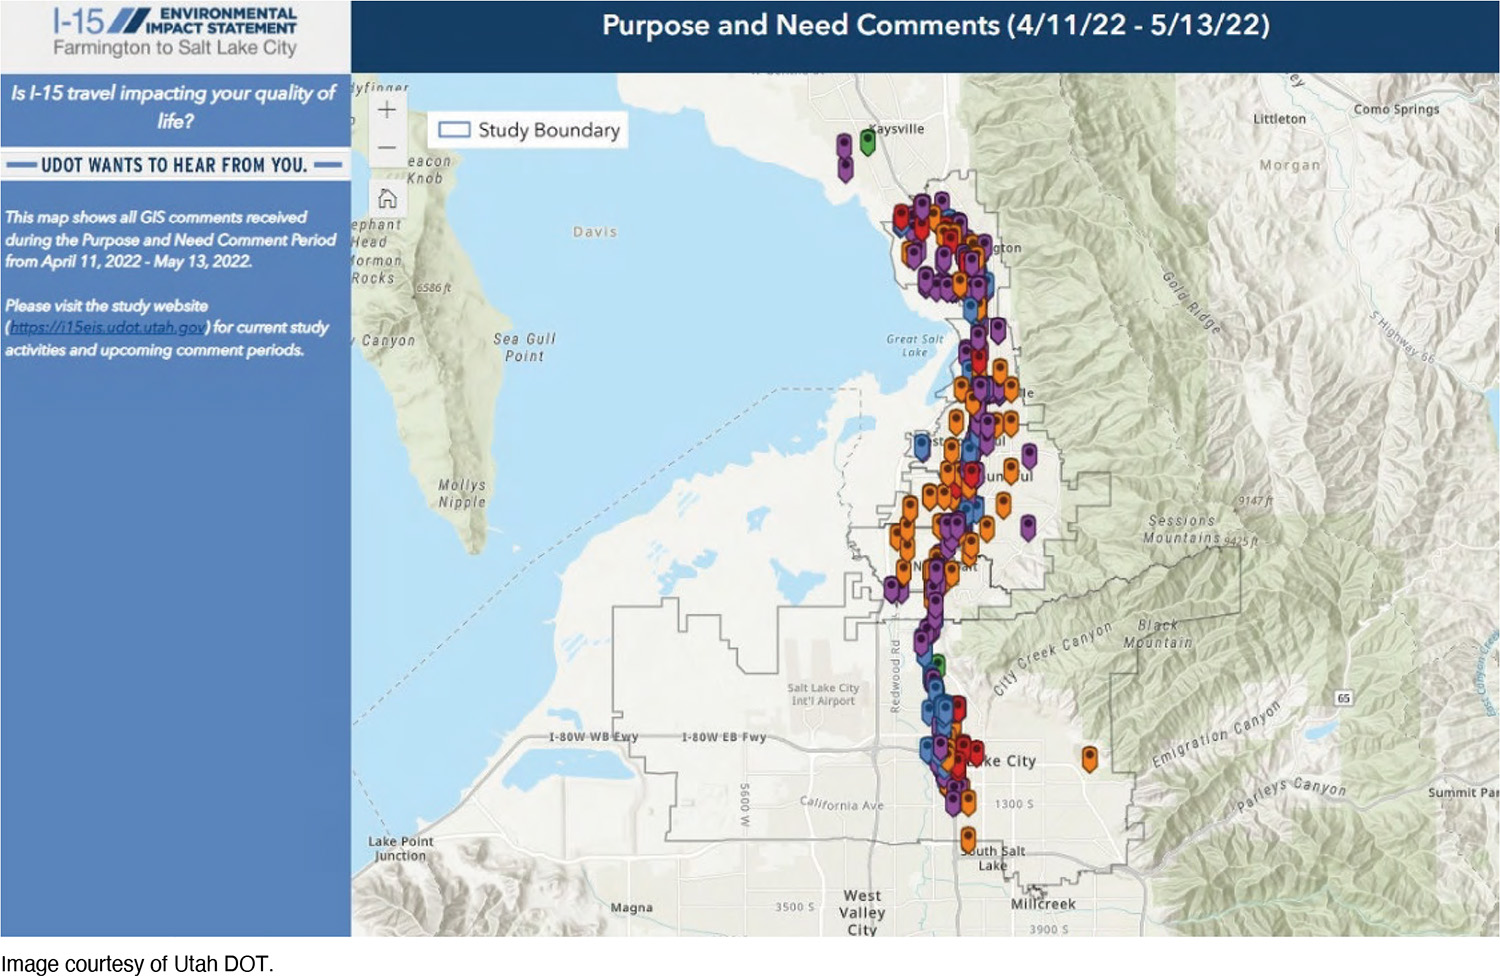
Interactive mapping, another form of crowdsourcing, is a widely used on-demand engagement tool. Agencies use interactive maps to gather location-based data on transportation needs, problem spots, or suggestions for improvement (Figure 4). A variety of commercial mapping
Long Description.
The screenshot shows a map of the I-15 Environmental Impact Statement from Farmington to Salt Lake City, followed by “Is I-15 travel impacting your quality of life? U DOT WANTS TO HEAR FROM YOU.” This map shows all GIS comments received during the Purpose and Need Comment Period from April 11, 2022, to May 13, 2022. Please visit the study website https://i15eis.udot.utah.gov for current study activities and upcoming comment periods. Image courtesy of Utah DOT.
platforms are available. Most allow users to add symbols and descriptive comments to the map, either in real time or for vetting by a moderator before posting. Some allow users to upload images to a pinned location and to respond to other peopleʼs comments. These tools enable the public to provide more informed feedback and comments because they can see the projectʼs spatial relationships and context. Users can see how projects fit within their communities, neighborhoods, or regions, making it easier to comprehend potential effects and benefits. Interactive mapping can use various scales, ranging from local bicycle and pedestrian plans to statewide programs.
The San Francisco Municipal Transportation Authority (SFMTA) used a low-cost mapping tool as a forum to engage residents in developing a subway vision plan. SFMTA obtained more than 2,600 online map submissions in 3 weeks by encouraging local reporters and bloggers to publicize the effort. For greater inclusivity, SFMTA also used a paper version of the map at four pop-up locations geared toward lower-income and LEP communities.
The Metropolitan Council in Minneapolis, Minnesota, used Public Coordinate (a proprietary mapping platform) to collect feedback from the community regarding its Blue Line Light Rail Transit Extension project. The tool presented multiple views of the project design plan and gathered public input on the proposed route and station locations. The interactive mapping increased the level of public engagement over past strategies and resulted in receiving thousands of survey responses and comments on the map.
The Pennsylvania DOT (PennDOT) created a custom interactive mapping tool for ongoing use in its 12-Year Program, a mid-range planning tool that is updated every 2 years. In addition to allowing the public to pinpoint locations of concern by mode, a unique feature of this tool is the ability for users to indicate whether they feel PennDOTʼs planned projects will address those concerns. In the most recent update, PennDOT received more than 4,000 mapped comments and met a goal of increasing participation by those under 25 years old. PennDOT coordinated with the Pennsylvania Association of the Blind to provide a form for users with visual challenges instead of using the interactive map.
Keep in Mind
- Interactive mapping tools tend to work well for projects with narrowly defined boundaries, such as a municipality or a transportation corridor. Maps of large areas can be more difficult for users to navigate.
- If the platform allows, provide a search feature for participants to quickly locate landmarks or locations on the map that they want to comment about.
- Not all participants are comfortable with maps or mapping platforms. Consider allowing another way for users to describe a location using descriptive text (e.g., the intersection of Smith Street and Main Street).
- Make sure instructions are very clear and easy to follow. Consider providing a video tutorial on how to use the mapping features, such as how to drop a pin or how to add a comment.
- Consider whether it is beneficial (for a project or map) for participants to see pins and comments placed by other participants. This often helps to generate dialogue among participants; however, with large numbers of pins, the map could become cluttered and difficult to interpret.
- If a mapping platform has an option to add or upload a photo of a site along with a comment, be sure to indicate that option with any promotion of the engagement platform. Notifying
- participants before the activity allows them to come prepared with the photos when they log on and give input.
- Consider using color or differentiating icons to distinguish types of feedback. For example, if dropping pins, consider red pins for negative comments and green pins for positive ones. Or, if appropriate, consider customized pins that match the mode.
- Some of these platforms have very high broadband requirements and can be challenging to use on mobile devices. If access is limited, consider supplementing the online tool with a paper version of the map at convenient locations.
- Mapping activities tend to be popular with people who are already informed and involved in community planning and projects; however, certain interest groups can dominate the results. For this reason, it is important to offer other forms of engagement along with mapping.
2.4 Information and Presentation Tools to Support VPI
All virtual engagement activities depend on the ability to provide participants with adequate information about the project or plan in question. Since virtual participants often use engagement tools alone or without guidance from staff, the clarity of the information provided is even more important than with in-person engagement. Fortunately, digital tools have had a significant effect on agenciesʼ ability to convey information in meaningful ways. Examples of tools in this category include websites, videos, presentations, visualizations, infographics, publications, and others.
Informational Websites
As discussed in the previous section, project websites are a central public involvement tool, especially for longer projects. They also play a key role in communicating project information. Effective website communication requires a user-friendly, intuitive interface; meaningful, timely content; and easy access to desired information from multiple devices, browsers, and platforms. Graphics, text, audio, video, and database-driven content can be integrated into the website to create intuitive user interfaces, interactive tools, and online multimedia presentations.
The following are some of the information and educational features that can be included in a dedicated project website:
- Project overview with timeline graphic
- Meeting notices/events calendar
- Meeting presentations and other meeting materials
- Photo and video gallery
- Document library with project reports, newsletters, fact sheets, blogs, etc.
- Frequently asked questions
- Interactive map
- Data dashboard/statistics display
- Dynamic infographics/animated trend diagrams
- Multimedia tools
- Learning games
- Glossary of terms
- News page with media contacts, project information, and news articles
- Social media links
- Contact information
Keep in Mind
- It is a good idea to connect with an agencyʼs information technology (IT) department and get to know the individuals responsible for managing and maintaining website and IT security. This helps ensure you can create content consistent with agency policies. If you are creating a VPI task force, make sure to have representation from appropriate IT departments.
Presentations
Presentations, typically using slide decks, are one of the chief tools transportation agencies use to convey information about a plan or project during public engagement. Long a mainstay of in-person meetings, they have become central for virtual meetings and online open houses. Some agencies now require that a recorded project presentation be posted online before any public meeting; others post them after meetings. Presentations can also be used in webinars or as tutorials to educate interested participants on a topic related to a project, such as a technical issue, helping to bridge the gap between lay participants and professionals.
Keep in Mind
- When designing presentations for use in virtual meetings, maintain a clean, uncluttered, and visually appealing appearance. Presentations should be structured in a logical flow, with clear sections and headings and a mix of concise text and relevant images.
- Including brief videos, interactive elements, or demonstrations can help maintain interest and enhance understanding and engagement.
- Font size should be at least 20 points—preferably larger, especially if many in the virtual audience will view the presentation on a phone or tablet.
- Designers should follow Section 508 guidelines, which include providing sufficient contrast between text and background colors, using alternate text on images, and including transcripts of any embedded audio. For more information on creating accessible presentations, see Section 5.3.
Videos
Videos have become central to communicating with the public about transportation projects. They provide a uniquely engaging way to attract attention and convey complex information.
Depending on the purpose, resources, and time available, agencies can opt for professionally produced videos or low-cost, do-it-yourself videos made with smartphones. Videos can be easily shared on social media and project websites or shown at public meetings, and they can be captioned or translated into various languages to reach a broader audience. Short videos, known as reels, can be developed for quick and easy sharing on social media. Videos that include residentsʼ viewpoints, expressed on camera, can help viewers relate to the information presented. Section 508 requires that captioning be provided on videos when speaking or narration is present. It also requires audio descriptions for music and other sounds.
In a video for its NextGen Bus study, the Los Angeles County Metropolitan Transportation Authority (LA Metro) captured bus ridersʼ feedback on the bus system and the choices to be made, such as a trade-off between bus speed and the number of bus stops served.
Several MPOs have created videos explaining the metropolitan transportation planning process, in some cases using animation or motion graphics to add interest. For instance, the Richmond Regional Transportation Planning Organization created an animated video explaining the process and key issues for its long-range transportation plan.
South Carolina DOT used traditional cartoon-style animation for a video in its project development process.
Utah DOT created a video tutorial to help the public understand its noise wall policy. The tutorial used a combination of video footage, animated mapping, and animated charts.
Podcasts
Podcasts, or digital programs available in an episodic series format, have captured a considerable market share and continue to grow in popularity. A podcast series (or an individual episode) on a transportation topic can help spur local dialogue and lead to more informed engagement. In contrast to webinars, podcasts allow for richer, more in-depth conversations that use storytelling and perspective-sharing.
There is no one way to do a podcast series: podcasters can adopt their own format, length, and style. Some podcasts offer only an audio experience; others include video, which may help them stand out and reach a larger audience. Reaching audiences with a podcast is easier if it is part of a comprehensive engagement program with multiple communication channels and tools. All episodes can be listed on the podcasterʼs feed and cross-posted on websites, social media channels, newsletters, and the like. Streets Ahead Podcast is an example from the United Kingdom. Topics range from cycling in Oxford to broader policies like the United Kingdomʼs Transport Decarbonization plan. The podcast also posts episodes on a Twitter page to engage with listeners and reach a wider audience.
Visualizations
Visualization, in its many forms, has become an essential tool to support informed public engagement in transportation. Visualization methods range from simple sketches and renderings to three-dimensional (3D) images and immersive virtual reality, as shown in Figure 5. They can be helpful in communicating with audiences with LEP or low literacy by emphasizing imagery over text.

Long Description.
The flowchart begins with a conceptual sketch, followed by infographics, video, and drone imagery, followed by 3 D static rendering, animated graphics, photo-simulation, 360-degree panoramic image, and 3 D animation or traffic simulation, followed by 4 D sequential renderings, real-time interactive 3 D, augmented reality, and it ends with virtual reality immersive.
Visualizations can be shared via agency websites, social media, videos, publications, and public meeting displays. For instance, North Carolina DOT has produced project videos that include live footage, 3D visualizations, and motion graphics to explain proposed design changes; the video format supports a wider reach for distribution. Figure 6 and Figure 7 show examples of virtual reality and 3D visualizations, respectively.
During planning, visualizations can help increase understanding of transportation conditions and trends. They can inform scenario planning or visioning processes for long-range plans or corridor studies. In project development, visualizations help the public envision the appearance of a proposed project or gather feedback on an initial concept or design. Visualizations can also help the public compare alternatives.

Long Description.
One person is wearing a virtual reality headset and holding a controller and another person is standing behind, assisting him. Image courtesy of Connecticut DOT.

Long Description.
The illustration shows a highway with an overcrossing bridge and moving vehicles. The below text reads: ‘Tamalpais Drive Overcrossing Improvements,ʼ ‘Click for Draft Environmental Document,ʼ ‘Your thoughts?ʼ Image courtesy of Caltrans.
Infographics
Infographics refer to a visual representation of information, data, or knowledge in a concise format using simple charts or diagrams with minimal text to communicate complexity quickly (Figure 8). They are instrumental in virtual engagement when there is a need to communicate technical information efficiently. Infographics often include a storytelling aspect to share a compelling message. They can show patterns and trends, describe complex systems, and improve understanding and support recall of the content that was shared. They can also help transcend language to reach diverse audiences and, with minimal text, are easily translated. When words

Long Description.
The left panel shows that the current bridge is one of the region’s major transportation bottlenecks, causing 10 hours of congestion. The right panel shows that the construction of the replacement bridge is projected to generate 11.6 billion dollars in total gross regional economic activity. Image courtesy of Oregon DOT and Washington DOT.
alone cannot quickly communicate something, and when content needs to be memorable, an infographic can be a valuable choice. The following are examples:
- Giving an overview of a situation or topic
- Displaying a project timeline or other schedule
- Illustrating data from a survey or other research
- Providing details on a complicated process or activity
- Reviewing multiple options and evaluating the similarities and differences
- Elevating an issue or raising awareness about a cause
- Presenting information from a list in a visual way
Dynamic Maps
Dynamic maps, scaled to a projectʼs study area and hosted on a website, are another key tool to help inform the public about project issues, alternatives, or potential impacts. Generally based on geographic information system (GIS) software, dynamic maps provide a user-friendly way for the public to understand the geographic aspects of transportation initiatives without requiring specialized GIS knowledge. Users can view project locations, proposed changes, and associated data layers, as well as zoom in, pan, and interact with the map to gain a comprehensive understanding of specific areas and features.
Interacting with a dynamic map can enable viewers to provide informed feedback and comments, because they can see the projectʼs spatial relationships and context (Figure 9). Users can

Long Description.
The screenshot titled ‘Existing Conditions,’ followed by Valley Stream, is in the top 1 percent of most populated municipalities in New York, with a population of 40,634 with various cultures (2020 US Census) covering 3.48 square miles. Its population density of 11,676 people per square mile is on par with cities like Yonkers and Mineola, New York. The village hosts two Long Island Rail Road (LIRR) stations: Valley Stream and Gibson. The Valley Stream Station operates as a junction for LIRR’s Far Rockaway Branch, Long Beach Branch, and West Hempstead Branch. Valley Stream station’s commendable 14 (here, the bottom of the screen cuts off the text). The headings and links along the top are Introduction to Valley Stream, Existing Conditions, Village Goals, Get Involved, and About the Project. Image courtesy of New York Metropolitan Transportation Council.
see how projects fit within their communities, neighborhoods, or regions, making it easier to comprehend potential effects and benefits.
Keep in Mind
- Dynamic maps are a great tool to use in combination with a way of collecting feedback, such as an online survey. They can provide the necessary background and context so that users can make informed decisions regarding survey/engagement questions.
- While most of these platforms are responsive in their design, they may be more challenging to view on smaller screens, such as mobile phones.
- These tools usually require an agency subscription and some technical skills to develop; this work could be outsourced.
Educational Games and Tools
Educational games use interactive websites to engage users in enjoyable learning experiences. These tools are designed to make learning dynamic and participatory. Through “gamification,” they turn educational content into interactive challenges, quizzes, or simulations, fostering an engaging and immersive learning environment (Figure 10). For an in-depth look at gamification, see Chapter 3. These tools often feature real-time feedback, allowing users to track their progress and understanding of the material instantly. Interactive elements such as quizzes, puzzles, and simulations make complex concepts more digestible, catering to various learning styles. The use of multimedia elements, including videos, graphics, and animations, enhances the overall learning experience and makes it more visually appealing.
Publications
Traditional publications, whether digital or in hard copy, remain an important part of the information landscape, supporting public understanding and engagement in transportation. Examples range from short-form publications such as fact sheets, newsletters, and brochures to

Long Description.
The worksheet titled ‘Transportation Mode Lib Game” is followed by a fill-in-the-blanks story about how you move in Minnesota. ‘I am a blank with blank ideas for the future of transportation in Minnesota!’ ‘For the past few years, I would go to the blank almost every day to blank.’ ‘I would use a blank most often because I needed a blank way to get there.’ ‘In an ideal world, I would be able to move around using blank to get to blank.’ ‘Life has changed a lot since April, when our normal routines changed due to the COVID-19 pandemic.’ ‘Now, I go to the blank way more often, but go to the blank much less frequently.’ ‘Instead of a blank, now I take my blank, and it is blank.’ ‘Over the last 6 months, I realized I would like to blank more in the future.’ Image courtesy of Minnesota DOT.
longer technical reports and environmental documents. For transparency, it is helpful to organize project publications in a central library section of a website. Section 508 guidelines should be followed when designing publications and creating PDF versions for downloading. Also, keep in mind that source documents, such as PowerPoint presentations, must be made accessible before exporting them to an accessible PDF.
- E-newsletters can be especially useful for projects that are longer. They can help fill the communication gap that sometimes occurs in a lengthy alternatives analysis or environmental review process as the project team works through technical issues between rounds of public engagement. Some newsletters are published according to a predetermined distribution schedule; others are issued ad hoc as key milestones occur. Newsletters can be a helpful way to share summaries of engagement events and their results, as well as updates on program or project schedules.
- When publishing a lengthy technical document, it is helpful to prepare a reader-friendly summary that draws out the materialʼs key points for the general reader and includes relevant graphics. Some agencies use a different format for the summary, such as embedding it in an interactive website with accompanying multimedia or developing an illustrated brochure.
2.5 Promotional Tools
Effective publicity is a critical ingredient in virtual engagement. Even the best-designed VPI engagement opportunities will succeed only if enough people—with diverse perspectives—find out about them and choose to participate. This section describes a variety of promotional tools that can generate awareness and encourage participation in VPI. Examples include social media, email, traditional news media, and nonvirtual tools such as mailings, physical displays, and direct person-to-person outreach.
Regardless of a projectʼs size and scope, promotional tools should be calibrated to reach target audiences, whether that means residents of specific geographic areas, demographic groups, specialized types of stakeholders (such as large employers), or transportation facility users (such as drivers, transit riders, cyclists, or freight providers). Ensuring promotional tools are accessible is also important. Chapter 3 provides guidance on identifying target audiences and the communication channels best suited to their needs and preferences.
Key information to include on any flyer, mailer, or announcement (virtual or traditional methods) consists of the following:
- Name of agency hosting the engagement activity
- Date and time VPI tools are available
- How to participate/sign up/engage
- How to access accessibility features (who to call, how to request printed materials, etc.)
- Expiration date for the flyer (helpful for libraries or bulletin boards with limited space)
Social Media
Social media platforms have become essential tools for agencies. They offer a dynamic means of connecting with the public, sharing information, and fostering engagement (Figure 11). These platforms enable agencies to reach audiences directly. Social media is often more cost-effective than traditional outreach methods, requiring minimal resources for the widespread dissemination of information.
Social media can help in building virtual communities around transportation initiatives, where followers become part of a network to share experiences, insights, and support for agency projects. Platforms have extensive user bases, allowing transportation agencies to reach a diverse audience, including residents, commuters, visitors, and other stakeholders. Several social media

Long Description.
The screenshot titled ‘Pennsylvania Department of Transportation (PennDOT)’ is followed by How do you travel? How would you change the future of P A’s transportation? Your feedback makes a difference; Take our survey at TalkPATransportation.com; How did your commute change in 2022? Take the survey; March 1 to April 30. Image courtesy of PennDOT.
platforms (such as NextDoor) are made for neighborhoods and allow information sharing between neighbors. Agencies working on projects that will affect specific neighborhoods can use these tools to reach out to geographically specific populations. Ohio DOT has found this especially helpful in denser, urban areas.
Social media platforms also offer analytic tools that enable agencies to track engagement metrics, assess the reach of their messages, and tailor their communication strategies for greater effect. Monitoring social media conversations provides agencies with valuable insights into public sentiment, concerns, and priorities, helping them adjust their strategies and address community needs effectively.
Keep in Mind
- Paid posts can be used to target locations or populations of interest or to encourage participation from underrepresented communities. For example, the Broward MPO used geo-targeted ads to gather survey responses for its Complete Streets Master Plan from three locations where participation had been low in the past. The response from these areas helped inform project priorities in the plan.
- Be mindful of public expectations about how your agency will use comments made on social media platforms. It is important to inform the public about whether comments on social media are considered official public comments. Many agencies prefer to direct people to an official site to register official comments, with social media conversations limited to more informal dialogue that helps them “take the pulse” of the public on a topic.
Email Blasts
Email blasts, also known as email campaigns or email marketing, leverage the widespread use of email as a communication medium to deliver announcements, updates, and calls for participation directly to a targeted list of recipients. Email blasts enable agencies to establish and maintain a direct line of communication with their subscribers and stakeholders at minimal cost.
Key features of email blasts include the ability to tailor communication according to recipient criteria; support for various content formats such as text, images, videos, and links; automation features for scheduling and triggering emails; and robust analytics to measure campaign performance. These features empower agencies to create engaging and informative emails that convey project details and promote opportunities for participation. By tracking user engagement, agencies can refine their messaging on the basis of recipient behavior, improving the effectiveness of future email campaigns.
Potential challenges with using email blasts include concerns about email deliverability, the risk of emails being marked as spam, and the need to keep email lists up to date. In addition, always include a disclaimer message stating that information will not be sold or shared.
Text Messaging
Text messaging, or SMS, is a highly efficient communication tool that delivers timely and essential information directly to individualsʼ mobile devices. It is great for providing immediate updates, notifications, and alerts to the public. Text messages can also be used to announce meetings, distribute surveys, or gather public feedback on transportation services and projects.
Almost everyone with a mobile phone can receive text messages, including those who do not have smartphones or access to the Internet. Text messages that are sent to users from an agency should be straightforward and brief. The tone should be positive and engaging but generally formal to maintain your agencyʼs identity. When planning SMS outreach, consider including the following details in the text:
- Agency name
- Purpose of the message
- Frequency of texts (per day, week, or month)
- A mention that message and data rates may apply
- Instructions for opting out or requesting help
Example Text Message Content
(xxDOT) Mobile Alerts: Bridge Replacement Project Updates. There are approximately two messages/month. Msg and data rates may apply. Text STOP to cancel, or text HELP for more information.
When using text messaging for feedback, your agency may increase response rates by strategically advertising a feedback request by location (geofencing). This request may be in the form of a simple question such as “How can we improve?” coupled with an invitation for respondents to text a keyword to a number. This allows participants to opt-in to correspondence, and your agency may then use automated responses or live communication to engage with participants. Geofencing allows this method to be tailored to specific projects for a particular community.
MassDOT and EZDriveMA collaborated on the Sumner Tunnel Restoration project to engage with the frequent tunnel users. Those EZ-Pass holders of a certain zip code who passed through the Sumner Tunnel were recorded by EZDriveMA and sent to MassDOT. MassDOT was then able to coordinate an advisory notification for users of that zip code, alerting those most frequent users of tunnel closure. This method of outreach could also be used to send geotargeted SMS by way of area codes rather than zip codes.
Keep in Mind
- Messages longer than 160 characters will be broken up into multiple messages when sent via SMS. (This is not the case for some device-specific messaging services, such as Appleʼs iMessage.)
- Text message outreach has become increasingly popular in recent years, especially around political campaigns. The general public might be more sensitive to perceiving unwanted text messages as spam.
- For both email blasts and text messages, providing an opt-out option is required. Giving recipients the option to unsubscribe from texts is a legal requirement, but it is also a crucial element in building trust and maintaining a positive reputation for your agency.
- Text messaging is considered a form of telephone calling, according to the Federal Communications Commission and is, therefore, regulated under the Telephone Consumer Protection Act (TCPA). The TCPA outlines requirements for using SMS, including obtaining written consent from the recipient, communicating only during business hours (8:00 a.m.–9:00 p.m.), and respecting the national do-not-call registry. Not all agencies and contractors will need to adhere to these regulations; for more information, refer to the Federal Communications Commission website and the TCPA.
Traditional News Media
Traditional news media outlets can be an effective way to reach specific demographic groups, such as older audiences who are accustomed to receiving their news and information from the media. In some communities, local radio stations command considerable attention; ethnic stations might offer a way of reaching a variety of populations; and drive-time radio can help reach commuters. Paid advertising in print, broadcast, or digital media outlets and earned media, such as feature stories and mentions in news articles, are viable options for promoting public involvement opportunities. Earned media often provides greater visibility than paid ads but generally requires an organized media relations effort.
Radio has been a powerful outreach tool for the North Carolina DOT. It used radio ads, along with social media and mailings, to announce a virtual public hearing for the Corridor K Environmental Assessment.
Keep in Mind
- To facilitate accurate reporting and encourage earned media, it is helpful to establish a News or Newsroom web page on the project website. This can include agency media contacts and key public-facing materials such as fact sheets, maps, presentations, videos, news releases, and media articles. Providing all these items gives news media members a one-stop location so they can easily access key information and visuals when preparing articles.
Partner Toolkits
Partner toolkits are digital resources designed to help project partners efficiently distribute meeting announcements, links to surveys, or other project information (Figure 12). They can include social media posts, meeting flyers, content for newsletters or email blasts, key messages, visual assets such as logos and images, and guidelines for maintaining consistent messaging and branding.
Supplemental Non-Virtual Tools
In addition to virtual tools for promoting engagement, traditional tools such as mailings, physical displays, and person-to-person outreach have an important place in many promotional campaigns and can help to bridge the digital divide. During the COVID-19 pandemic, many agencies rediscovered the value of direct mail (Figure 13). Other traditional options include door hangers, posters, bus placards, and portable exhibits placed in libraries or community centers. For example, the North Carolina DOT mailed out newsletters with project updates and information on how to call into upcoming virtual meetings.

Long Description.
The screenshot includes the text, help us promote the public comment period by encouraging your audience to take the transportation survey. It has two sections. The left section transportation survey includes Share the transportation survey link with your audience so they can tell us what they think! Share this link with your audience: survey.talkpatransportation.com. The right section printable survey includes: Download the printable survey to provide an offline option for your audience. Below, a blue box is labeled Download. PennDOT’s toolkit provided ready-to-use content that partners could share with their audiences during the public commentperiod for the 12-Year Program. It included a survey link, printable survey, fact sheets, media releases, a public service announcement script,newsletter content, and a short animation that could be downloaded and included in social media posts across four platformin English, Spanish, and Simplified Chinese. Image courtesy of PennDOT.

Long Description.
The postcard is titled ‘Please join us, Ala Moana elevated pedestrian walkway online question and answer session,ʼ which includes three sections. Section 1: Thursday, September 17, 6:00 to 7:30 pm HST; Zoom Meeting: Meeting Link (click to join or visit www.rebrand.ly/radlk9h); Join by Phone: 877 853 5257 (Toll-free); Meeting ID: 869 1556 9372, Passcode: 851688. Section 2: No computer or internet? No problem! You can attend the meeting by phone to learn more and ask a question. Section 3: Information from the presentation will be available after 9 17 at: hidot.hawaii.gov/presentations. Below are the logos for the Hawaii Department of Transportation, the Federal Highway Administration (FHWA), W mark, and QR code. Image courtesy of Hawaii DOT and Victoria Ward, Ltd.
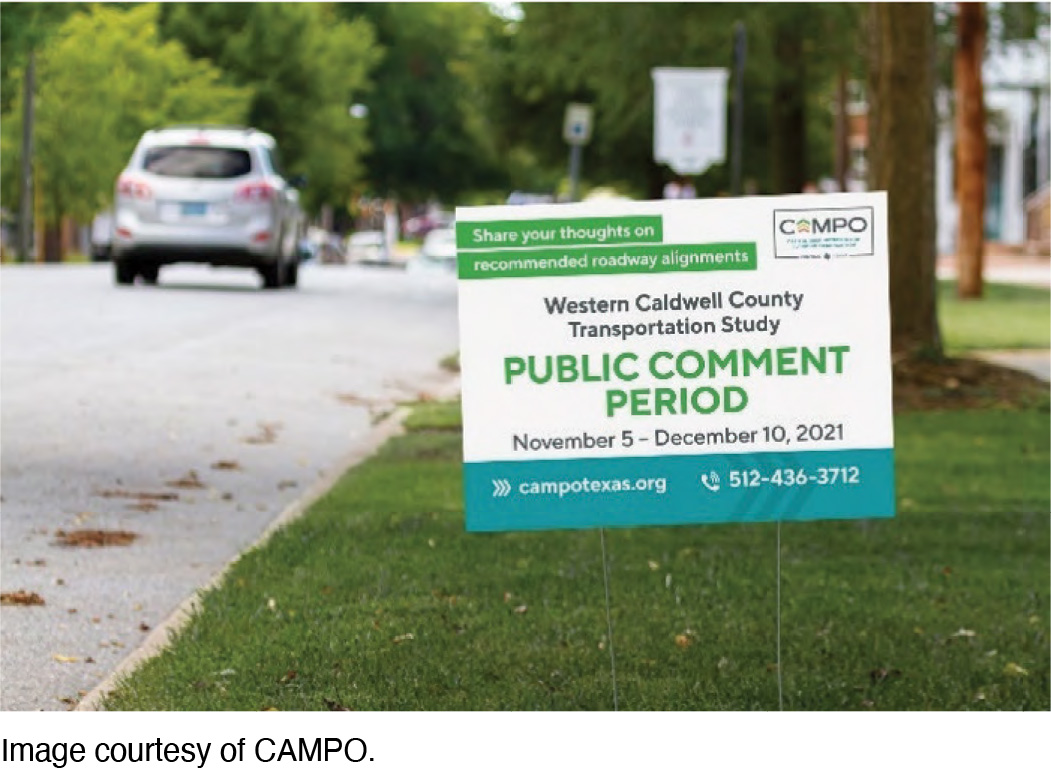
Signs, billboards, and other physical displays, such as point-of-sale video ads at gas pumps or grocery stores, can also be used to reach people as they travel or shop (Figure 14). Variable message signs along highways and other major roads can provide visibility to a widespread audience.
Pop-up outreach or staffing a table at community events provides a way to reach people who might not otherwise be aware of a project. These also help to build relationships through personal contact. Quick response (QR) codes can be incorporated into pop-up materials, meeting flyers, and other physical displays to enable viewers to access information such as meeting details or a survey. An agency might post informational flyers with QR codes on telephone poles adjacent to an intersection that is an area of interest in an online mapping engagement activity. Pedestrians using that intersection could be prompted to scan the QR code on the spot and share real-time feedback on safety improvements.
Long Description.
The text on the placard reads as: Share your thoughts on recommended roadway alignments. Western Caldwell County Transportation Study. Public Comment Period. November 5 to December 10, 2021. The bottom text includes ‘campotexas.org’ and the number 512-436-3712. In the background, a car is driving away on the road. Image courtesy of CAMPO.
2.6 Comprehensive Engagement Platforms
A final VPI tool category consists of comprehensive engagement platforms that agencies and practitioners can use to manage the overall VPI process (and their in-person engagement). These platforms, sometimes referred to as All-in-One Tools, are designed to streamline engagement efforts. They consolidate various engagement tools and features into one cohesive interface, providing a unified experience for administrators and participants.
Key features of comprehensive engagement platforms include the ability to host virtual meetings and webinars, conduct surveys and polls, manage interactive discussions, and analyze engagement metrics—all within one platform. Many of the platforms include comment database features that can be especially useful in managing and analyzing the large volume of comments often produced in VPI engagement. They typically provide seamless integration with other communication tools, such as email and social media, to maximize reach and participation. Security and privacy are paramount in these platforms, with features like password-protected meetings, encryption, and access controls. The ability to customize branding and design elements allows organizations to maintain a consistent and professional appearance across all engagement.
Many comprehensive engagement platforms include comment management features. Comment management technology is evolving rapidly with the use of AI to synthesize key themes and assess participantsʼ perspectives and sentiments. Many AI-powered tools are available for “sentiment analysis” and can be used to gain insight into opinions and comments conveyed in online posts. These tools can analyze a large quantity of data in a short time, allowing your agency to process feedback quickly. AI researcher V. Kanade (2022) describes four types of sentiment analysis: fine-grained, aspect-based, emotion detection, and intent analysis. Once analyzed, this information can then be incorporated into the next phase of the planning process.
- Fine-grained: categorizes comments into positive, negative, or neutral orientations
- Aspect-based: summarizes the content of a comment into a few keywords and categorizes the nature of the comment as positive, negative, or neutral
- Emotion detection: analyzes the nature of a comment through consideration of words connotating positive, negative, or neutral emotions
- Intent analysis: determines the general sentiment conveyed in a comment; for example, an AI-powered tool can quickly determine a userʼs level of interest, favorability, or aversion to an idea, proposal, or strategy
Iowa DOT used its Public Involvement Management Application tool on the Black Hawk Bridge project to gather digital comments, share recorded presentations, and provide virtual public hearings via streaming and as an on-demand opportunity. A unique feature of the platform is a sliding scale or favorability index that participants can use to indicate their level of support for a project. By tracking this index over time, Iowa DOT found that the favorability of the Black Hawk Bridge project improved significantly as more outreach occurred. (FHWA 2024b; “Successes in Stewardship Newsletter: Incorporating Public Involvement Strategies”)


