Global Environmental Change: Research Pathways for the Next Decade (1999)
Chapter: Color Plates 1-8
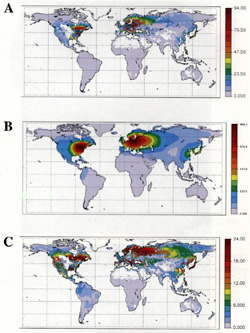
PLATE 1 (a) Spatial distribution of the 1990 carbon sink resulting from fossil fuel nitrogen deposition between 1845 and 1990. Values are in g C/m2; the simulation used fw = 0.5 and Nloss= 0.2, where total global carbon uptake was 0.74 Pg. (b) Fossil fuel nitrogen deposition on land (kg/km2) for 1990 as estimated by the GRANTOUR atmospheric transport model (Penner et al., 1991). (c) Same as (a) except that for this simulation Nloss increases with N deposition. SOURCE: Townsend et al. (1996). Courtesy of the Ecological Society of America.
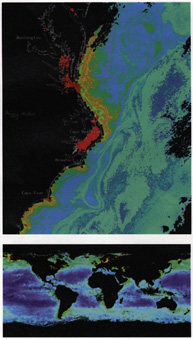
PLATE 2 New images of ocean color from the SeaWlFs instrument. The upper panel shows a high resolution of the coastal oceans off northeastern North America. The lower panel shows a global view. Ocean “color” measures the density of photosynthetic pigments in marine organisms (phytoplankton). This information, the first of its type for over 10 years, can be used to understand marine ecology, fisheries, and physical processes. SOURCE: Data from the SeaWIFs project home page (http://seawifs.gsfc.nasa.gov/SEAWIFS.html).

PLATE 3 Current land cover for the conterminous United States (1-km resolution). Classes under 100 are natural vegetation types (with little or some level of human management) and correspond to classes used in VEMAP (VEMAP Participants 1995; Kittel et al., 1995). Those over 100 are cover types dominated by agriculture. SOURCE: Based on Loveland et al. (1991). Courtesy of the American Society for Photogrammetry and Remote Sensing.
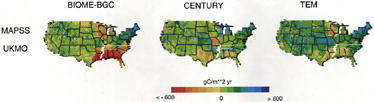
PLATE 4 Change in net primary productivity when biogeochemical models (BIOME-BGC, CENTURY, and TEM) are run using climate change scenarios from the Geophysical Fluid Dynamics Lab, United Kingdom Meteorological Office (UKMO), and OSU models and the altered vegetation distributions predicted by the biogeographic models (see Table 2.2). Results are shown for the simulations using the MAPSS biogeography model and UKMO climate. This shows patterns of change when climate change effects on ecosystem function (plant growth, respiration, nutrient cycling) and ecosystem structure (distributions of forests, grasslands, etc.) are considered together. SOURCE: VEMAP Participants (1995). Courtesy of the American Geophysical Union.
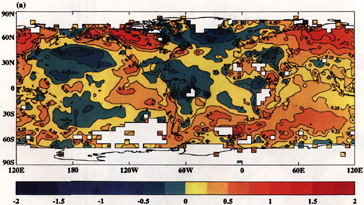
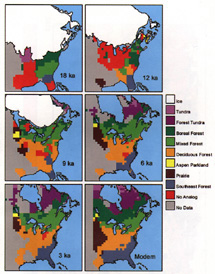
PLATE 6 Selected paleovegetation maps for 18,000 years ago (18 ka) through modern times, reconstructed using the method of modern analogs and over 13,000 samples of fossil and modern pollen (Webb et al., 1991; Overpeck et al., 1992). No vegetation is mapped in areas without fossil pollen data; “no analog” refers to vegetation without any modern analog. SOURCE: Overpeck et al. (1992). Courtesy of the Geological Society of America.
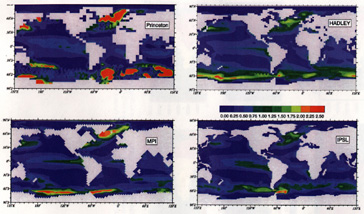
PLATE 7 Air-sea δ CO2 flux (1990) [mol m2 yr-1]. Oceanic uptake of anthropogenic CO2 by four different models; global spatial distribution. Results show that, although the models all have the same overall pattern of enhanced uptake in upwelling and convective regions and weak uptake in downwelling regions, there are dramatic regional differences, particularly in the Southern Ocean. Courtesy of the IGBP/GAIM Ocean Carbon Modeling Intercomparison Project.