Previous Chapter: Appendix D: Biographical Information for Task Group Members
Suggested Citation: "Chapter 2 Color Plates." National Research Council. 1998. Supporting Research and Data Analysis in NASA's Science Programs: Engines for Innovation and Synthesis. Washington, DC: The National Academies Press. doi: 10.17226/6311.
This page in the original is blank.
Suggested Citation: "Chapter 2 Color Plates." National Research Council. 1998. Supporting Research and Data Analysis in NASA's Science Programs: Engines for Innovation and Synthesis. Washington, DC: The National Academies Press. doi: 10.17226/6311.

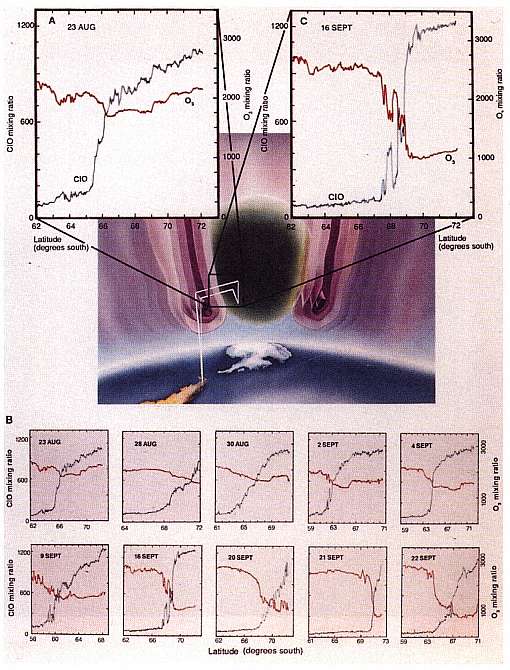
Plate 2.1 Rendering of the containment provided by the circumpolar jet that isolates the region of highly enhanced C1O (shown in green) over the antarctic continent. Evolution of the anticorrelation between C1O and O2 across the vortex transition is traced from (A) the initial condition observed on August 23, 1987, on the southbound leg of the flight, (B) the summary of the sequence over the 10-flight series, and (C) the imprint on O3 resulting from 3 weeks of exposure to elevated levels of C1O. Data panels do not include the dive segment of the trajectory; C1O mixing ratios are in parts per trillion by volume, and O3 mixing ratios are in parts per billion by volume. SOURCE: J.G. Anderson, D.W. Toohey, and W.H. Brune, "Free Radicals Within the Antarctic Vortex: The Role of CFCs in Antarctic Ozone Loss," Science 251:39-46, 1991.

Suggested Citation: "Chapter 2 Color Plates." National Research Council. 1998. Supporting Research and Data Analysis in NASA's Science Programs: Engines for Innovation and Synthesis. Washington, DC: The National Academies Press. doi: 10.17226/6311.

Plate 2.2 Hubble deep-field image. Source: Courtesy of R.E. Williams, Space Telescope Science Institute.

Suggested Citation: "Chapter 2 Color Plates." National Research Council. 1998. Supporting Research and Data Analysis in NASA's Science Programs: Engines for Innovation and Synthesis. Washington, DC: The National Academies Press. doi: 10.17226/6311.

Plate 2.3 Muriel Ross (center) and Rei Cheng (left) use an immersive virtual environment workbench and special "Crystal Eyes" glasses to study a three-dimensional image of a skull. The skull was reconstructed from a computer tomography scan using special software developed in the NASA Ames Biocomputation Center. Interaction with images can be achieved using a pencil-like pointer (stylus) or special gloves as shown here. SOURCE: Courtesy of M.D. Ross, NASA Ames Research Center.

Suggested Citation: "Chapter 2 Color Plates." National Research Council. 1998. Supporting Research and Data Analysis in NASA's Science Programs: Engines for Innovation and Synthesis. Washington, DC: The National Academies Press. doi: 10.17226/6311.
Page 102
Suggested Citation: "Chapter 2 Color Plates." National Research Council. 1998. Supporting Research and Data Analysis in NASA's Science Programs: Engines for Innovation and Synthesis. Washington, DC: The National Academies Press. doi: 10.17226/6311.
Page 103
Suggested Citation: "Chapter 2 Color Plates." National Research Council. 1998. Supporting Research and Data Analysis in NASA's Science Programs: Engines for Innovation and Synthesis. Washington, DC: The National Academies Press. doi: 10.17226/6311.
Page 104
Suggested Citation: "Chapter 2 Color Plates." National Research Council. 1998. Supporting Research and Data Analysis in NASA's Science Programs: Engines for Innovation and Synthesis. Washington, DC: The National Academies Press. doi: 10.17226/6311.
Page 105
Subscribe to Email from the National Academies
Keep up with all of the activities, publications, and events by subscribing to free updates by email.