Resilient Zero-Emission Transit Bus Fleets: A Guide (2025)
Chapter: 4 Why Zero-Emission Resilience Planning Is Different

CHAPTER 4
Why Zero-Emission Resilience Planning Is Different
The nature of ZE technologies requires a close re-examination of resilience practices and the development of strategies to mitigate new risks. A key principle is that, overall, the total energy on board a ZEB is lower than that of typical internal combustion engine buses (ICEBs). Therefore, there is less energy in reserve on a ZEB and less margin to accommodate variations in energy consumption per mile, even though battery-electric buses (BEBs) and fuel-cell electric buses (FCEBs) are more efficient than ICEBs (Figure 3).
Additionally, there is pressure to realize the savings of lower ZEB operating costs by maximizing asset utilization and associated infrastructure due to higher capital costs. Without factoring resilience needs into ZEB planning, this can result in an over-optimized service and fleet design with low resilience by developing ZE operating plans with little margin to absorb adverse events, especially when compared to incumbent technologies. For example, a highly efficient ZE bus may be assigned to routes where it can complete daily service but does not have much extra energy on board to accommodate adverse conditions. In another example, inherent limitations of the ubiquitous on-demand electricity distribution system (what is often called “the grid”) mean that an agency cannot stockpile reserve electricity easily without significant capital investment. These differences from the incumbent technologies, i.e., fossil fuels and ICEBs, mean that risk mitigation and resilience must be considered differently for ZE fleets. There are two main considerations for resilience planning for ZE systems that are significantly different from incumbent technologies: fuel supply security, namely readily available supply of electrical power and/or hydrogen fuel; and vehicle and infrastructure performance variability, such as extreme temperature impacts on vehicle range. These considerations are elaborated in the remainder of Chapter 3.
Fuel Supply Security
Fuel supply security is a key component of a resilient transition to ZE. Regardless of fuel type, agencies need a reliable fuel supply that can support all service requirements or contingencies despite disruptions. While agencies have decades of experience in dealing with the concerns relevant to fossil fuels, a top concern for agencies interviewed during the development of this guide was the differences in electric power or hydrogen supply security. There are a few differences between fossil fuels and electric power or hydrogen supply in the 2024 energy landscape that are relevant considerations for resilience.
Electric Fuel Supply
While electricity has reduced emissions, diversity of sources, and increased efficiency when compared to fossil fuels, differences in how electricity is currently generated, transmitted, and distributed impact its resilience as an energy source. There are four main differences for electric
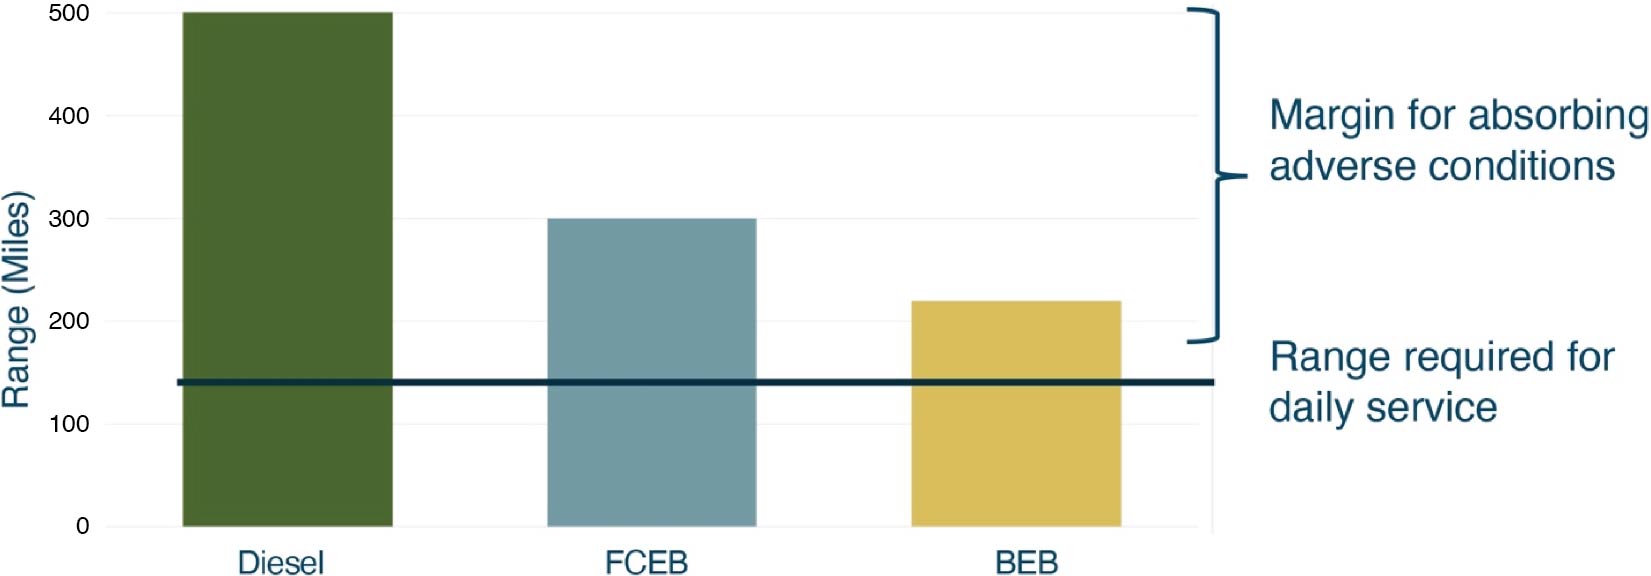
Long Description.
The horizontal axis shows three types of fuels. The vertical axis shows the range in miles from 0 to 500 in increments of 100. A horizontal line parallel to the x-axis is drawn along 135 of the y-axis and labeled 'Range required for daily service.' The area above this line is marked 'Margin for absorbing adverse conditions.' The bar values given in the graph are as follows: Diesel: 500. FCEB: 300. BEB: 210. All three bars are above the required range line. Note that the bar values are approximate.
charging from fossil fuels for resilience: storage, fill time, grid dependence, and pricing (summarized in Table 2).
- Storage: Typically, an agency does not have electricity stored on site in the same way that diesel reserves are stored on site, so that, unless mitigation measures are taken, even a supply disruption of a few hours could significantly interrupt operations. While batteries can be used to store electricity on site, it is expensive and requires more physical space than the equivalent in diesel (which is often stored underground, with no impact on the usability of yard space). The energy to fully charge 2–8 buses requires a battery energy storage system (BESS) the size of a shipping container; storing enough for a fleet would require significant real estate. Additionally, even with an on-site BESS, electricity cannot be stored indefinitely, and batteries discharge and degrade over time.
- Fill time: Charging takes much longer than fuel filling, on the order of hours instead of minutes, leading to less flexibility in operations and a higher need for planning. In typical service, BEBs are scheduled with appropriate routes and time for charging, but in unexpected or emergency scenarios, the lengthy charging times mean that every bus might not be immediately available to deploy. Additionally, charging times might vary depending on environmental conditions. These are explored under “Zero-Emission Bus and Infrastructure Performance Variability.”
- Grid dependence: Without additional infrastructure, electric charging is reliant on a single source: the local grid. [Note that hydrogen and compressed natural gas (CNG) dispensing also requires electric power; however, the power and energy needs are much less than charging many buses.] Grid reliability is highly variable across the U.S., with the average customer
Electricity |
Fossil Fuel |
|
|---|---|---|
Storage |
Infeasible to store electricity on site equivalent to a tank of diesel. |
Can store on site. |
Fill time |
Charging takes hours instead of minutes, so agencies have less flexibility in an unplanned scenario. |
Diesel fills take minutes, so buses can be quickly deployed. |
Supplier dependence |
Agencies cannot quickly pivot to a different supply of electricity other than their local grid. |
Agencies can pivot to a different supplier and ship it in from across the country if necessary. |
Pricing |
Unplanned charging during peak hours can incur a significant, avoidable cost. Depending on the utilityʼs rate schedule, one single high-power event could set the demand charge for a month, season, or year. |
The price of diesel in a tank on site will not change once it is there, no matter what time of day it is dispensed. |
- experiencing 1.4 outages per year lasting an average of 5.1 hours (U.S. Energy Information Administration 2024, see Figure 4).
- With ICEBs, an agency typically has 4 days of fuel in storage. A long-term interruption in diesel supply can be remedied by purchasing from another supplier (though CNG is also dependent on the natural gas pipeline grid for distribution, CNG can be shipped by trucks or ships as well). With BEBs, an agency generally only has one power utility option in a region and cannot quickly pivot to an alternate supply without additional infrastructure. Relying on a single source of fuel could affect an agencyʼs ability to meet service requirements during disruptions. Metro Transit in Minnesota is mitigating risks associated with dependence on the local electric grid by installing dual feeds at one of its facilities.
- Pricing: The price of electricity is highly variable by region and based on a combination of the total amount of energy used, peak power demand, time of use, and fixed fees (Jerram 2024). Thus, electricity consumption, if used outside of an agencyʼs typical cost-optimized charging schedule, may result in unexpected and excessive costs for fuel. This level of variability, impacted by operational decisions, does not have an equivalent in fossil fuel pricing. In disruptions, unplanned service needs, or emergencies, the financial cost of charging could be very high and have large financial consequences. For example, a Southern California Edison rate schedule prices energy used during on-peak times in the summer as three times more expensive than energy used during the off-peak period (Southern California Edison 2024).

Long Description.
The horizontal axis shows the duration an average customer experiences power interruption in hours from 0 to 25 in increments of 5. The vertical axis shows the number of interruptions per year from 0 to 4 in increments of 1. A cluster of unlabeled plots is located between 0 and 10 on the x-axis and 0 and 3 on the y-axis. The major plots marked in the graph are US average: (5.5, 1.4); Tennessee: (6.5, 3.2); Alaska: (9.8, 3.6). New Hampshire: (10.2, 1.8). Vermont: (16.0, 2.7). Maine: (16.1, 3.0). West Virginia: (16.5, 2.7). Florida: (19.0, 1.5). Note that the coordinate values are approximate. Source: U.S. Energy Information Administration (2024).
Hydrogen |
Fossil Fuel |
|
|---|---|---|
Storage |
Infeasible to store large amounts on site in gaseous form due to its low density, and liquid loses significant amounts to boil-off. |
Can store on site for emergency use. |
Mobility Market Supply |
Agencies cannot use public stations in most areas if their contracted providers fall through. Limited sourcing of liquid hydrogen and fuel cell grade hydrogen. |
There are plenty of providers of diesel and CNG, including public stations. Multiple sources of diesel. |
Hydrogen Fuel Supply
Hydrogen as a fuel has similar properties to fossil fuels, but the infrastructure and technology for using hydrogen in mobility applications are more nascent and less resilient. The main differences in a resilience context are storage and mobility market supply (summarized in Table 3). The following list provides further details on the differences between hydrogen and fossil fuels in the context of resilience:
- Storage: Hydrogen, like fossil fuels, can be stored on site. In a gaseous state, it can be stored for extended periods, but due to its low density, it is not very space-efficient (a gaseous delivery tanker holds a few hundred kilograms). Liquid hydrogen is denser and more space-efficient (a liquid delivery tanker holds a few thousand kilograms), but it is not suitable for long-term storage due to significant loss from boil-off (Arsad et al. 2023). Additionally, even though liquid hydrogen is more space-efficient than gaseous hydrogen, it cannot be stored underground at this time and is not as space-efficient to store as diesel. These factors prevent an agency from stockpiling hydrogen for extended emergency scenarios beyond a few days.
- Supply: While transit agencies typically do not store more than a few daysʼ supply of diesel or CNG either, the hydrogen supply for mobility applications is relatively new and less developed than the fossil fuel supply. If there is a fuel disruption that impacts an agencyʼs primary and secondary hydrogen providers, an agency currently cannot usually fuel buses at a local public station like a diesel bus due to the lack of public hydrogen stations. There are funding programs designed to increase supply, such as the Department of Energyʼs Hydrogen Shot, which will increase the market maturity and make supply more resilient in the next decade (U.S. DOE Office of Energy Efficiency and Renewable Energy 2021). Specifically, DOE has selected seven regional clean hydrogen hubs focused on increasing hydrogen production capacity. Transportation is one of the identified end uses for this hydrogen, and transit agencies are leading the way in this sector, potentially able to be early beneficiaries of the Hydrogen Hub program outcomes.
- Power Dependence: Hydrogen dispensing is power dependent, but the levels of power required are much smaller than what is required for charging a BEB fleet and can be easily supplied by a backup generator. A permanent liquid hydrogen station can typically be supported by a 125–350 kilowatt (kW) generator, depending on station size and configuration.
ZEB and Infrastructure Performance Variability
The performance variability of ZE vehicles and infrastructure is a key component to consider in resilience planning. Vehicles and infrastructure need to meet service requirements in all the environmental or service conditions an agency could face; however, BEBs, FCEBs, chargers, and hydrogen infrastructure performance are currently more influenced by external factors than ICEBs are. The main concerns for agencies to meet service needs are (1) the bus range and (2) the refueling time. First, the total energy on board a ZEB is lower than on board an ICEB. Despite the much higher energy efficiency of ZEBs, there is less energy in reserve on a ZEB and less margin to accommodate variations in energy consumption per mile (Figure 5).

Long Description.
The horizontal axis shows three types of fuels; Diesel, FCEB, and BEB. The vertical axis shows the range in miles from 0 to 600 in increments of 100. The bar values given in the graph are as follows: Diesel: 500; FCEB: 300; BEB: 210. Note that the bar values are approximate.
Additionally, ZEB fuel economy varies proportionally more than ICEB with any extra power requirements, such as heating, ventilation, and air conditioning (HVAC), due to ZEBʼs high efficiency. As a result, the range can vary more significantly on a ZEB, and that range is typically much closer to the agencyʼs service requirement than it would be for an ICEB, if the ZEB can meet the service requirement at all (as many transit agency routes cannot be completed by BEBs with todayʼs technology). Second, refueling time is generally longer for ZEBs. BEBs take hours to charge, and FCEB fueling, while comparable to CNG, is highly dependent on infrastructure. The following sections address the factors that impact performance variability and refueling time, and how those affect an agencyʼs resilience.
Range Reduction in Potential Resilience Scenarios
Strenuous conditions will reduce ZEB range, which could impact the ability to complete the service. Strenuous conditions include extreme temperatures, icy conditions, high passenger loading, high speeds, and steep topographies. Proper ZE transition planning includes a feasibility assessment to determine which blocks or routes can be achieved with the available energy on board a bus under both nominal and strenuous conditions; however, strenuous conditions also impact ZEB performance under different threat and service need scenarios and should be evaluated in resilience planning efforts.
A resilience scenario with extreme ambient temperatures can reduce ZEB range due to HVAC loads (Joint Office of Energy and Transportation 2024a). While extreme temperatures negatively affect fuel economy for conventional ICEBs, the effect is more extreme on ZEBs (Wu et al. 2022). Electric HVAC can use more energy than the tractive load on a ZEB (Joint Office of Energy and Transportation 2024b). In ICE vehicles, there is waste heat from the combustion engine in all conditions, which can heat the vehicle. BEBs operate with high efficiency and do not have extra waste heat from the propulsion system; therefore, heating must use energy from the high-voltage (HV) battery, and this heat is typically generated through resistive heaters (though heat pumps can offer a more efficient solution, they are not currently standard on ZEBs) (Haroldson 2024). Though fuel cell stacks generate some waste heat that can be used to heat the bus interior, at low temperatures, additional heaters may be necessary. Resistive heating requires a significant amount
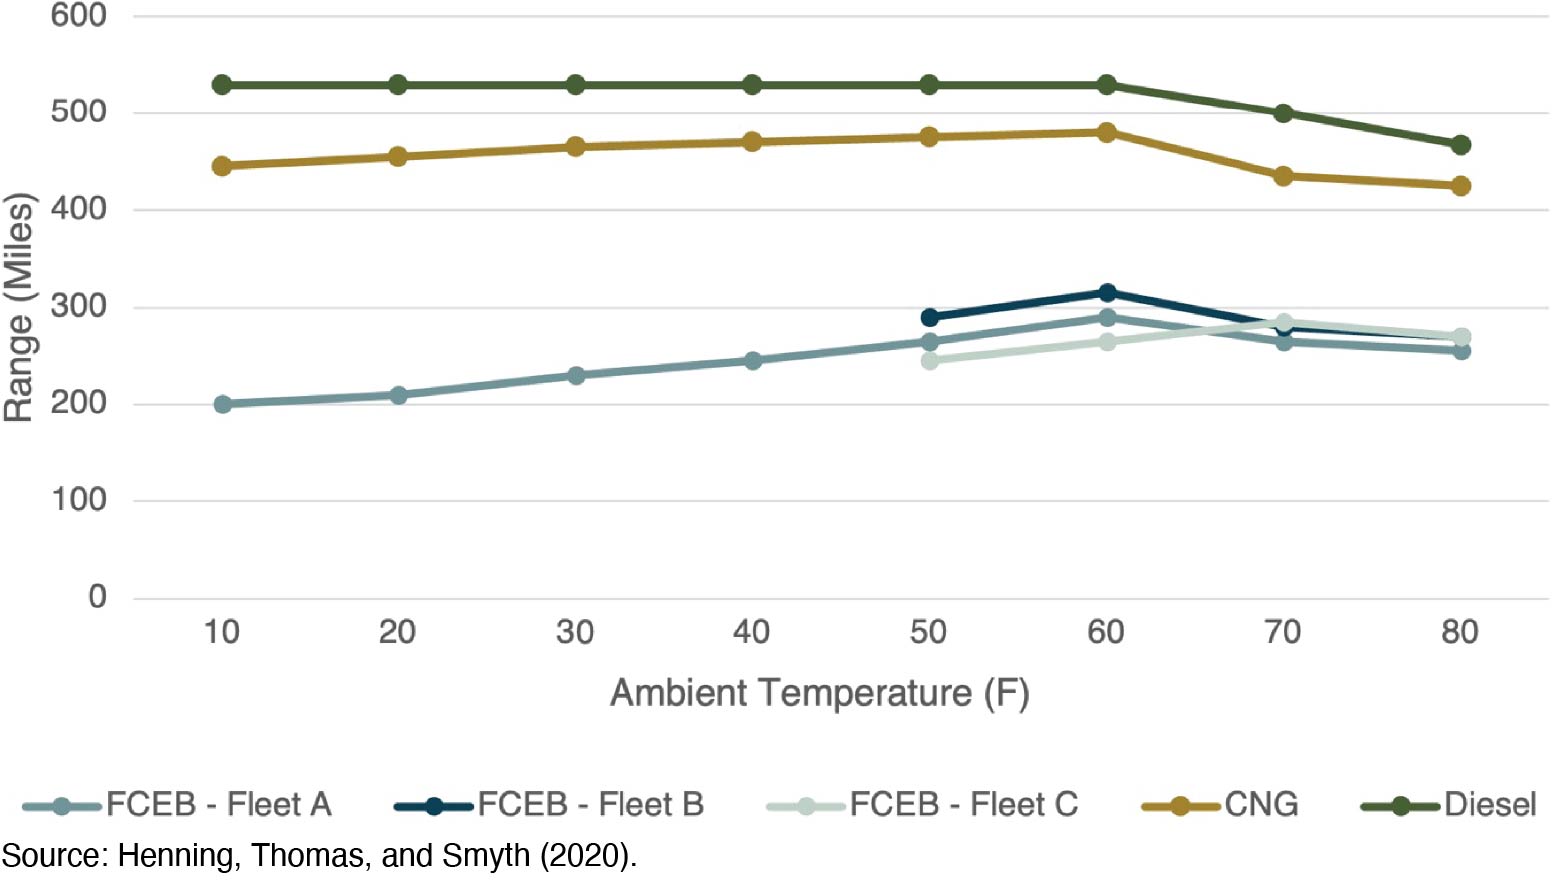
Long Description.
The horizontal axis shows ambient temperature in Fahrenheit from 10 to 80 in increments of 10. The vertical axis shows the range in miles from 0 to 600 in increments of 100. The graph consists of five lines representing five different fuels. The data given in the graph are as follows: FCEB - Fleet A: The line begins at (10, 200), reaches (60, 295), and ends at (80, 250). FCEB - Fleet B: The line begins at (50, 295), reaches (60, 305), and ends at (80, 280). FCEB - Fleet C: The line begins at (50, 240), reaches (70, 290), and ends at (80, 280). CNG: The line begins at (10, 440), reaches (60, 495), and ends at (80, 420). Diesel: The line begins at (10, 530), reaches (60, 525), and ends at (80, 480). Note that the coordinate values are approximate. Source: Henning, Thomas, and Smyth (2020)
of power (typically around 20 kW based on recent Altoona test reports for 40-foot transit buses). According to a 2020 study, BEBs lost about 37% of their range at 22–32°F compared to 50–60°F, while FCEBs lost 23% of their range. According to the same study, the fuel economy (average diesel gallon equivalent per 100 miles) worsened at 70–80°F (compared to 50–60°F) by about 6% for both FCEBs and BEBs (Henning, Thomas, and Smyth 2020). In hot weather, AC can decrease range by consuming significant energy on ZEBs because the air compressors are run off of the HV battery instead of being belt-driven like an ICEB. There are also cooling components for the batteries and power electronics that may not be present on an ICEB. Figure 6 shows FCEB, CNG, and diesel range vs. temperature, and Figure 7 demonstrates the variability in fuel economy vs. temperature for BEBs vs. CNG and diesel over the course of 2 years.
Beyond HVAC for the cabin and passengers, the external temperature could affect the battery or fuel cell stack temperature and reduce range (Joint Office of Energy and Transportation 2024b). Batteries have a small window of optimal operating temperatures. Operating outside of those
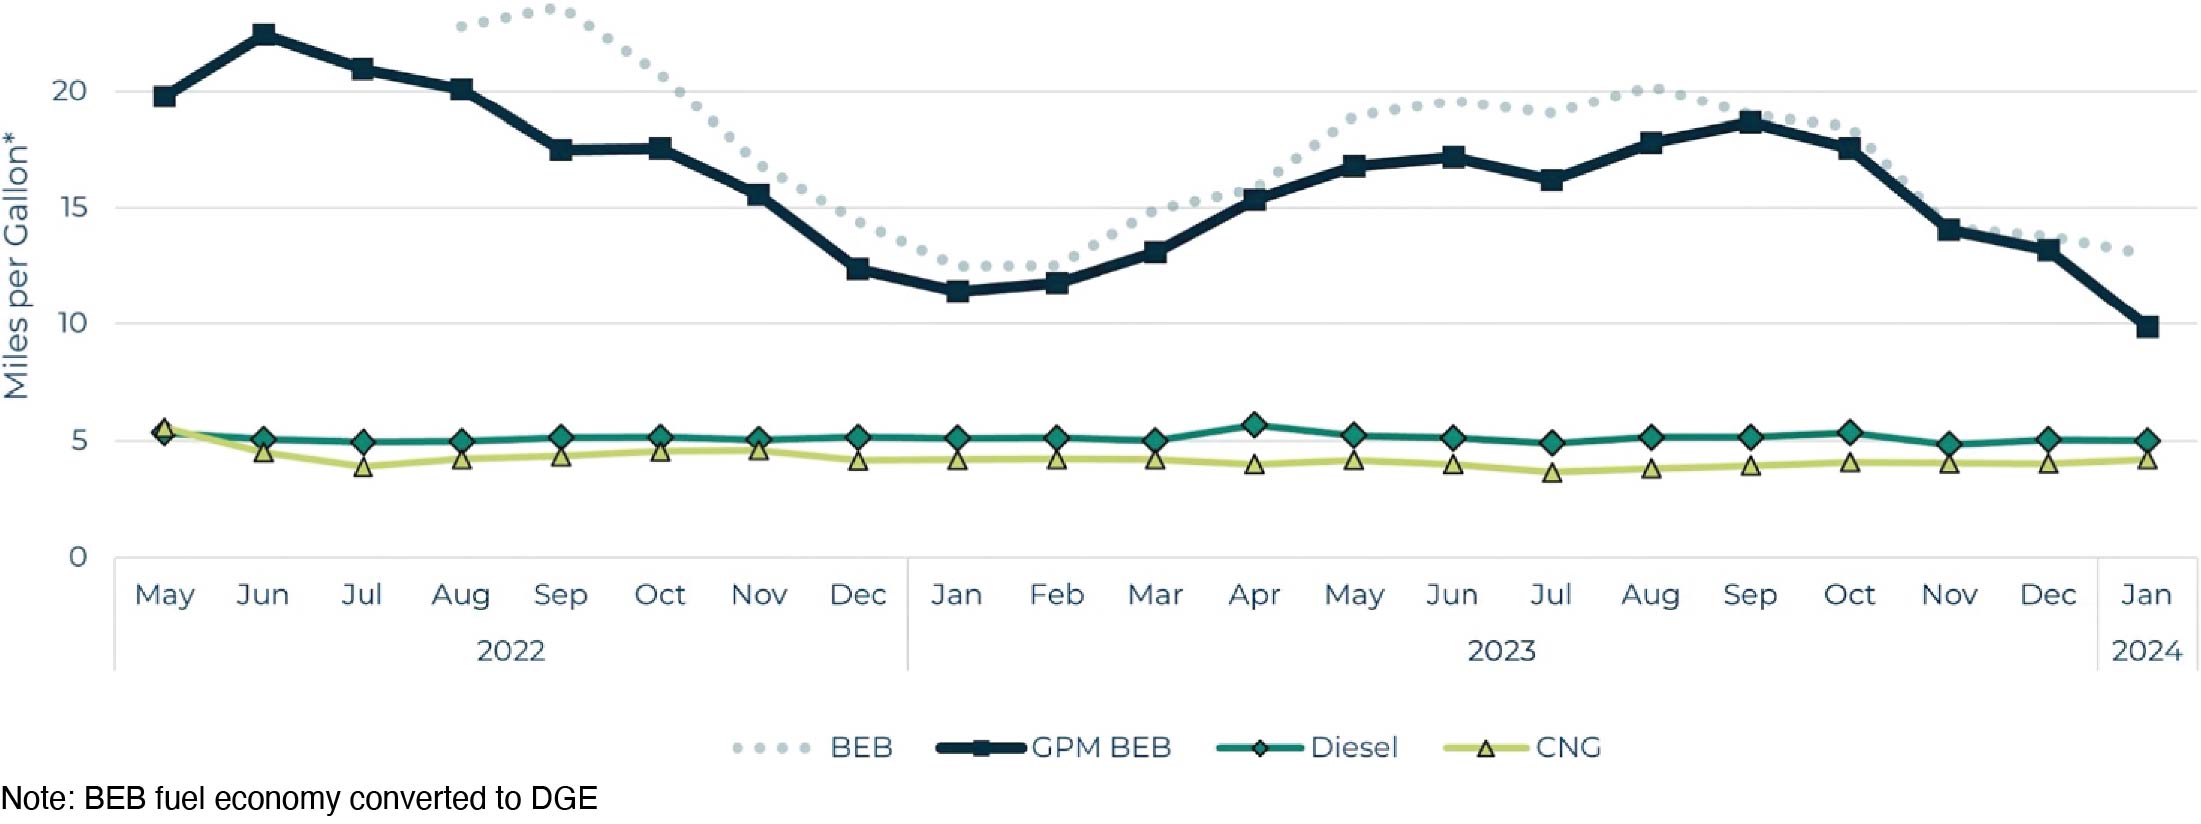
Long Description.
The horizontal axis shows years and months from May 2022 to January 2024 in increments of one month. The vertical axis shows miles per gallon from 0 to 20 in increments of 5. The graph consists of four lines representing various fuels. The data given in the graph are as follows: BEB: The line begins at 23 in August 22, reaches 12 in Jan 23, 20 in Aug 23, and ends at 13.5 in Jan 24. GPMBEB: The line starts at 19.5 in May 22, reaches 11 in Jan 23, 15.5 in July 23, and ends at 10 in Jan 24. Diesel: The line begins at 5 in May 22, reaches 5.1 in April 23, 5 in Aug 23, and ends at 5 in Jan 24. CNG: The line begins at 5 in May 22, decreases to reach 4.9 in Dec 22, 4.8 in July 23, and ends at 5 in Jan 24. Note that the coordinate values are approximate. Note BEB fuel economy converted to DGE
temperatures can reduce battery longevity, so some manufacturers will not allow the bus to be driven if the battery is too cold. Most buses today have a battery thermal management system (BTMS), limiting the impacts of ambient temperature on battery health and safety.
After being parked outside in cold weather, the busʼs BTMS can precondition, or preheat, the battery before the designated pull-out time; however, this uses energy from the battery. So, if pre-conditioning happens when the bus is not plugged in, the bus will pull out for service with less than 100% state-of-charge (SOC), limiting its range. While planning for pre-conditioning at a designated pull-out time is feasible on a normally scheduled day, an unexpected resilience need for the bus in extreme cold may require waiting and using battery energy to warm the battery. Without mitigations to prevent a battery from getting cold in the first place, this could limit service operations or emergency response.
With respect to fuel cells, temperatures below freezing are detrimental as the water can freeze in the fuel cell and could damage the stacks or other components (Song et al. 2021). Many buses purchased today already have adaptation measures in place to mitigate this risk. Additionally, a thermal management system maintains operating temperatures in the stack to prolong the life and optimize performance of the fuel cell.
Similar to BEBs, a FCEB may not start if the fuel cell (FC) is below freezing temperatures and will need to be warmed before the designated pull-out time. Pre-conditioning the fuel cell using a plug-in resistance heater can keep the FC warm enough for immediate start up. Alternatively, the FCEB battery can supply power to preheat the FC, though this will drain the battery until the bus is turned on, and the FC can recharge it using hydrogen, reducing the amount of hydrogen available to operate the bus in service (Ballard n.d.). In battery-dominant FCEB designs, cold temperatures of the HV battery on an FCEB may also affect operations by reducing fuel economy and regenerative braking until the battery is warm. While needing to warm up the BEB or FCEB before service is not entirely different from ICEBs that may use block heaters, the impact on range is another consideration for ZEBs needing to meet resilience needs in cold temperatures.
Finally, other strenuous conditions that may be present in a resilience scenario, such as snow, ice, high passenger loads, or topography, can affect range (Joint Office of Energy and Transportation 2024b). The traction control on a ZEB in slippery conditions can disable regenerative braking, which increases the energy consumed from the battery per mile and can reduce range. High passenger loads, which could be necessary in an evacuation scenario, reduce range. Steep grades could also reduce the total available range. Effects will vary depending on the combination of conditions and the bus make and model. While these conditions can be adequately planned for when choosing feasible routes and schedules, responding effectively in an emergency situation also requires planning to understand realistic ranges in strenuous conditions. These scenarios should be studied, and adjustments may be necessary to ensure that unexpected situations can be handled effectively.
Increased Charging or Refueling Time in Potential Resilience Scenarios
The second major component of vehicle and infrastructure performance variability is the charging or refueling time under strenuous and extreme conditions that may be present in a resilience scenario.
First, charging speeds and hydrogen refueling speeds can be affected by extreme temperatures. In ZEBs, the BTMS is designed to keep batteries at the right temperature for charging and operation, but when the bus is off and stored in hot or cold temperatures, the BTMS is not running, and batteries can heat up or cool down. If a BEB is cold when it is plugged in, it will charge slowly
until the BTMS can warm up the battery to prevent damage during charging. Generally, a bus can fully charge in 4–6 hours, depending on SOC, battery size, and charger power, but a cold battery on a bus may add 30–60 minutes to charging time. As discussed above, without mitigations in place, unexpected or unscheduled needs may not be able to be immediately met due to lengthy charge times that can become longer depending on the weather. Charging is faster when a battery is warmer, but the BTMS will lower the charge rate to maintain the correct battery temperature and increase charge time. Chargers also have designated operating temperatures, and they may not be operable above the rated temperatures. The variability in charging times and capabilities depending on temperature needs to be accounted for in resilience planning.
The rate of hydrogen fueling can be affected by ambient temperature. The hydrogen gas heats up as it is compressed into the tank of the bus. To combat this, hydrogen is often pre-cooled before dispensing to keep the inevitable temperature rise within the acceptable temperature range of the tanks and dispensing equipment. The speed that hydrogen can be dispensed (the average pressure ramp rate) is dependent on the pre-cooling temperature, ambient temperature, and other station or vehicle parameters such as the initial pressure in the vehicle tank, tank rated pressure (350 bar or 700 bar), and the communications between the bus and the station (Reddi et al. 2017). Warmer ambient temperatures lead to slower filling and longer fill times. Without pre-cooling, filling an FCEB could take upwards of an hour from gaseous storage. Depending on the station infrastructure, if there is not adequate pre-cooling, it may not be able to completely fill the vehicle before reaching temperature limits. As standards governing refueling are improved and adopted, hydrogen fueling will become faster. While hydrogen refueling is much faster than BEB charging, which may be around 4 hours with a 120 kW charger, it is still slower than diesel. While some agencies can completely fill a diesel bus in less than 5 minutes, hydrogen fueling at a permanent liquid station may take 10–15 minutes from empty to full. This is comparable to CNG, and standards are in development that could further reduce these fueling times. Station configuration is critical to achieve fast fill times; a gaseous hydrogen station without pre-cooling may take an hour or longer to fill a bus, impacting an agencyʼs ability to quickly refuel in non-scheduled scenarios. For another example, if the liquid pumps on the station are not submerged, they will require a cool-down period before fueling buses. This could be half an hour, impacting the ability to refill a bus quickly and redeploy it in a resilience scenario.
Finally, charger performance can be affected by snow and ice. Charger airflow inlets and dispensers need to be kept clear of snow and ice, especially on pantograph chargers. Fossil fuel stations also need to be kept clear of snow and ice, but because their physical footprint is smaller to serve the same number of buses as a bank of chargers, it is easier to protect and mitigate risks.
Overall, considering external conditions in a busʼs ability to perform in a resilience scenario is a change from ICEBs. While assessing strenuous conditions for planned blocks and routes is a normal step in a transition plan, it also needs to be considered for emergency or abnormal scenarios. Assessing range, refueling times, storage, and fuel supply under the worst-case scenarios will give an agency a realistic picture of their emergency service capabilities and the adaptations that may be needed to meet their responsibilities and be resilient in the face of threats. The next section will discuss specific threats and their consequences to a ZEB fleet.


