Resilient Zero-Emission Transit Bus Fleets: A Guide (2025)
Chapter: 7 Guidelines for Updating a Zero-Emission Resilience Plan

CHAPTER 7
Guidelines for Updating a Zero-Emission Resilience Plan
Integrating Existing Resilience Plan and ZEB Transition Plan
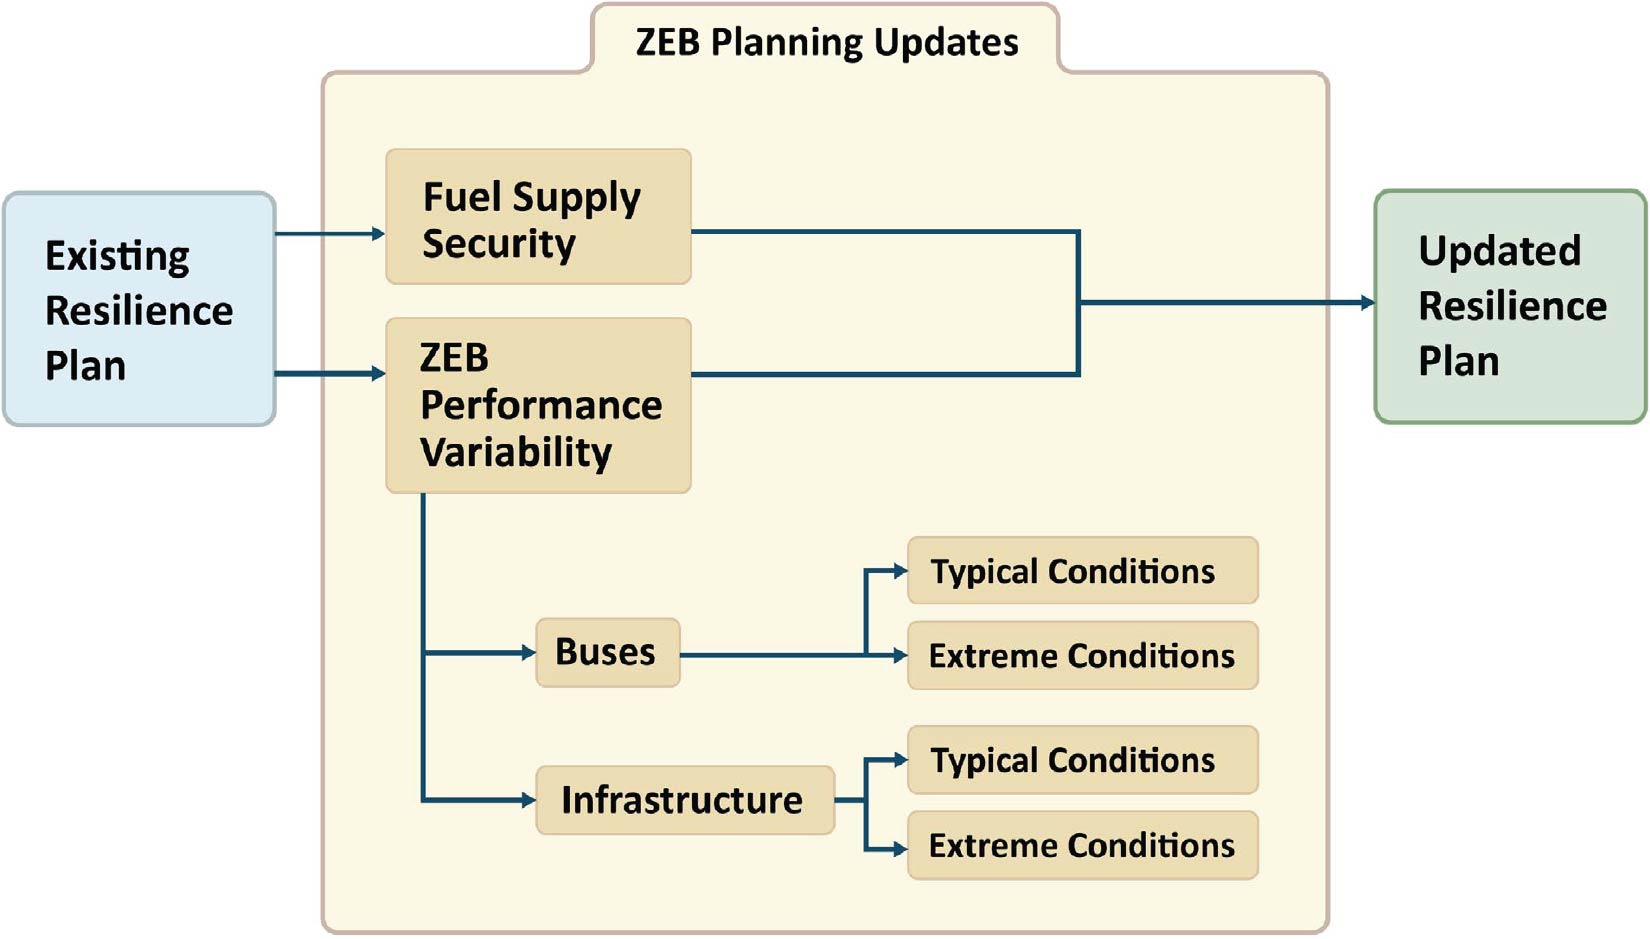
There are two key inputs to updating a resilience plan for ZEBs: the existing general resilience plan and a ZE transition plan. The existing resilience plan will cover the agencyʼs emergency response responsibilities, minimum service level requirements, existing capabilities, and known threats and vulnerabilities (i.e., risks). Many dimensions of any existing resilience plan will still apply to a ZE fleet, such as service levels in hazard situations, passenger communication strategies, or alternate routes; however, as discussed above, there will be additional considerations beyond what is currently evaluated in a resilience plan for an ICE fleet. The ZE transition plan outlines the target technologies, ZEB capabilities, timelines, and planned infrastructure for the zero-emission fleet. The transition plan provides the basis to investigate the two major resilience considerations for ZEBs: fuel supply security and performance variability. Thus, combining the existing general resilience plan with the ZE transition plan is the first step to updating the resilience plan for ZEBs, as shown in Figure 9. Then, the agency can consider novel ZE threats and consequences, reassess their risks with a ZE fleet, consider adaptations, and finally update their resilience plan for their ZE fleet. Guidelines for completing this process are detailed in the remainder of this chapter.
How to Update the Resilience Plan for ZEBs
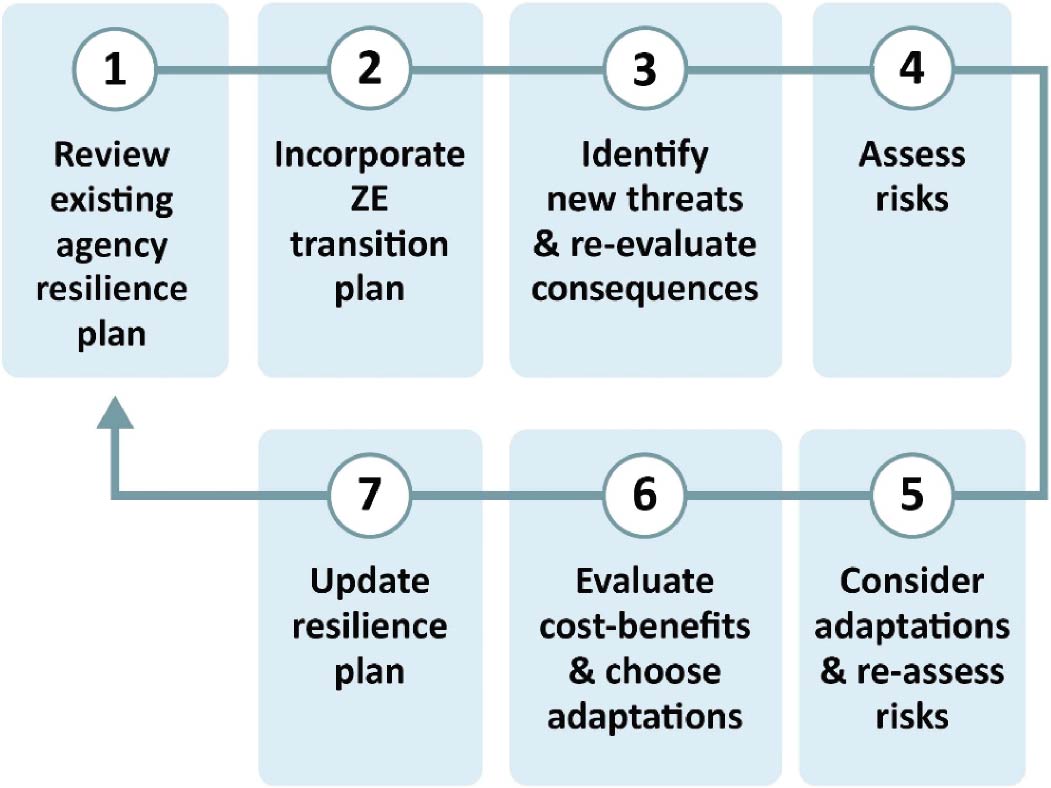
This section will provide agencies with one approach for re-identifying and reassessing threats, consequences, and adaptation measures to update their resilience plan for ZE technologies. This approach begins with the two key inputs, the existing general resilience plan and the ZE transition plan. Then, threats and consequences should be identified for the new ZE fleet, and the risk score for each threat should be calculated. Next, new and existing adaptations should be considered and evaluated. That evaluation will involve calculating changes in risk to the agency as a result of implementing a potential adaptation measure and evaluating the costs for implementation. Finally, the resilience plan should be updated with chosen adaptations over the ZE transition. The key steps for an analysis are outlined in Figure 10 and discussed in detail below.
Step 1: Review Existing Agency Resilience Plan
First, the agency needs to gather the information that is included in its existing resilience plan, such as service levels in different situations, passenger communication strategies, or alternate routes. If it has not already, the agency should determine its minimum service requirements, that is, the level of transit service that needs to be provided in emergency or abnormal situations. For some agencies, this may be equivalent to the level of service they provided during the COVID-19
Long Description.
The flowchart begins with the Existing resilience plan. It leads to a series of processes titled ZEB Planning Updates. Within the ZEB Planning Updates, the plan leads to Fuel supply security and ZEB performance variability. They together led to Updated resilience plan, outside of the ZEB Planning Updates series. The ZEB performance variability leads to Buses and Infrastructure. Buses leads to Typical conditions and Extreme conditions. Infrastructure leads to Typical conditions and Extreme conditions.
pandemic. For example, the agency may have emergency response obligations to meet. These requirements will guide what threats the agency should plan around and what level of adaptation will be needed to provide the required service in each situation with a ZE fleet. If these requirements are not different from the existing resilience plan, this step can be skipped.
Questions to Consider:
- What is the minimum level of transit service that is acceptable if a threat occurs?
- Is there a first responder obligation to support evacuations, sheltering, etc. during a disaster response? What level of service is required to meet this obligation?
- What emergency response planning activities have been conducted to date by the agency, and what are the current capabilities or approaches to emergency response?
Long Description.
The data given in the flowchart are as follows: Step 1: Review existing agency resilience plan. Step 2: Incorporate ZE Transition Plan. Step 3: Identify new threats and re-evaluate consequences. Step 4: Assess risks. Step 5: Consider adaptations and reassess risks. Step 6: Evaluate cost-benefits and choose adaptations. Step 7: Update resilience plan.
- Are there other entities that the agency depends on or that the agency has a responsibility to provide mutual aid to in an unexpected situation?
Next, the agency should characterize its existing assets and adaptation measures in place. If this step was completed in the existing general resilience plan, then the agency only needs to update it for the incoming ZEBs and infrastructure. The assets that are critical to running an ICE fleet will be different than the assets critical for the ZEB fleet. For example, network connectivity may be more critical for the ZEB fleet to manage vehicle range in real-time and conduct charging operations that rely on charge management software. Additionally, critical assets may be in more locations for a ZEB fleet, such as on-route chargers.
Questions to Consider:
- Which assets are most critical for meeting the level of service requirements in different scenarios (buses, software, staff, chargers, fueling infrastructure, etc.)? How do they change for a ZE fleet?
- What is the age and condition of these assets, and how vulnerable are these assets to the hazards identified by the agency in its Resilience Plan?
- What measures are already in place to protect against potential threats or disruptions? Do those measures protect a future ZE fleet and allow it to meet the targeted level of service based upon the asset condition and the scale of the hazard event?
Step 2: Incorporate the Zero-Emission Transition Plan
Next, the ZE transition plan needs to be integrated with the resilience plan. The transition plan defines how quickly the ZE transition will occur, and thus how quickly new resilience measures need to be added. It also defines the technologies that will be pursued, such as battery electric versus fuel cell, types of chargers, or types of hydrogen fueling infrastructure. Gathering this information will set up the rest of the threat, consequence, and adaptation analysis for the updated resilience plan.
Questions to Consider:
- What level of ZE adoption is planned?
- What percentage of the fleet is ZE now? In 5 years? In 20 years?
- Are there different potential transition scenarios that would affect resilience (e.g., FCEB vs BEB, or speed of transition)?
Step 3: Identify New Threats and Re-Evaluate Consequences
With a clear understanding of an agencyʼs existing conditions and ZEB transition plan, the threats and consequences to a ZE fleet need to be identified and evaluated. An agency should start this discussion by outlining the threats in the existing resilience plan, brainstorming, and adding any additional threats that could impact a ZE fleet. The section “Zero-Emission Bus Fleet Hazards and Consequences” may help identify categories of newly applicable threats. The New York Metropolitan Transit Authority (MTA) case study showcases a transit agency that has undergone this part of the planning process.
Step 3a: Identify New Threats
Alongside each threat, the agency should identify the level of service that would be required if that threat is realized as defined in Step 1. Define a list of threats to examine as shown in Table 5. If multiple transition scenarios are under consideration, note which threats are relevant to each scenario. The agency can limit the total number of threats to evaluate by combining threats with
Threat |
Threat Description |
100% BEB |
Mixed - |
100% |
|---|---|---|---|---|
Power Outage Due to Grid Overload – 8 Hour |
Power outage in Agencyʼs service area lasting 8 hours; no compounding natural disaster impacts to the community. Expectation for normal service. |
Applicable |
Applicable |
Applicable |
Hurricane with Large Evacuation Effort |
Evacuations requiring 80 buses on a 24/7 basis. Total duration of impacts about 48-72 hours. Round trip about 40-50 miles; 75% freeway driving, duration about 90 minutes. Remaining 25% of fleet is in reduced revenue service. After 72 hours, evacuation/re-population support expected. |
Applicable |
Applicable |
Applicable |
Extreme Heat Event – 3 Days |
Expectation for normal service. Additional buses deployed as mobile cooling shelters during daytime. |
Applicable |
Applicable |
Applicable |
Hydrogen Fueling Equipment Failure |
Hydrogen shortage due to force majeure at production facility interrupts hydrogen deliveries for 1 month. Expectation for normal service. |
NA |
Applicable |
Applicable |
Cyberattack and Charging Equipment Failure |
1 week charging equipment failure due to cyberattack, all charging equipment impacted; normal service provided. |
Applicable |
Applicable |
NA |
OEM maintenance delay |
ZEB maintenance delayed by 3 weeks due to OEM or supply chain problems. Expectation for normal service. |
Applicable |
Applicable |
Applicable |
the same impact and the same expected level of service (e.g., all natural disasters that would require evacuation support, or all threats that would prevent charging BEBs where normal service is expected). Some threats may have differing levels of severity depending on how long or where they occur; if that is the case, specify those key parameters in the threat list.
Questions to Consider:
- Can threats be grouped by impact on service?
- What is the expected level of service in each situation?
Step 3b: Re-evaluate Consequences
In order to prioritize the threats and define the severity of their consequences, the agency can follow this process:
- Recognize which dimensions of consequences are most important to them. This step is only necessary if an agency has not defined them previously. The six dimensions described in the Resilience Planning section are a good place to start.
- Name a metric, or definition, of that consequence to help categorize severity. For example, the impact to customers and service could be quantified by the number of days with reduced or modified service.
- Define levels from low to high impact. Following the customer impact example, less than one day of impacts could be defined as “low impact” and more than one week of reduced service as “very high impact.”
- The importance of each dimension can be weighted if desired to prioritize certain impacts, such as prioritizing public safety impacts over financial impacts.
An example is shown in Table 6 of each consequence dimension, its definition, its weight, and the levels of severity. This matrix is shown as an example only; agencies should customize the importance weightings and definitions based on their own priorities and operations.
Questions to Consider:
- Do the dimensions capture the consequences the agency would like to avoid?
Now the agency is ready to evaluate scenarios by assessing the impact of each threat on each consequence dimension in the present state with no additional adaptation measures. Using the threats table, determine what level of impact each threat would have on each dimension. Create a table similar to that shown in Table 7 for your initial transition plan phase. It will also be instructive to create additional tables for further phases of transition, as shown in Table 8. For example, one threat may be a power outage for 8 hours. Because this would likely cause only one day of modified service, the impact to customers is categorized as Low, but because 25–50% of buses would need extra charging logistics, the impact to staff is Medium.
Step 4: Assess Risks
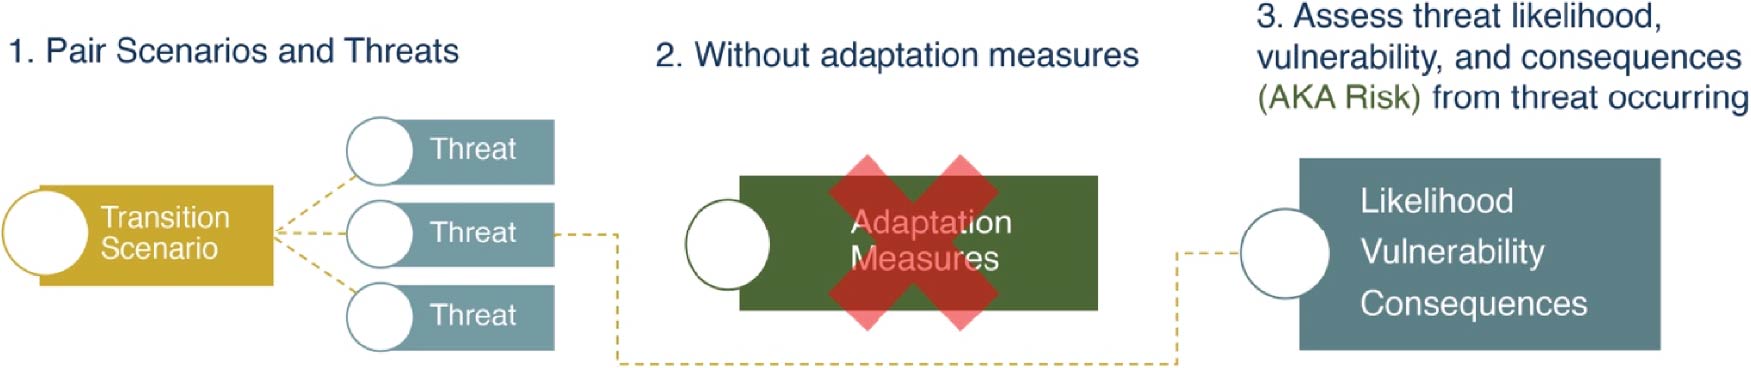
In order to quantify which threats are most important to address, the agency should calculate a risk score for each threat in the current state without any additional adaptations (Figure 11). Any adaptations that are already in place via the existing resilience plan should be included because it is important to identify where new adaptations are not needed for the ZE fleet. The standard risk score is calculated as Threat Likelihood · Consequences · Vulnerability as explained in the section Resilience Planning.
There are many sources of data an agency might use to quantitatively determine the likelihood, consequences, and vulnerability to any particular threat. The resources highlighted in Resilience Planning provide avenues to pursue these methods.
At a high level, to calculate a risk score, an agency can use numeric scores corresponding to the qualitative (low, medium, high, very high) categorizations for threat likelihood, consequence, and vulnerability magnitude as shown in Table 9. The following process can be used:
- Determine how likely it is that the threat would occur in any given year.
- To calculate an overall Consequence score, multiply the consequence weight of each dimension (converting the percentage to a decimal) by its numeric score and add them together.
- Determine the threat vulnerability, considering any existing adaptations that would help mitigate the damage from the threat.
- Multiply the threat Likelihood, Consequence, and Vulnerability scores together to generate an overall Risk score (see Table 10). A higher score indicates a higher overall risk.
Dimension |
Dimension |
Weight |
Low |
Medium |
High |
Very High |
|---|---|---|---|---|---|---|
Customer and Service Impacts |
Impacts to ridership and the regional economy from missed or modified service. |
20% |
< 1 day of impacts |
1 day of impacts |
1 day < duration of impacts < 1 week |
> 1 week of service impacts |
Staffing Impacts |
Impacts to agencyʼs staff due to stress put on workforce needs to support disaster response. |
20% |
< 5% of buses require special fueling logistics or 5% of operators required to alter schedules |
5% - 25% of buses require special fueling logistics or 5% - 25% of operators required to alter schedules |
25% - 50% of buses require special fueling logistics or 25% - 50% of operators required to alter schedules |
> 50% of buses require special fueling logistics or > 50% of operators required to alter schedules |
Public Safety Impacts |
Impacts to public safety if the ability to fulfill agencyʼs first responder responsibilities are impacted during an emergency response. |
30% |
Agency able to fulfill all requested emergency response support |
Agency able to fulfill 80% of requested emergency response support |
Agency able to fulfill 50% of the requested emergency response support |
Agency able to fulfill < 50% of requested emergency response support |
Financial Impacts |
The loss of revenue from missed service, as well any operational costs required to modify or adapt service based on Available resources and Response requirements. |
5% |
Cost Associated with no delays |
Cost associated with < 4-hour delay in service |
Cost associated with 4 - 24-hour delay in service |
Cost associated with > 24-hour delay in service |
Equipment Impacts |
Loss of or damage to transit agency equipment from a hazard. |
25% |
5% of chargers damaged |
10% of chargers damaged |
35% of chargers damaged |
Over 50% of chargers damaged |
Note: For the purposes of this exercise, reputational damage was not included as a consequence area, as the risk can be covered through a consideration of the other consequence areas. The set of consequences evaluated is specific to the transit agency and its approach
Threat |
Scenario |
Customer |
Equipment |
Staff |
Public |
Financial |
|---|---|---|---|---|---|---|
Tropical storm requiring moderate evacuation effort over 72 hours |
25% BEB |
Medium |
Low |
High |
Medium |
Medium |
Power outage due to grid overload or other event – 8 hours |
25% BEB |
Low |
Low |
Medium |
Low |
Low |
Cyber-attack or software change disable charger management software – 72 hours |
25% BEB |
Medium |
Medium |
High |
Low |
Medium |
Threat |
Scenario |
Customer |
Equipment |
Staff |
Public |
Financial |
|---|---|---|---|---|---|---|
Tropical storm requiring moderate evacuation effort over 72 hours |
100% BEB |
High |
Medium |
High |
High |
High |
Power outage due to grid overload or other event – 8 hours |
100% BEB |
High |
Low |
Very High |
Medium |
High |
Cyber-attack or software change disable charger management software – 72 hours |
100% BEB |
Very High |
High |
Very High |
High |
Very High |
Long Description.
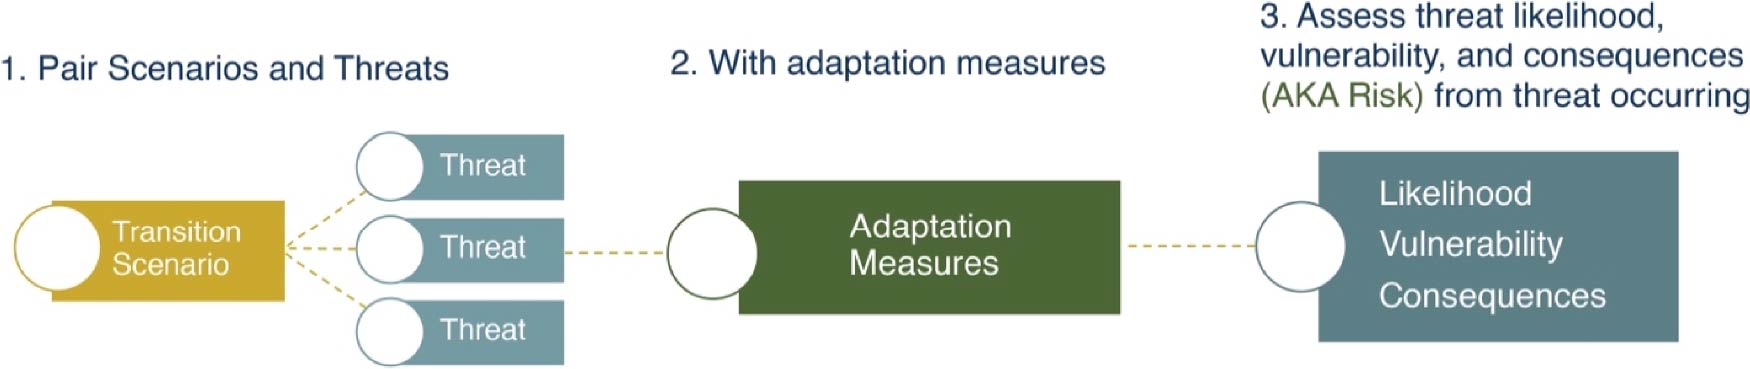
The data given in the flowchart are as follows: Step 1, Pair scenarios and threats: The transition scenario leads to three threats. Step 2, Without adaptation measures: The textbox reading Adaptation measures is crossed out with an X mark. Step 3, Assess threat likelihood, vulnerability, and consequences (AKA Risk) from threat occurring: Likelihood, Vulnerability, and Consequences. Steps 1 and 3 are connected.
Scale |
Threat |
Consequences |
Vulnerability |
|---|---|---|---|
Low |
0.05 |
1 |
0.05 |
Medium |
0.3 |
2 |
0.34 |
High |
0.75 |
3 |
0.75 |
Very High |
1 |
4 |
1 |
Consequences x Vulnerability |
|||||
|---|---|---|---|---|---|
Low |
Medium |
High |
Very High |
||
Likelihood of |
1 |
2 |
3 |
4 |
|
Low |
0.05 |
0.05 |
0.1 |
0.15 |
0.2 |
Medium |
0.3 |
0.3 |
0.6 |
0.9 |
1.2 |
High |
0.75 |
0.75 |
1.5 |
2.25 |
3 |
Very High |
1 |
1 |
2 |
3 |
4 |
Low: 0.05–0.19
Medium: 0.2–1.19
High: 1.2–2.9
Very High: 3–4
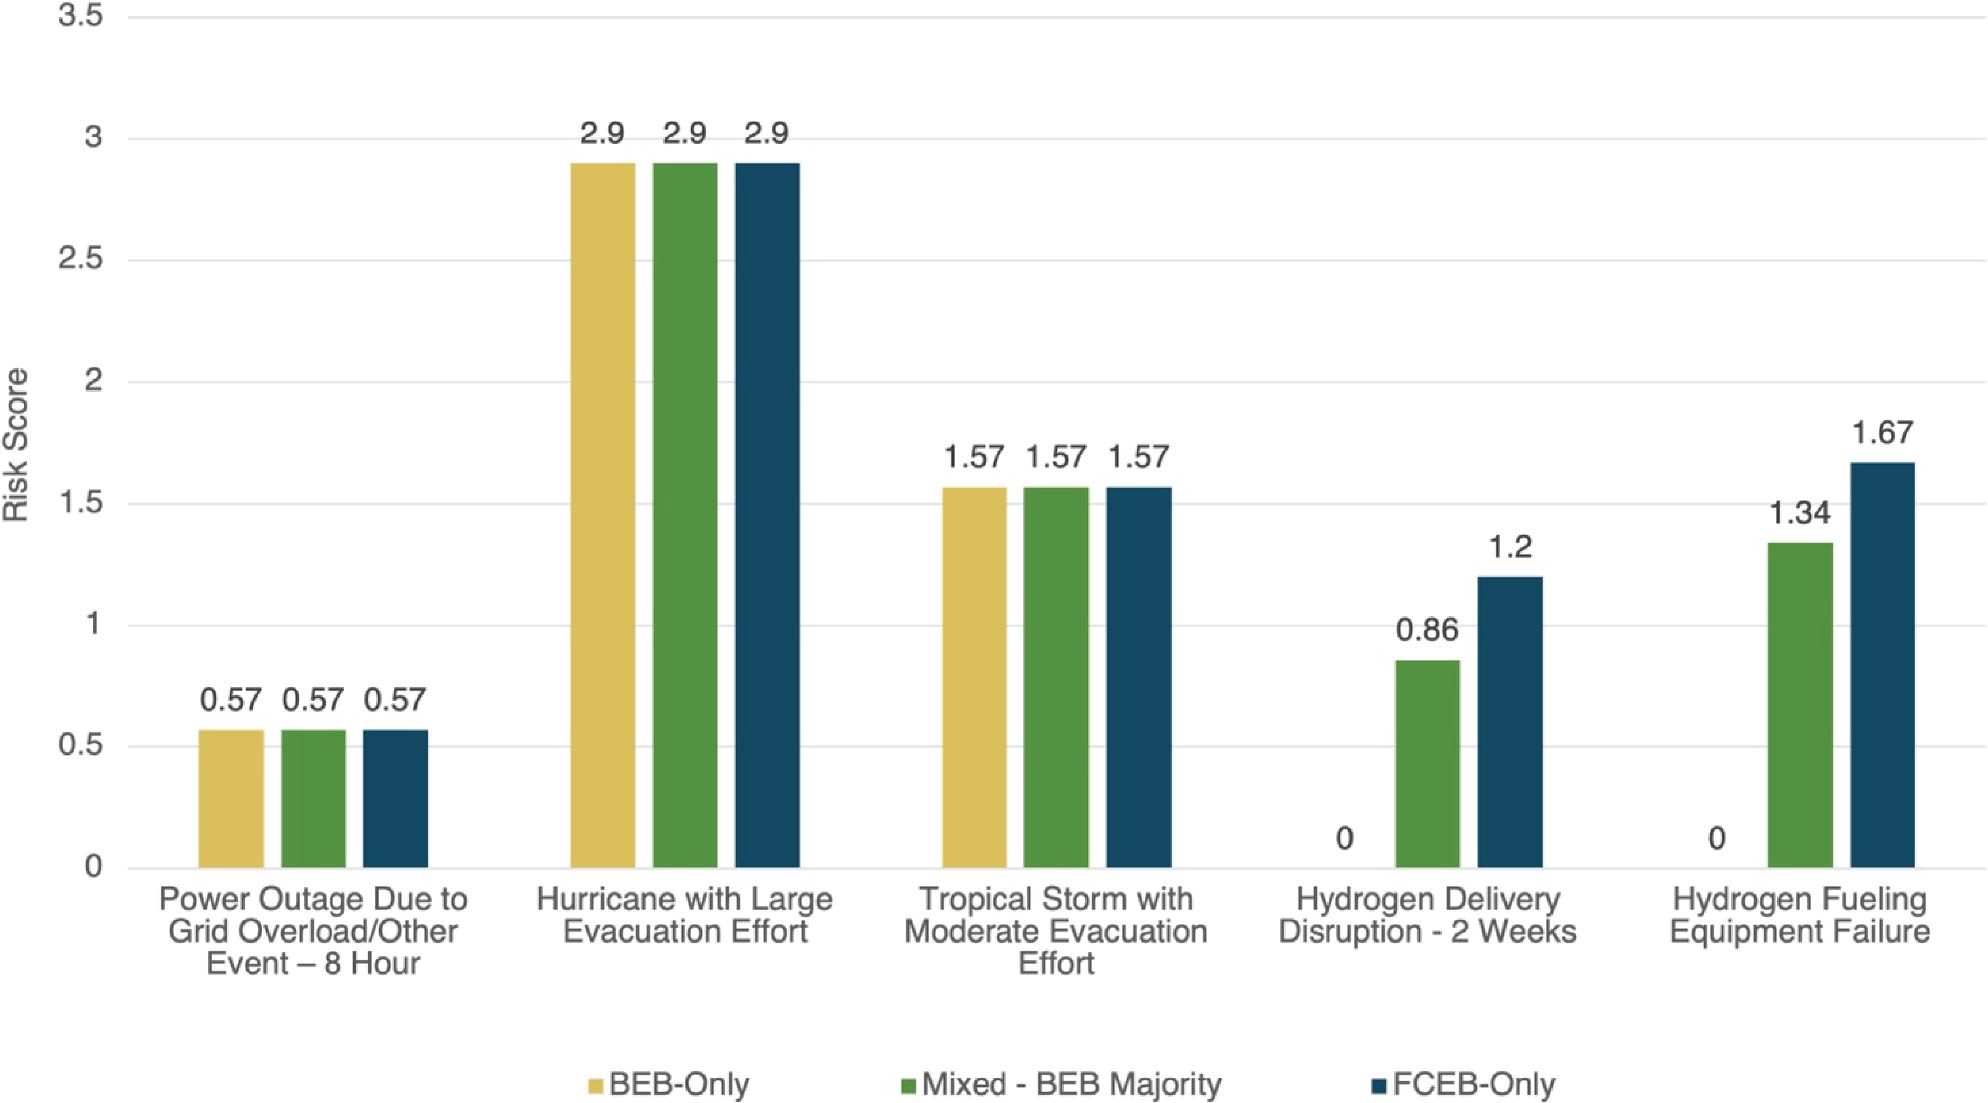
The agency can now prioritize which threats to address based on the risk scores ranked from highest to lowest. This will help the agency determine which adaptations are most important to pursue. A graph such as the one shown in Figure 12 may be helpful if multiple transition scenarios are being evaluated at the same time.
Questions to Consider:
- Which threat is the agency most vulnerable to?
- Which threats have the greatest consequences to the agency?
- Which threats are most likely?
Step 5: Consider Adaptations and Reassess Risks
Once the threats are prioritized with risk scores, the agency should consider potential new adaptations relevant to the ZE fleet.
Step 5a: Consider Adaptations
The agency should create a shortlist of measures under consideration to investigate further those that are relevant to the priority threats. Information from third parties such as OEMs, A&E firms, and utilities might be needed to fully understand the cost and capabilities of each adaptation. AC Transit is an example of a transit agency that has put into place a working group that is positioned to continually monitor adaptation measures and opportunities for implementation.
Long Description.
The horizontal axis shows five sets of three bars, where each set represents a scenario. Each bar represents a type of fuel: BEB-only, Mixed-BEB majority, and FCEB-only. The vertical axis shows risk score from 0 to 3.5 in increments of 0.5. The data given in the graph are as follows: Power Outage Due to Grid Overload or Other Event – 8 Hour: 0.57, 0.57, and 0.57. Hurricane with Large Evacuation Effort: 2.9, 2.9, and 2.9. Tropical Storm with Moderate Evacuation Effort: 1.57, 1.57, and 1.57. Hydrogen Delivery Disruption – 2 Weeks: 0, 0.86, and 1.2. Hydrogen Fueling Equipment Failure: 0, 1.34, and 1.67.
Questions to Consider:
- Are there certain measures that work well together or mitigate multiple threats?
- Are there any measures that would only be used for some transition scenarios?
Reference Appendix D for details of adaptation measures that may be helpful specifically for ZE fleets.
Step 5b: Reassess Risk
Next, the agency should reassess the risk of each threat with each potential adaptation measure in place (Figure 13). Follow Step 4 (Assess Risks) again, considering the severity of consequences
Long Description.
The data given in the flowchart are as follows: Step 1, Pair scenarios and threats: The transition scenario leads to three threats. Step 1 leads to Step 2. Step 2, With adaptation measures: The textbox reads, Adaptation measures. Step 2 leads to Step 3. Step 3, Assess threat likelihood, vulnerability, and consequences (AKA Risk) from threat occurring: Likelihood, Vulnerability, and Consequences.
if the adaptation measure was implemented. Narrow the scenarios to address by only assessing adaptations that are relevant to each threat.
Questions to Consider:
- Does the adaptation reduce the likelihood of the threat occurring?
- What is the likelihood that the agency would experience damage from the threat occurring with the adaptation in place?
- What is the level of consequences the agency would experience if the threat occurred with the adaptation in place?
Finally, the agency can compare the original risk scores (without adaptation measures) against the new risk score (with adaptation measures) as shown in Table 11 and Table 12. By subtracting the new score from the old score, each adaptation now has a Risk Reduction Score. This measure shows which adaptations are most effective at reducing the risk from each threat. Different adaptations might be suited to different threats.
Step 6: Evaluate Cost-Benefits and Select Adaptations
The final step in the process is to select adaptation measures to pursue and update the resilience plan. To select measures, agencies can evaluate the various costs and benefits of the potential measures. This process will be very specific to each agency as each will have its own priorities and constraints, and there are many factors to consider beyond the most obvious costs and benefits of the resilience plan. Table 13 provides some examples of costs and benefits to consider.
|
Threat: Power outage in service area lasting 8 hours; no compounding natural disaster impacts to the community. Expectation for normal service. 100% FCEB fleet. Adaptation: None. |
Score |
||||
|---|---|---|---|---|---|
Likelihood: |
Medium |
0.3 |
|||
Vulnerability: |
Very High |
1 |
|||
Consequences: Power outage for 8 hours would prevent agency from operating the hydrogen fueling station during the normal fueling window. Most FCEBs would not be able to be fueled for that day; assume some buses would be able to be fueled and ready for morning service. Due to limited availability of fully fueled buses, reduced service would be required for one extra day after the power outage is resolved which may create stress on the community. Additional stress on staff required to oversee fueling logistics in a compressed time window, as all vehicles will be impacted. |
|||||
Regional |
Staffing |
Public Safety |
Financial and |
Equipment |
Total |
20% |
20% |
30% |
5% |
25% |
|
Medium |
Very High |
Low |
High |
Low |
|
2 |
4 |
1 |
3 |
1 |
1.9 |
Overall Risk Score |
0.57 |
||||
|
Threat: Power outage in service area lasting 8 hours; no compounding natural disaster impacts to the community. Expectation for normal service. 100% FCEB fleet. Adaptation: Install a diesel backup generator sized to maintain station functionality during the power outage. |
Score |
||||
|---|---|---|---|---|---|
Likelihood: |
Medium |
0.3 |
|||
Vulnerability: |
Very High |
1 |
|||
Consequences: The backup generator would support the hydrogen fueling station, so a power outage for 8 hours would not prevent agency from operating the hydrogen fueling station during the normal fueling window. FCEBs would be fueled for that day. |
|||||
Regional |
Staffing |
Public Safety |
Financial and |
Equipment |
Total |
20% |
20% |
30% |
5% |
25% |
|
Low |
Medium |
Low |
Low |
Low |
|
1 |
2 |
1 |
1 |
1 |
1.2 |
Overall Risk Score |
0.57 |
||||
Risk Reduction |
0.21 |
||||
Potential Benefits |
Potential Costs |
|---|---|
1. Risk Reduction and Effectiveness: How effective is the adaptation at decreasing risk? Does it apply to multiple scenarios, or synergize with other adaptation measures? |
1. Total Cost of Ownership: How much does the adaptation cost (both capital and operating costs)? How does this compare with available resources? |
2. Environmental Benefits: Does the measure help the agency further meet its emissions or environmental impact goals? |
2. Environmental Costs: Does the measure produce harmful pollutants or otherwise affect the agencyʼs environmental goals? Are there regulatory considerations? |
3. Daily Operational Benefits: Does the measure provide an operational benefit outside of a resilience scenario, such as reducing costs, increasing efficiency, reducing staff workload, or improving quality of service? |
3. Physical Resources: How much physical space will the adaptation require? |
4. Community Preference: Will any adaptation measures improve the communityʼs experience with the agency? |
4. Staffing Resources and Effort: Will the adaptation increase or decrease workload for staff on a daily basis? What about in resilience situations? |
5. Other Stakeholders: Will the adaptation benefit other stakeholders? |
5. Other Stakeholders: Are there other stakeholders that might be impacted negatively by the adaptation (or lack of it)? |
The most important costs and benefits to the agency can be prioritized to decide between adaptation measures. For example, an agency may choose to focus on measures that provide the highest risk reduction for the least total cost. Alternatively, an agency may prioritize the measures that provide the most benefit outside of a resilience situation, or those with the best environmental benefits. The many stakeholders in the resilience planning process, including the community, should be considered.
Because of the unique situation of each agency as a result of geographic region, size, specific threats, community priorities, and environmental goals, not all adaptation measures may be suitable for all agencies.
Step 7: Update Resilience Plan
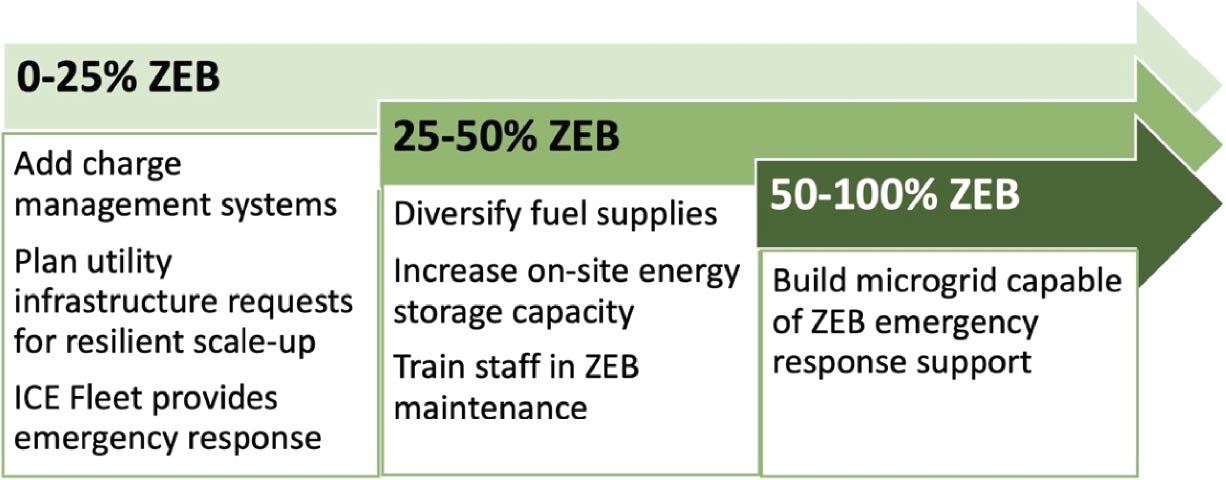
Once the agency has chosen adaptation measures to pursue, it should update its resilience plan and define a timeline or trigger points for more closely evaluating or implementing adaptations that may become more necessary later in the ZEB transition. Though resilience plans should be monitored and updated periodically, some of the energy-related adaptations have long lead times due to utility infrastructure buildout or procurement of parts, and it is important to make decisions on these types of adaptation measures when committing to adding more ZEBs to a fleet. Therefore, the agency should identify key points in the transition where existing adaptation measures, such as an ICE fleet, will no longer meet the resilience needs of the agency and be prepared to revisit the resilience plan in detail at that time (Figure 14).
For example, once an agency reaches 20% ZEBs, it may not be able to cover all normal services with only ICEBs in the event of a charging failure. Thus, it needs to have adaptations in place before reaching 20% ZEB that would allow it to continue normal service. Further along in the transition, there may come a point where the ICE fleet cannot support all emergency services, potentially at 50% ZEBs. Thus, the agency needs to have adaptations in place before reaching 50% ZEBs that would support using ZEBs in emergency service. These timelines for ZEB fleet composition should be estimated within the transition plan, allowing the agency to put target dates on adding adaptation measures.
In addition to the ZEB fleet composition, the age of existing assets can factor into this analysis. Santa Maria Regional Transit (SMRT) is a transit agency that is taking the useful life of its diesel buses into account as part of its ZEB resilience planning process.
Resilience planning is always evolving as technology, conditions, and community needs change. Using these steps to update the resilience plan should occur every few years, especially as the agency hits its pre-determined trigger points for implementing additional adaptations.
Long Description.
The data given in the illustration are as follows: 1, 0 to 25 percent ZEB: Add charge management systems; Plan utility infrastructure requests for resilient scale-up; ICE Fleet provides emergency response. 2, 25 to 50 percent ZEB: Diversify fuel supplies; Increase on-site energy storage capacity; Train staff in ZEB maintenance. 3, 50 to 100 percent ZEB: Build a microgrid capable of ZEB emergency response support.


