Planning and Operations Initiatives to Support Nighttime Transit Ridership (2025)
Chapter: 2 Literature Review

CHAPTER 2
Literature Review
Introduction
This chapter provides an overview of nighttime transit and the nighttime economy in the United States and Canada. Informed by a review of relevant literature, the chapter starts with an overview of post-COVID ridership trends, how transit serves the nighttime economy, the characteristics of nighttime transit with a focus on the United States, nighttime transit and economy in the context of this review, the challenges and success of nighttime transit operations, and how partnerships play a crucial role in providing nighttime transit services.
A few terms are used throughout the synthesis that need to be defined. Due to the variety in service spans and different understandings of what is considered “nighttime,” there is no consensus on a single definition for nighttime service in the transit industry. For the purposes of this synthesis, nighttime service is a transit service that operates between 9:00 p.m. and 6:00 a.m.
Next, the report refers to the “nighttime economy.” Broadly, the nighttime economy refers to economic activity that occurs outside of the traditional working hours of 9:00 a.m. to 5:00 p.m. Literature about the nighttime economy in the context of city and municipal planning largely focuses on cultural, entertainment, and dining venues in downtown and commercial districts. As cities across the country experience growth and development, many see vibrant and welcoming nightlife as an integral part of this development (International Downtown Association, 2018). While the nighttime economy refers to the work directly associated with supporting nightlife for patrons, it also refers to the labor that occurs overnight that is needed to either support a 24-hour industry (e.g., healthcare services) or support daytime operations (e.g., custodial and maintenance services).
Finally, the report discusses those who work non-traditional work hours. The Bureau of Labor Statistics defines evening shift work as work that primarily occurs between 2:00 p.m. and 12:00 a.m., while defining night shift work as work that primarily occurs between 9:00 p.m. and 8:00 a.m. (Bureau of Labor Statistics, 2019). For this report, “late-shift” workers refer to those who primarily work during the evening and night shifts.
Though most workers still primarily work in traditional daytime hours of 9:00 a.m. to 5:00 p.m., the nighttime economy is growing. Between 2016 and 2026, projected employment growth in major nighttime industries is expected to be between 0.5 and 1 percent, outpacing the national average growth rate (Zalewski, et al., 2019). While economic activity continues to grow outside traditional working hours, it can still be difficult for transit riders to access service. While daytime and nighttime public transit usage are influenced by similar factors, transit mode share drops from 6.5 percent to 3.8 percent between daytime and late-shift workers due to longer commutes and a reduced or complete lack of service (Zalewski, et al., 2019).
Nighttime industries with a large share of evening, night, and rotating shift workers (at least 20 percent of workers) include:
- Leisure and hospitality
- Wholesale and retail trade
Occupations with a large share of evening, night, and rotating shift workers (at least 20 percent of workers) include:
- Services
- Production
Overview of Post-COVID Ridership Trends
The onset of the COVID-19 pandemic in March 2020 in the United States led to health advisories to remain at home and shut down businesses deemed as serving “nonessential” services. In subsequent months, regulations on activity in state and local municipalities had varying degrees of “openness” until the end of the national emergency on May 12, 2023 (most states had dropped most COVID-19 business restrictions by the end of 2021). Since the beginning of the pandemic, there have been impacts on transit. This section discusses the overall loss in ridership, ridership loss by mode, and ridership changes based on time of day. It then discusses trends that have emerged in ridership recovery by examining ridership recovery by agency size, mode, and time of day.
The reduction in the number of commuting and leisure trips led to a severe drop in ridership across transit modes and agencies (Figure 2). The use of all modes of public transportation fell drastically in March and April 2020; bus ridership fell 70 percent, and rail ridership fell between 80 and 90 percent compared to 2018 levels (Freemark, et al., 2021) (Figure 3).

Source: National Transit Database, March 2024 Complete Monthly Ridership
Long Description.
The horizontal axis shows years from 2019 to 2023 in increments of 1. Each year consists of segments of months. The vertical axis shows unlinked passenger trips in millions from 0 to 1,000 in increments of 200. The line in the graph begins in October 2019 with 899,648,820 passengers. It reaches 159,156,318 passengers in April 2020. The line then increases with a few highs and lows and ends in October 2023 with 645,385,913 passengers.

Source: National Transit Database, March 2024 Complete Monthly Ridership
Long Description.
The horizontal axis shows years from 2020 to 2023 in increments of 1. Each year consists of segments of months from 1 to 11. The vertical axis shows unlinked passenger trips as a percentage of 2019 trips in percent from 0 to 120 in increments of 20. The graph consists of two lines representing Bus (motor bus and trolleybus) (black) and Rail (heavy, hybrid, and light) (gray). The line representing ‘Bus’ begins in January 2020 with 100 percent, decreases to reach 28 percent in April 2020, and ends at 77 percent in October 2023. The line representing ‘Rail’ begins in January 2020 with 110 percent, decreases to reach 11 percent in April 2020, and ends at 67 percent in October 2023. Note that the percentage values and months are approximate.
Though overall ridership levels have declined, the decline and subsequent recovery have not been even across time of day, modes, and agency size. In major cities, ridership levels in 2022 have remained a fraction of 2019 ridership during peak periods, while ridership during non-peak periods has nearly recovered to 2019 levels (Rowlands and Hadden Loh, 2023). Due to the prevalence of remote and hybrid work, the ridership recovery rate during peak periods—the time of day with the highest ridership for most large systems—has failed to reach pre-pandemic levels. Further, average ridership rates on commuter buses and commuter rail during September–November 2023 were 63 percent of their fall 2019 levels. It is uncertain if peak period ridership will recover to pre-pandemic levels at any point. Local bus ridership recovered the most compared to other modes, with 38 percent ridership growth from May through July 2020 (National Transit Database, 2023). By the end of the first quarter of 2023, the bus recovery rate far outpaced the rail recovery rate nationally and in every major public transportation system, excluding New York Cityʼs Metropolitan Transportation Authority (MTA) (Rowlands and Hadden Loh, 2023). Smaller agencies with service area populations under 500,000 also have had the highest recovery rate, outpacing the national average since early 2023 (American Public Transportation Association and Transit App, n.d.).
Local bus ridership resilience and recovery, as well as a diminished peak period ridership, highlights the travel patterns of riders who continued to use transit through pandemic restrictions. Many continued to rely on local bus systems through pandemic restrictions due to a lack of car ownership or in-person work requirements. For those lacking car ownership, transit was necessary for accessing essential resources. These riders were disproportionately lower-income, women, and Black or Hispanic populations. (Freemark, et al., 2021). For those working in-person jobs that could not be done remotely, they were disproportionately working in low-wage part-time jobs. Many industries that require in-person work include those with high levels of nighttime shift work (Dingel and Neiman, 2020). Ridership recovery during the peak period will largely depend on in-person office requirements. For those working outside of these daytime hours, low work-from-home plausibility and low wages result in a need for access to affordable transportation options and a less flexible propensity for transit.
There is justification for providing nighttime service considering the ridership recovery rate at different times of the day. In Bostonʼs Massachusetts Bay Transportation Authority (MBTA) and Washington D.C.ʼs Washington Metropolitan Area Transportation Authority (WMATA), ridership at 10:00 p.m. had the highest recovery rate among all weekday time periods in 2022 (Figure 4) (Rowlands and Hadden Loh, 2023). Further, an American Public Transportation Association (APTA) report found agencies that prioritized those needing to work in person and those vulnerable to a lack of service were the most successful in retaining ridership with the onset of the COVID-19 pandemic. APTA recommended focusing transit efforts on marginalized communities to increase access to transit and strengthen a systemʼs ridership base, including expanding nighttime service to support late-shift workers (Freemark, et al., 2021). Finally, agencies that allocated additional operator and vehicle resources to meet peak transit demand during pre-pandemic operations have the opportunity to reallocate resources and services for other times outside of peak hours.
Nighttime Economies
This section focuses on the nighttime economy, specifically examining the economic impact, the dynamics of cities with nighttime transit, trip generators and service markets, and the origins and destinations of those who engage in the nighttime economy. Although recent literature focused on the impact of the nighttime economy in cities is limited, the existing

Long Description.
Line graph A: The graph is titled Off-peak and weekend transit ridership in Boston has recovered better than peak ridership. The horizontal axis shows time from 4:00 AM to 12:00 AM in increments of 5 hours. The vertical axis shows numbers from 0 to 70,000 in increments of 10,000. The graph consists of four lines representing the 2019 weekday, 2019 weekend, 2022 weekday, and 2022 weekend. The line for 2019 weekday begins with 0 at 4:00 AM, reaches 54,000 at 7:00 AM, reaches its highest peak of 60,000 at 4:30 PM, and ends at 0 at 2:00 AM. The line for the 2019 weekend begins at 0 at 4:00 AM, reaches its peak of 19,000 at 3:00 PM, and ends at 0 at 2:00 AM. The line for 2022 weekday begins at 0 at 4:00 AM, reaches 20,000 at 8:00 AM, reaches its highest peak of 25,000 at 5:30 PM, and ends at 0 at 2:00 AM. The line for the 2022 weekend begins at 0 at 4:00 AM, reaches its peak of 11,000 at 3:00 PM, and ends at 0 at 2:00 AM.
Line graph B: The graph is titled Off-peak and weekend transit ridership in DC has recovered better than peak ridership. The horizontal axis shows time from 4:00 AM to 1:00 AM in increments of 3 hours. The vertical axis shows numbers from 0 to 90,000 in increments of 10,000. The graph consists of four lines representing the 2019 weekday, 2019 weekend, 2022 weekday, and 2022 weekend. The line for the 2019 weekday begins with 0 at 4:00 AM, reaches 80,500 at 7:30 AM, reaches its highest peak of 82,000 at 4:30 PM, and ends at 0 at 1:00 AM. The line for the 2019 weekend begins at 0 at 4:00 AM, reaches its peak of 20,000 at 5:00 PM, and ends at 0 at 1:00 AM. The line for 2022 weekday begins with 0 at 4:00 AM, reaches 21,000 at 8:00 AM, reaches its highest peak of 25,000 at 4:30 PM, and ends at 0 at 1:00 AM. The line for the 2022 weekend begins at 0 at 4:00 AM, reaches its peak of 11,000 at 4:00 PM, and ends at 0 at 1:00 AM. Note that the coordinate values of time and ridership values are approximate.
research shows that the economic and cultural impact of the nighttime economy is significant. The nighttime economy is driven by three main groups: those participating in nightlife, those who work to support nightlife, and those who work occupations that support a 24/7 industry or can only be done at night. As vibrant nightlife is considered to be a vital component of a modern city, cities are identifying ways to support the nightlife industry—both for nightlife consumers and workers (International Downtown Association, 2018). There is less literature specifically focused on methods for cities to support 24-hour industries and other nighttime workers.
Economic Impact
The direct economic impact of nightlife can be significant, and the existence of nightlife can contribute to the nighttime economy indirectly. In New York City, a report found that the nightlife industry accounted for $19.1 billion in direct economic impacts, while indirect impacts (e.g., a nightlife patron using a taxi, late-shift workers getting food from a food truck) accounted for an additional $16 billion in 2016 (The North Highland Company, Econsult Solutions, Inc., and Urbane Development, 2019). For those working in nightlife, there is a significant impact on a region. In Dallas, TX, the nightlife economy directly and indirectly sustained 256,300 jobs and $8.3 billion in labor income (Visit Dallas, 2023). The nightlife economy also generated $864 million in state and local tax revenue in 2023. Beyond nightlife, late-shift workers directly and indirectly impact a municipalityʼs local economy. Late-shift workers generated $812.6 billion in annual wages and helped sell $84 billion worth of services and goods in 2019 (Zalewski, et al., 2019).
The industries with the highest rate of late-shift workers—leisure and hospitality and wholesale and retail trade—are expected to grow between 2021 and 2031 (U.S. Bureau of Labor Statistics, 2022). Like transit ridership trends, the COVID-19 pandemic impacted employment trends in major late-shift industries and the geographic distribution of jobs in these industries. The leisure and hospitality industry are expected to grow by 1.3 percent during the same period, surpassing the national average of 0.5 percent.
Economies of Cities with Nighttime Transit Service
Generally, cities with historically high transit mode share tend to have nighttime service as a natural extension of the many trip purposes of its riders. However, smaller systems and cities may still have robust unserved demand for nighttime networks. For instance, despite Ithaca, NY, having 7 percent of the population of Oklahoma City, OK, Ithaca has six times the number of nighttime commuters than Oklahoma City (Zalewski, et al., 2019). The same report does, however, find a statistically significant positive relationship between population size and late-shift transit usage, albeit a weak one.
In municipalities where the leisure and hospitality and wholesale and retail industries dominate, there is a higher rate of late-shift jobs and people working non-traditional work schedules compared to municipalities with a variety of industries. Due to a high rate of residents working outside traditional hours, these areas likely experience limited transit demand at peak periods and instead experience transit demand more evenly throughout the day. Cities with large hospitality and tourism sectors have high rates of late-shift public transit usage. These areas tend to have major tourist destinations that are centrally located and easily served by public transit (Zalewski, et al., 2019).
Areas with concentrations of nighttime workers also are likely to have nighttime transit services. This includes larger cities with high transit mode share but also includes systems that contain a large share of manufacturing and warehousing job sites. While cities certainly have a sizeable share of employment in late-shift industries (in fact, at least 10 percent of all workers in major metropolitan areas are late-shift employees), the geographic distribution of major late-shift industries is not reserved for dense urban areas (Zalewski, et al., 2019). Elkhart, IN, has the largest share of late-shift workers, with 40 percent of total workers working during the late shift; other cities across the country, including Clarksville, TN, and Ogden, UT, have a high share of late-shift workers (Zalewski, et al., 2019). Further, the employment rate of late-shift workers in rural counties, or areas outside of a combined statistical area (CSA), has been experiencing a stronger recovery and greater growth compared to dense urban cores (the top 40 most populous CSAs) (Chapuis, Murray, and Price, 2023). This has implications for the location of nighttime
services; whereas dense urban areas had a higher propensity for nighttime service, agencies may increasingly find demand for nighttime service in rural counties.
Nighttime Service Markets
Nighttime transit often serves two primary markets—late-shift work (commuting trips) and nightlife (non-commuting trips). Introducing nighttime service or extending the existing span of service supports both markets. One reason is to accommodate late-shift workers and enable them to get to workplaces and home by using transit. Transit systems without nighttime service tend to prevent workers from being able to take transit at either or both “ends” of a shift (Zalewski, et al., 2019), reducing the number of workers who can rely on public transit for their commutes. Oklahoma Cityʼs Central Oklahoma Transportation and Parking Authority (EMBARK) and the Detroit Department of Transportation are two agencies that explicitly cite this as a reason for extending bus service spans (City of Oklahoma City, 2015; Zalewski, et al., 2019). Another reason is to transport people engaging in nightlife and entertainment, such as tourists, residents, and students. In two surveys conducted after the MBTA implemented nighttime service in 2015, “entertainment” ranked highest as a reason for passengersʼ use of nighttime rail service (MBTA, 2015). Agencies employ nighttime service to discourage people from driving under the influence, discourage driving and parking private vehicles in dense downtown cores, and provide a cost-effective alternative to ride-hailing services.
Larger cities are likely to have more markets to serve at night, creating a more multipurpose service with the goal of ensuring general mobility across the city. As density decreases, nighttime service becomes more fine-tuned toward certain trip types or to serve a single market. Southeastern Pennsylvania Transportation Authority (SEPTA) states that their 24-hour service within the City of Philadelphia is designed to assure mobility across the city, while service in their suburban jurisdictions is intended to connect areas with high transit propensity to commercial activity centers and preserve service on high ridership routes (SEPTA, 2019). In New York City, around-the-clock access to the MTA subway system moves beyond its utility in moving people around at nighttime, interconnecting the service with the cityʼs identity as a sleepless, 24-hour city (Surico, 2021).
Origins and Destinations
Due to changes in the geographic distribution of jobs, workplaces have moved from existing within city downtowns to a mosaic of activity centers (Hadden Loh, Rowlands, Tomer, Kane, and Vey, 2022). For late-shift workers in larger cities, origins are likely to be in downtown districts or commercial activity centers, and destinations are likely to be homes further in the outer city and in the suburbs. In cities with housing costs and the cost of living rising in the core city, low- to moderate-income workers are likely to live further away from their workplaces. A survey of San Francisco travel patterns found that from 9:00 p.m. to 12:00 a.m., more trips occurred locally, but from 12:00 a.m. to 5:00 a.m., almost 70 percent of trips were between San Francisco and another county (San Francisco Entertainment Commission, San Francisco County Transportation Authority, and San Francisco Office of Economic and Workforce Development, 2015). For late-shift workers in smaller, less dense cities, work can be distributed more randomly across a metro area. Industrial, retail, and hospitality sectors have less than two-thirds of sector jobs in concentrated activity centers compared to business service jobs, which have 54 percent in activity centers (Hadden Loh, Rowlands, Tomer, Kane, and Vey, 2022). Further, low-income populations have the lowest share of jobs in activity centers at 33 percent, compared to other income levels (Hadden Loh, Rowlands, Tomer, Kane, and Vey, 2022).
For patrons of nightlife activities, activities are often clustered around downtown areas and areas surrounding main street corridors. However, because nightlife often grows organically and can exist informally, it can grow in residential neighborhoods and outside activity centers (Spivak, 2020), which is less conducive to serving with fixed-route transit. The origins and destinations for these riders tend to be from an activity to their residence. While central locations provide suitable origins and destinations for nighttime service, riders further away from the downtown core face longer travel times at nighttime. This issue is magnified in cities where low-income residents are becoming increasingly priced out of the city center. A paper regarding Seattleʼs Night Owl service found that riders further away from central locations faced longer wait times, with little to no transit access compared to midday service (Margetic, 2022).
Planning Nighttime Service
Planning Approach
While there is research on the focus areas of general transit service provision and how it is affected by internal and external agency factors, there is a lack of literature that defines how focus areas change based on the specific type of service, especially nighttime service. Focus areas that most agencies typically consider include service availability, safety, service quality, ridership/productivity, and financial performance (Boyle, 2019). The emphasis and priority placed on these focus areas vary based on agency objectives; however, service availability and safety are often top priorities in nighttime service operations. Focus areas that may be much more crucial during peak or daytime service, such as productivity measures like increasing travel speeds, may be considered negligible in the nighttime due to the overall lack of traffic.
A review of the literature does not reveal much information about the internal structure of nighttime service planning and does not attribute specific factors that would affect staffing levels. However, the type of night service (dedicated night routes versus subsidized TNC partnership), the amount of service (a single nighttime bus route versus a nighttime bus network), and agency involvement (agency-run service versus contracted service) all influence how much staff time is dedicated to nighttime service planning.
Focus Area: Service Availability
Nighttime transit systems are planned to ensure riders are not stranded, providing transit connections between known nighttime origins and destinations. While nighttime routes can be long with infrequent headways, agencies often seek some level of service available. Agencies may interpret service availability to mean providing service that closely aligns with nighttime trip patterns. This may mean creating new routes or combining multiple daytime routes into a single night route (Factor and Miller, 2006), elongating the route but creating a one-seat ride for riders. Agencies may interpret service availability through the lens of geography, ensuring they align routes to serve many destinations. VIA Metropolitan Transit in San Antonio, TX, arranges nighttime service to cover the most geography possible with the resources available (Wang and Ball, 2020). Agencies incorporate transfers into nighttime networks to increase service availability and coverage across a larger region. To facilitate safer transfers at night, agencies commonly situate transfers at transit hubs or locations served by multiple routes (Factor and Miller, 2006).
Focus Area: Safety
Due to reduced visibility and activity during the night, agencies and passengers are especially concerned with safety. Consolidating nighttime transfers to transit hubs and elongating daytime routes reduces the number of passengers transferring in areas that are isolated or lacking safety
infrastructure. Safety also becomes interlinked with focus areas typically considered and prioritized in daytime operations. Focus areas such as bus stop amenities, service frequency, and span of service have a direct impact on passengerʼs perception of safety. In comments for an Arlington County Transit public engagement report, long wait times and poorly lit bus stops were cited as safety concerns in nighttime travel.
Service Awareness
To increase awareness on the availability of nighttime service, some agencies utilize branding and marketing tools to better advertise the service and foster rider understanding of potential differences from daytime service. When introducing a new nighttime service, agencies will advertise the service, likely on existing transit infrastructure. When informing riders of a new set of 24-hour routes, WMATA placed ads at bus stops, while the City of Dekalb placed ads on bus vehicles to inform riders of a new 24-hour route. After the initial implementation phase of nighttime service on existing routes, agencies integrate awareness of nighttime service offerings into information dissemination methods for typical daytime services. In Cincinnati, Go Metro created a marketing campaign to inform riders of new 24-hour service on select bus routes as a part of a bus improvement plan (Figure 5), but have since integrated information about nighttime service into bus scheduling (Figure 6).
Agencies with nighttime service that differs from daytime routes will commonly brand the nighttime service as an “owl” or “night” service to signal different operational characteristics compared to daytime service, such as different origins and destinations, stop sequences, headways, or even entirely different routes. The San Francisco Municipal Transportation Agency (SFMTA) brands its nighttime service as “Muni Owl” and posts the nighttime network map at bus shelters throughout the city. However, agencies may create multiple, distinct nighttime branded services if they operate differently from each other or serve different purposes. SEPTAʼs Owl Link, a service that existed from 2021 to 2022, was a branded service, separate from its overall Owl Network, that operated to provide last-mile service to job sites in suburban Bucks County (SEPTA, 2021). Saginaw Transit Authority Regional Services (STARS) in Michigan runs multiple services at night with different branding to attract different types of riders. For instance, “Delta Direct” shuttles Delta College students between downtown and the main campus, and two “Jobs Route” services run express bus services to job sites (Figure 7) (STARS, n.d.). While marketing campaigns for branded services may cease after the implementation phase, information is typically found on a separate website page and separate information materials are created (e.g., maps, schedules, rider guides).
Marketing for nighttime service seems to target existing daytime users. However, agencies may advertise nighttime service for special events with a late end time, to provide transportation options to attendees.
Route Alignment
Agencies typically use a combination of factors, including existing route ridership, age and income demographics, employment, and travel demand, when determining route alignment for nighttime routes. Agencies may use a market or transit propensity analysis to determine origins and destinations and the market demand for nighttime transit. This is a popular way for researchers to determine if existing nighttime service is appropriately serving nighttime travel demand or if adjustments are needed to capture demand for transit trips. When WMATA announced an extended service span of 14 routes to a 24-hour network, it also included the end-of-line extension of two routes to serve stops normally served by Metrorail, which suspends at night (WMATA, 2023).

Source: Southwest Ohio Regional Transit Authority (Go Metro)
Long Description.
The table shows three columns with headers: Metro routes changing effective May 30, 2021; Increased frequency; and Expanded span. The second and third columns have four and two sub-columns, respectively. The sub-columns in column 2 are More frequent weekday, more frequent Saturday, more frequent Sunday, and new Sunday. The sub-columns in column 3 are 24-hour service and earlier and later daily. The data given in the table row-wise are as follows: Row 1, 4 Kenwood or Blue Ash Branch: Blank, Blank, Yes, Blank, Yes, Blank. Row 2, 11 Madison Rd. Branch: Blank, Blank, Yes, Blank, Yes, Blank. Row 3, 16 Mt. Healthy: Yes, Yes, Blank, Yes, Blank, Yes. Row 4, 17 Mt. Healthy Branch: Blank, Blank, Yes, Blank, Yes, Blank. Row 5, 20 Winton-Tri-County: Yes, Yes, Blank, Yes, Blank, Yes. Row 6, 33 Glenway Ave.: Blank, Yes, Yes, Blank, Yes, Blank. Row 7, 43 Bond Hill Branch: Blank, Blank, Yes, Blank, Yes, Blank. Row 8, 46 Avondale: Yes, Yes, Yes, Blank, Blank, Yes. Row 9, 51 Glenway Crossing-Hyde Park-Crosstown: Blank, Blank, Yes, Blank, Yes, Blank. Row 10, 78 Lincoln Heights Branch: Blank, Blank, Yes, Blank, Yes, Blank. The poster shows a Metro user holding his helmet on his head and smiling. The text reads, '24-hour service means MORE job options. Riding is believing.

Source: Southwest Ohio Regional Transit Authority (Go Metro)
Long Description.
The main header of the table reads, 4 Monday through Friday. The sub-header reads, To Downtown. The column headers of the table are UC-Blue Ash Campus (11), Galbraith Rd. and Plainfield Rd. (10), Montgomery Rd. and Kenwood Rd. (9), Montgomery Rd. and Kennedy Ave. (8), Montgomery Rd. and Losantiville Ave. (7), Surrey Square (6), Montgomery Rd. and Dana Ave. (5), Walnut Hills H.S. (4), Taft Ave. and Gilbert Ave. (3), Elsinore Ave. and Reading Rd. (2), and Government Square Area H on Main at 6th (1). The schedule shows AM, PM, and AM again. The note at the end of the table reads the following: A - Amberly trip times: 7:06 am at Longmeadow and Lemarque; 7:15 am at Elbrook and Section. All trips are accessible with a wheelchair lift or ramp for people with disabilities.
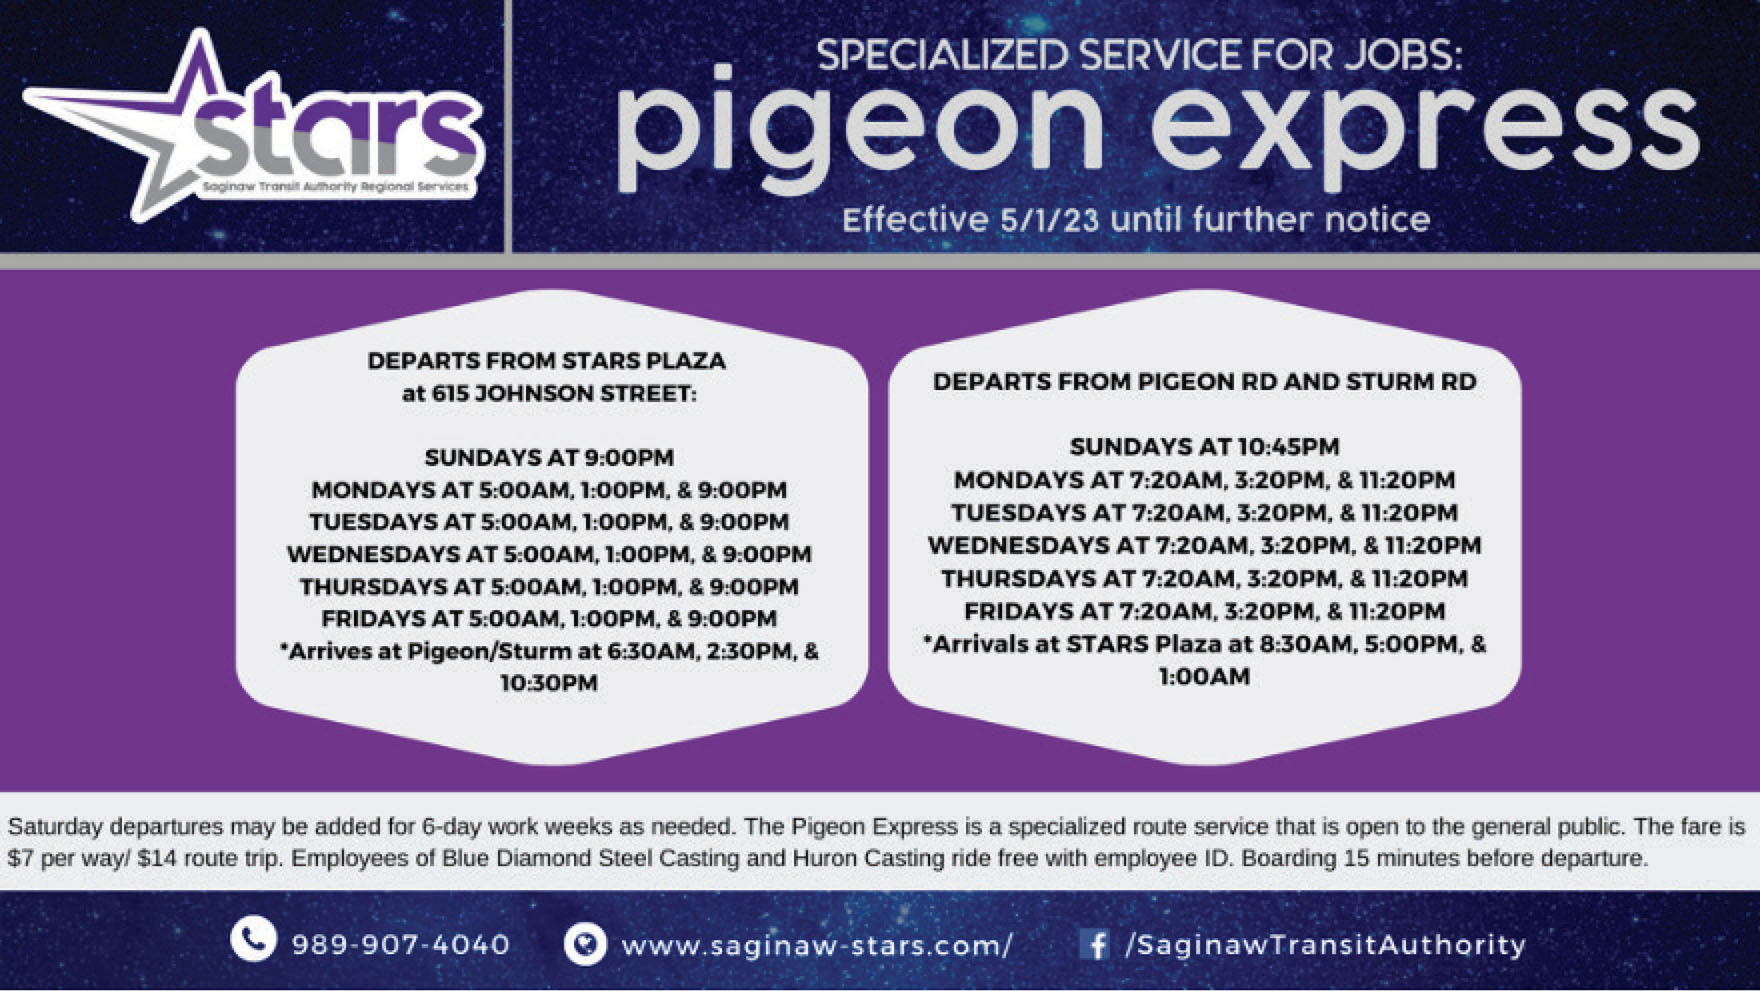
Source: Saginaw Transit Authority Regional Services
Long Description.
The poster begins with the text Specialized service for jobs: Pigeon Express. Effective 5/1/23 until further notice. The poster consists of two sections. Section 1 reads, ‘Departs From Stars Plaza at 625 Johnson Street’ while Section 2 reads, ‘Departs from Pigeon Rd and Sturm Road.’ The end of the poster reads, ‘Saturday departures may be added for 6-day work weeks as needed. The Pigeon Express is a specialized route service that is open to the general public. The fare is 7 dollars per way or 14 dollars round trip. Employees of Blue Diamond Steel Casting and Huron Casting ride free with employee ID. Boarding 15 minutes before departure. Contact Information: 989-907-4040. www.saginaw-stars.com. /SaginawTransitAuthority.’
Performance Monitoring
At a minimum, agencies tend to operate nighttime service based on the need to serve a specific trip purpose, and, at a maximum, it operates at a frequency and service level similar to off-peak or weekend service. Agencies use several different metrics to assess the need for service adjustments, including customer input, ridership at the start and end of the existing service span, transit propensity at certain locations, and employer requests. Agencies with nighttime service standards may assess service in comparison to set frequency standards. Because certain data points, including safety, cleanliness, and perception of service, are difficult to measure without customer input, an agency may release a survey to compare certain metrics between nighttime passengers and daytime passengers. Further, an agency may continuously collect customer feedback and ask respondents to specify what times of day they typically take transit. An agency may also lean into nighttime coalition partners or respond to calls from advocacy groups to assess the success and improvement areas of service.
Characteristics of Nighttime Transit Service
Strategies for Implementing Service
While some characteristics can overlap across different categories, nighttime transit offerings tend to fit within five categories of service:
- Owl service
- Extended service hours on existing routes
- Bus bridges
- Microtransit
- Contracted service with TNCs or shared-ride taxis
Owl Service
To meet nighttime transit needs, an agency may create a nighttime fixed route or set of nighttime fixed routes that operate distinctly from daytime service. Agencies may differentiate night owl services through naming conventions (Figure 8), through the creation of distinct routes and route names (Figure 9 and Figure 10), through signage and wayfinding (Figure 11), through the creation of night-only routes (Figure 12), or a mixture of these tools.
One benefit of a distinct owl service is a network that intentionally serves nighttime transit demand in a service area. When the San Francisco County Transportation Agency (SFCTA) created the All-Nighter service in the San Francisco Bay Area in 2006, it included a distinct network of bus routes operated by different agencies to accommodate mobility across the region. The creation of a multi-agency nighttime network was not only necessary due to overlapping service areas but also because travel demand models found that there was a higher demand for using transit to get in and out of the city between 12:00 a.m. and 5:00 a.m. compared to other time frames (Dentel-Post, et al., 2017). A separate network may better accommodate nighttime service in municipalities where nighttime travel patterns differ greatly from daytime ones. While a grid-like system is most suitable for creating crosstown access through transfers during the daytime, a hub-and-spoke model allows agencies to centralize rider transfers in well-lit transit hubs and decrease the amount of transfers a rider may take at nighttime (Zalewski, et al., 2019). A challenge to implementing a distinct night owl service is that it can be unfamiliar or confusing to riders who may not understand how it differentiates from daytime service, requiring specialized outreach and marketing efforts.
Extended Service Hours on Existing Routes
Extending service hours on existing fixed routes is common among agencies seeking to expand service into nighttime hours. Cities extending nighttime service but not reaching a 24-hour span tend to end service at 2:00 a.m. or 3:00 a.m. Cities with service ending earlier in the evening hours may only extend nighttime service until 11:00 p.m. or 12:00 a.m. Cities with similar daytime and nighttime transit destinations typically do not make a special service change and instead adjust the service span for existing routes. One significant benefit of choosing this approach is that it is easier for riders to navigate the system due to familiarity with existing routes. Though operational productivity is rarely a goal in nighttime service provision, one drawback is that fixed-route nighttime service can be less productive and operate at a higher cost per

Source: Metropolitan Transportation Commission
Long Description.
The poster shows the logo of the San Francisco Bay Area All-Nighter service depicting an owl looking from a crescent. The text reads, ‘All Nighter. 12:00 AM to 5:00 AM. 20 plus bus routes. Serving San Francisco, the East Bay, and the Peninsula.’
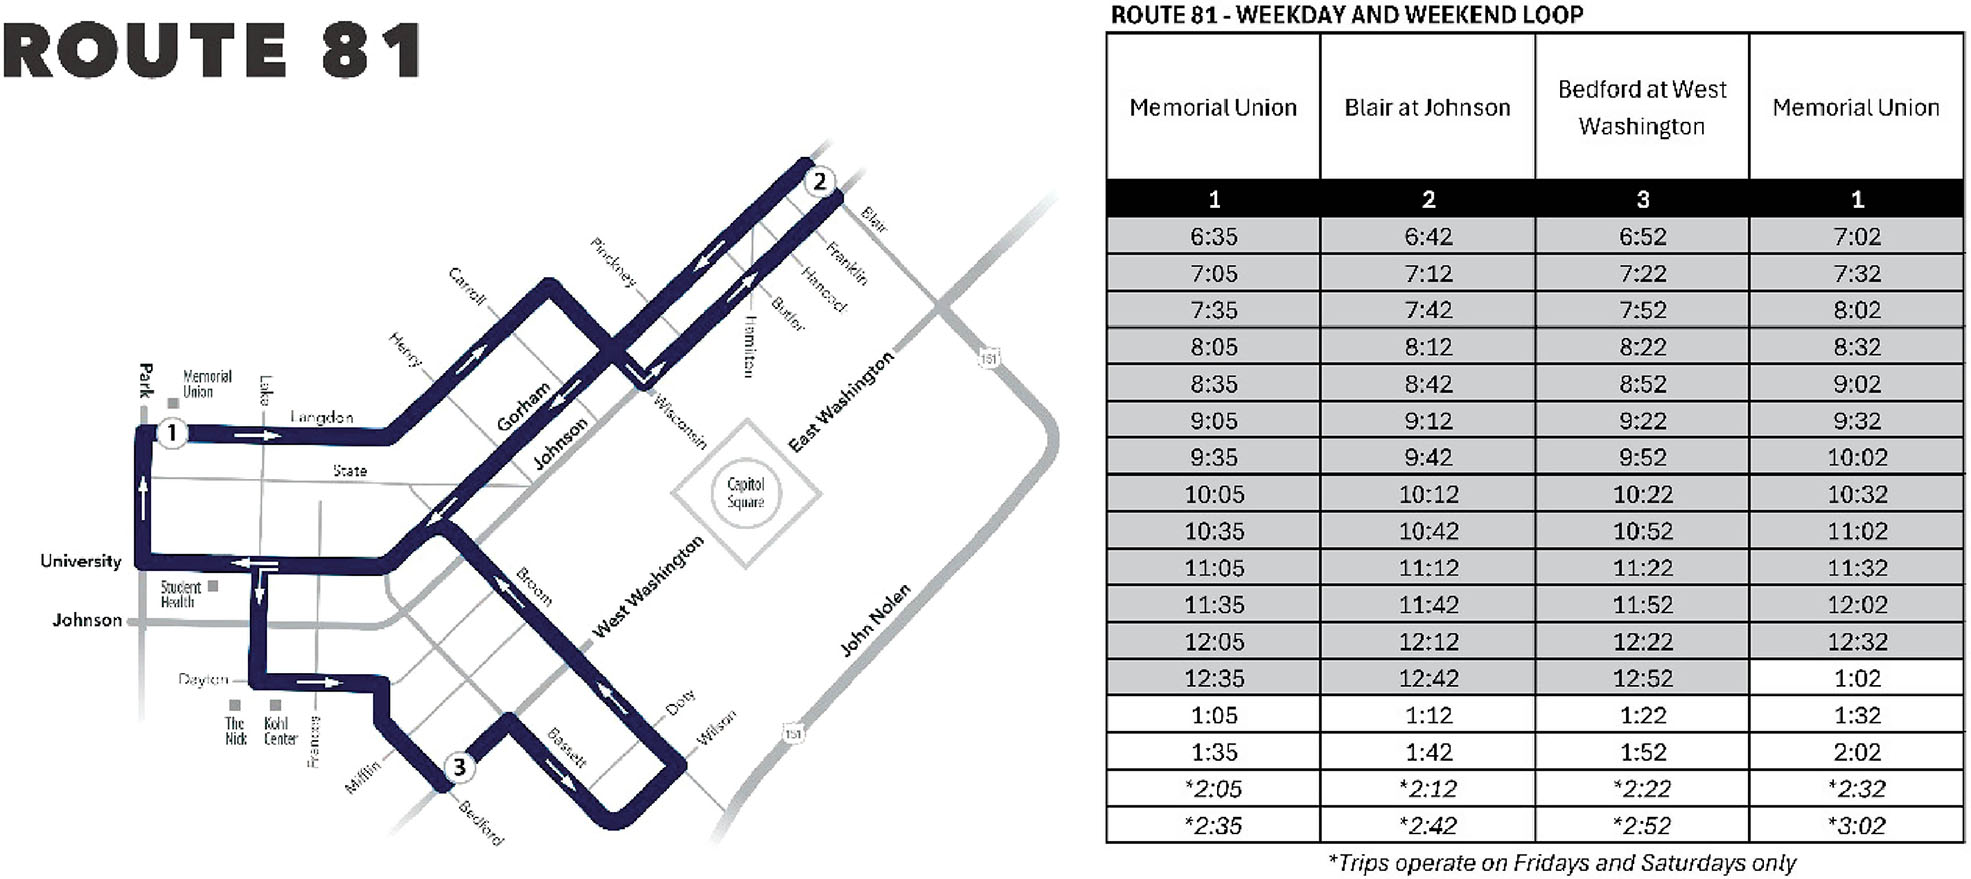
Source: City of Madison Metro Transit
Long Description.
The illustration shows the layout plan of Route 81 which shows Gorham, Johnson, University, Johnson, West Washington, East Washington, and John Nolen. The table is titled Route 81- Weekday and Weekend Loop. There are four columns and the column heads are: Memorial Union, Blair at Johnson, Bedford at West Washington, and Memorial Union. The columns contain times for bus arrival and some times are for Fridays and Saturdays only. The asterisk represents trips that operate on Fridays and Saturdays only.

Source: VIA Metropolitan Transit
Long Description.
The table is titled Route Listings and consists of three columns. There are three columns: Daytimes Routes (rutas por dia); Lineup Route (rutas de lineup); and Page (pagina). There are 9 rows of data. Row 1: 2; 202 Blanco; 8; row 2: 4,5; 204 San Pedro or McCullough; 9; row 3: 9; 209 Broadway or Nacog.; 10; row 4: 14, 17; 214 Austin Hwy. or Randolph; 11 ; row 5: 22, 24; 222 Hays or E. Houston; 12; row 6: 25, 26; 225 E. Commerce or M.L. King; 13; row 7: 28, 30; 230 Rigsby or Porter 14; row 8: 32, 34; 232 Steves Ave or S. St. Mary’s; 15; row 9: 36, 42; 242 Roosevelt or S. Presa; 16.

Source: Chicago Transit Authority
Long Description.
The sign shows the following text: cta bus stop. 4 Cottage Grove. The sign also shows an owl icon and a route image. The end of the sign reads, Text CTABUS to 41411 for estimated arrival times. transitchicago.com. (312)836-7000. TTY (312) 836-1949.
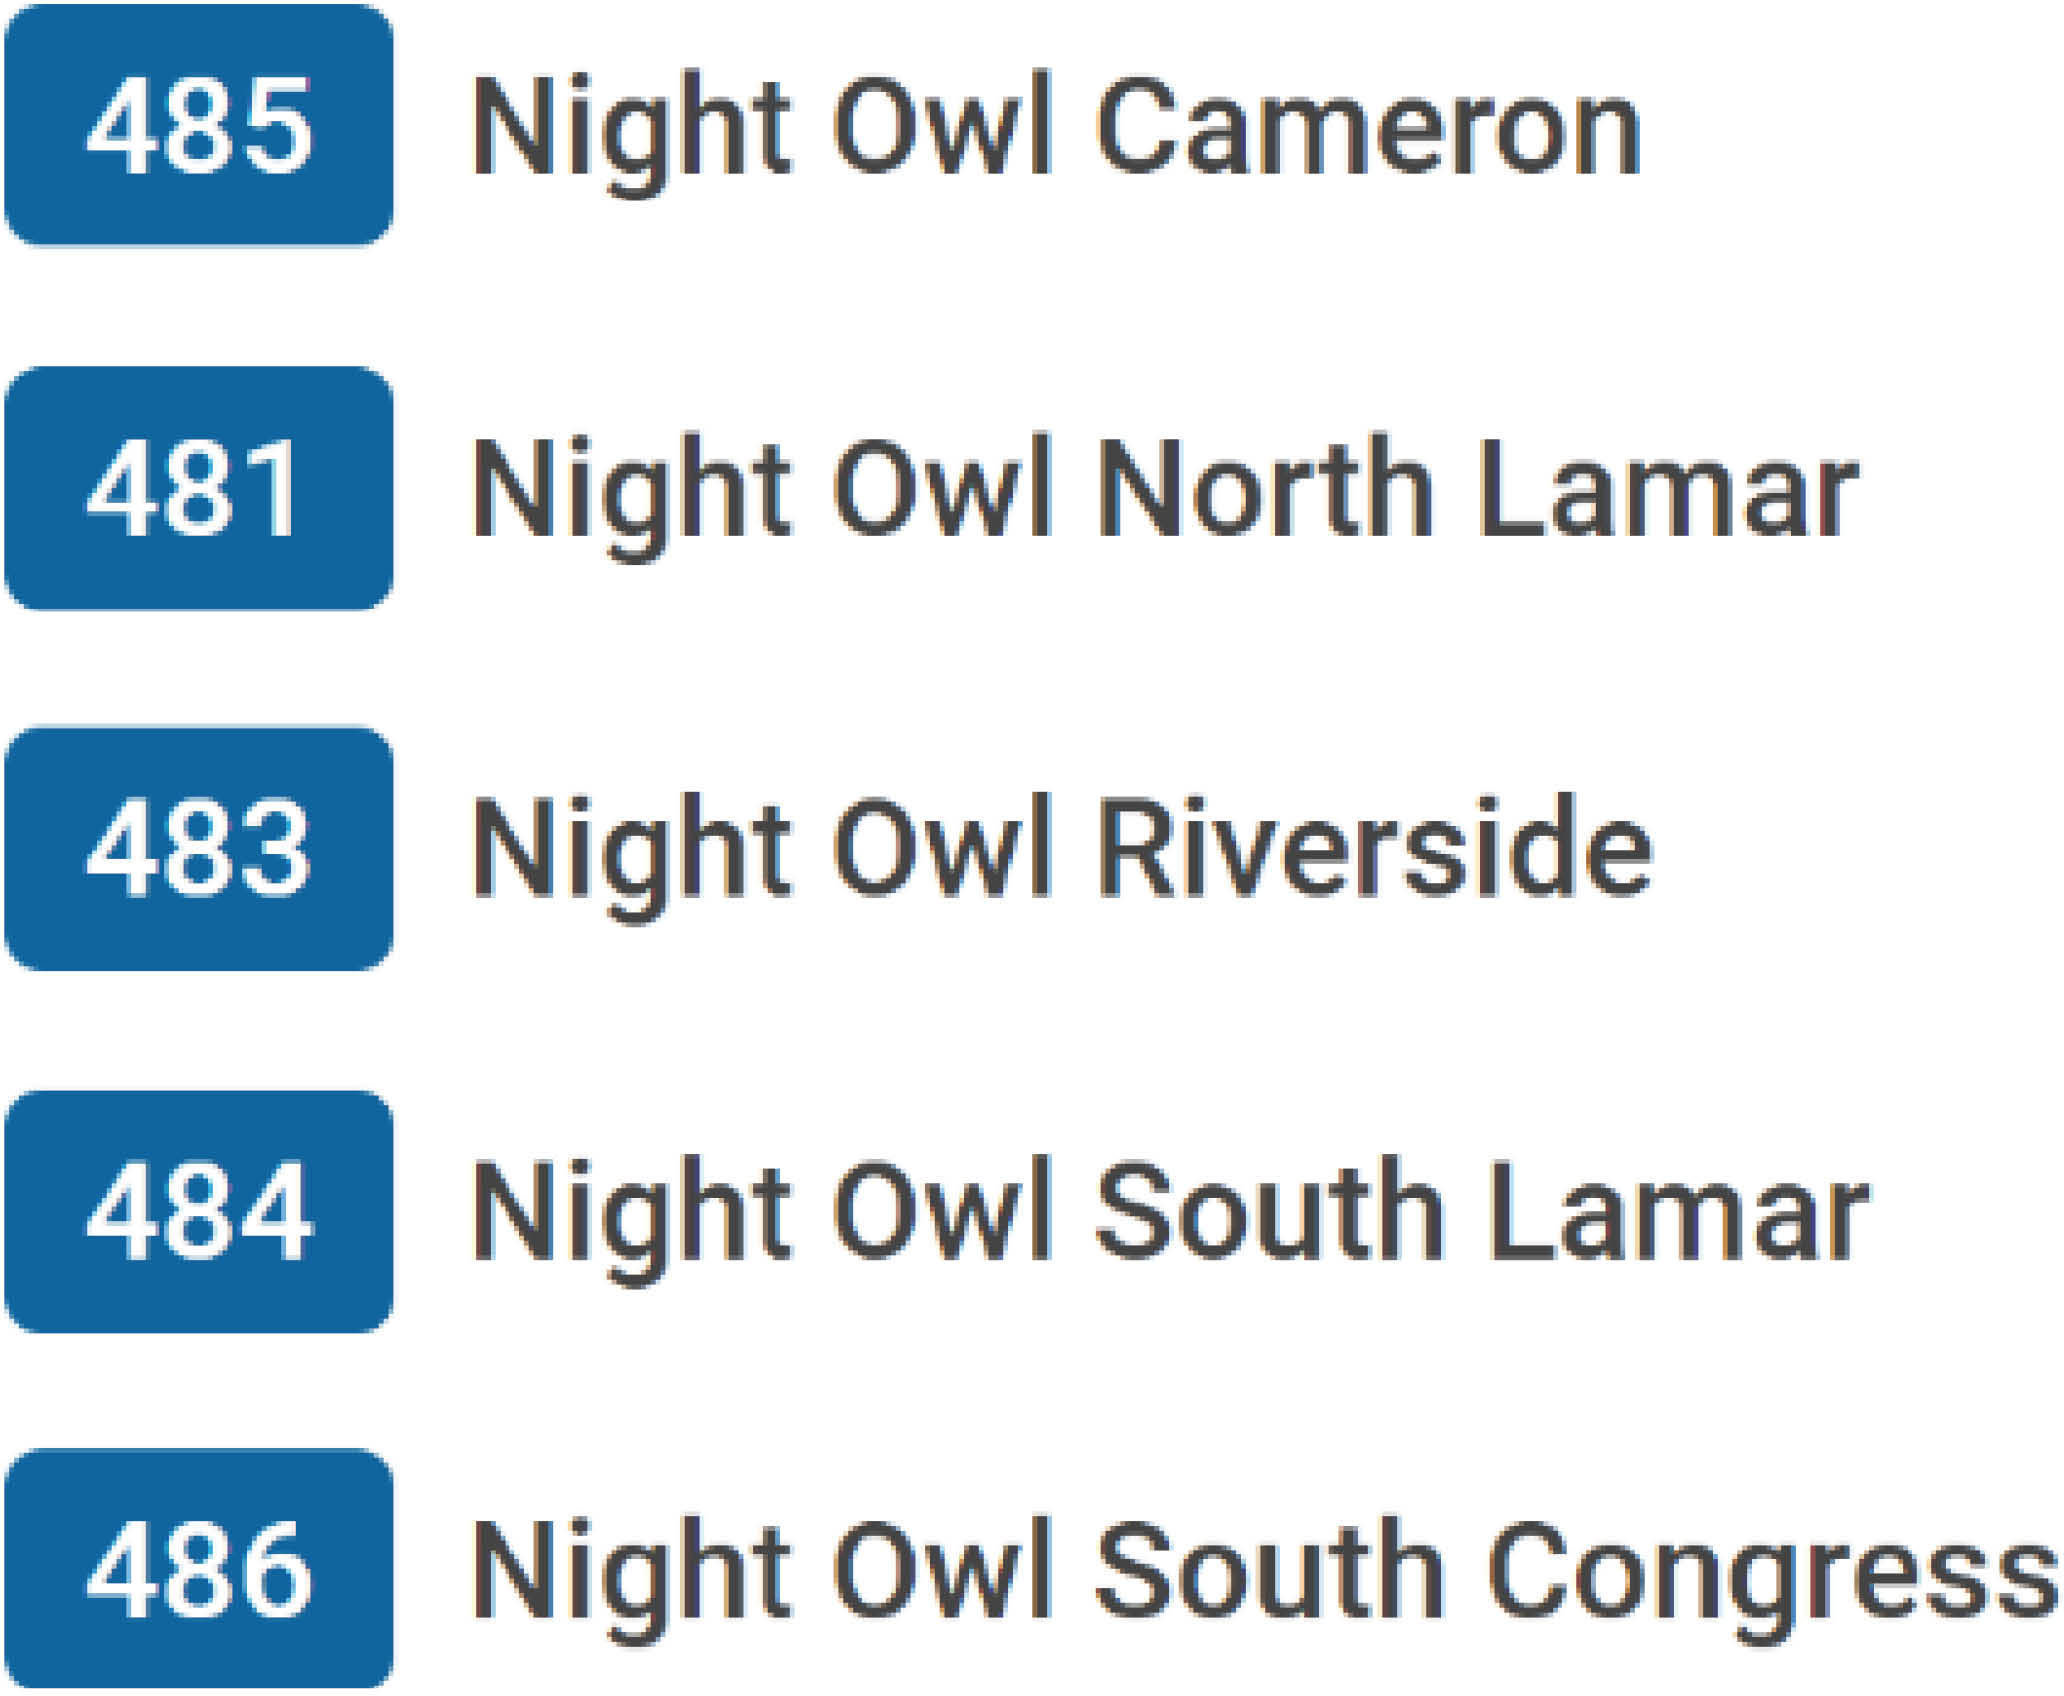
Source: Capital Metro
Long Description.
The night-only routes listed are 485-Night Owl Cameron, 481-Night Owl North Lamar, 483-Night Owl Riverside, 484-Night Owl South Lamar, and 486-Night Owl South Congress.
passenger due to lower ridership levels. When the MBTA implemented nighttime service across the system in 2015, they did so at a passenger subsidy of almost three times the cost of daytime bus service (MBTA, 2015).
Certain elements suitable for a daytime system may make nighttime service difficult to use. Extended daytime systems may have a spatial mismatch between transit stops and nighttime origins and destinations, a lack of appropriate infrastructure at all transit stops, and long headways. If a rider does not catch their bus when they intend to, they are faced with long wait times at stops. At outdoor transit stops, inclement weather, poor infrastructure (lack of lighting, seating, or heating), and low or high street life activity can make the wait uncomfortable for riders. While this may occur in owl services, extending the existing service hours alone may not account for these factors as closely as a special night service would.
Bus Bridges
Some agencies that run rail services may choose to replace service along a rail corridor with parallel bus services at nighttime, referred to as bus bridges and rail replacement buses. For example, San Franciscoʼs Municipal Transportation Agency (Muni) replaces two light rail lines (the L and N) with buses with its Muni Owl All-Nighter service. SEPTA is another agency that utilizes bus bridges operating the Market-Frankford Line via shuttle bus from 12:00 a.m. to 5:00 a.m. Bus bridges allow for routine maintenance of the rail system overnight, where reduced maintenance hours can prove an impediment to providing extended service hours at rail stations (Zalewski, et al., 2019). Another benefit is that bus service, running on surface streets, may allow for greater flexibility in route alignment to better serve nighttime origins and destinations. However, the street geometry, mixed transit and general-purpose traffic, and median speeds can make a bus equivalent route much longer compared to a rail route with exclusive right-of-way and higher median speeds. This proved to be a challenge for New York Cityʼs MTA, which used bus bridges to allow for overnight subway station cleaning in 2020. Outside of the Bronx, the street geometry and waterway barriers increased the run times of surface transit compared to subway travel and made it more time-consuming to transport passengers between boroughs (Surico, 2021).
Microtransit
Agencies may operate their own microtransit service, also referred to as on-demand or flexible transit service, or partner with a private company to provide nighttime service. Through its Pace Connect program, Pace Suburban Bus in Chicago implemented microtransit service primarily for serving nighttime trips between a designated zone at a rapid transit station and Chicago OʼHare International Airport. Tulsa Transit is another example, expanding its existing microtransit service at night by adding Nightline zones from 8:00 p.m. to 12:00 a.m. One benefit to this type of service is that it allows agencies to provide last-mile services at a more efficient cost compared to fixed-route service while allowing riders greater flexibility in scheduling transit trips, as well as the flexibility to board and alight vehicles closer to their origins and destinations. Another major benefit of implementing microtransit service is that it addresses passenger safety concerns around nighttime transit. A Los Angeles Metro report found that women feel unsafe walking to and waiting at transit stops and stations (Los Angeles Metro, 2019), something a curb-to-curb microtransit service would eliminate. Further, when Belleville Transit in Belleville, Canada, replaced fixed-route nighttime bus service with microtransit, the subsequent nighttime ridership increase was due, in part, to an increase in women using transit (Zhang, Farber, and Young, 2021). One challenge to operating this type of service can be educating passengers on how to utilize the service. Because microtransit service is a relatively new mode and deviates from traditional, fixed-route service, it requires marketing to foster rider awareness about the service. In the case of microtransit, access to the service is limited to those who are aware of it and to those with origins and destinations in predetermined microtransit zones.
Contracted Service with TNCs or Shared-Ride Taxis
Some agencies may subsidize the cost of ride-hailing services for low-income riders who would use transit if it were available. Pinellas Suncoast Transit Authorityʼs (PSTA) Transportation Disadvantaged Late Night and Valley Regional Transitʼs (VRT) Late Night subsidize ride-hailing services for nighttime riders who meet low-income thresholds through an eligibility process. PSTAʼs program provides up to 25 free work-related rides through Uber or United Taxi to those who do not have access to transportation to commute during hours buses are not in service. Eligible riders pay an $9 add-on to their monthly bus fare pass. Valley Regional Transit provides a promotional code to qualified riders that covers up to $20 after the first $3 of a Lyft ride during the hours between 9:00 p.m. to 6:00 a.m. within a special late-night service area. A setup such as this allows agencies to minimize costs while focusing on riders who benefit the most from nighttime service. Some agencies use contracted service at night regardless of trip purpose and rider type. Greater Richmond Transit Company (GRTC) provides a publicly available promotional code that provides up to two free TNC rides between GRTC bus stops requested between 4:00 a.m. and 6:00 a.m. and 11:00 p.m. and 2:00 a.m. The service was implemented in 2021 in response to operator shortages that suspended nighttime service operations.
One challenge to contracting services with TNCs is the difficulty negotiating contracts on providing services and data sharing. When trying to access origin and destination data from Uber, PSTA received this data after media attention (APTA, 2019). Another challenge is the fare payment structure of TNCs. When a transit agency subsidizes the cost of a ride-hailing service trip, the primary way to call a car and pay for a trip is through a smartphone application using a bank card or mobile bank account. While Uber and Lyft allow cash payments in some municipalities, it still poses a barrier to transportation-disadvantaged nighttime riders who disproportionately use cash, may not own a smartphone, and may be unbanked. A survey of New Orleans hotel workers found that more than 70 percent of transit riders pay for fares using cash (Ride New Orleans, 2023). GRTC is one agency that provides a solution to this problem by providing fare-free TNC trips and providing an option to request a trip over the phone, albeit with a longer wait time for pickups.
Nighttime Service Policies Compared to Daytime Service
Fare Policies
There is a lack of research that compares the differences between agenciesʼ daytime and nighttime fare collection policies. However, research and anecdotal evidence show that nighttime riders are a vulnerable group when enforcing fare policy or when agencies seek to modify fare media options, such as becoming a cashless system or eliminating cash-on-board. In a system where loading transit passes is moved to ticket vending machines, a network of retailers, or mobile ticketing, nighttime riders who use transit passes likely will not have access to ticket vending machines at bus stops or smartphone devices, and nearby retailers are likely to be closed. Needing physical access to ticket vending machines and retailers is especially difficult for riders who cannot add large amounts of money to transit passes at one time (e.g., monthly passes) and frequently add modest amounts to their cards (Ko, 2019). This is a challenge for low-income riders, nighttime riders, and night shift workers who are more likely to have low income (Zalewski, et al., 2019).
Night riders are vulnerable due to general nighttime safety concerns. If riders do not have transit fare, it is up to the discretion of a bus operator or rail station attendant to allow them on the bus or through the fare gate. While a daytime rider may choose to wait for another bus, visit another station or attempt a free ride or walk to their destination, a nighttime rider is likely faced with a long headway or a walk in the dark. This scenario forces the rider and transit operator to make a difficult choice. A London focus group on sentiments around the elimination of cash payment on buses found there was an increased amount of emotional labor needed to discern which passengers to let on fare-free and which to deny boarding (Pritchard, Vines, and Olivier, 2015). Even though operators were given guidelines on not abandoning vulnerable riders, there were inconsistencies in who operators defined as vulnerable.
Courtesy Stops
Courtesy stops, also referred to as flag stops or as-requested stops, allow passengers, when boarding, to request the bus operator stop between designated bus stops during nighttime hours, usually after 9:00 p.m. and before 7:00 a.m. If the bus operator can accommodate the request and determines it is a safe location to stop, the bus pulls over and lets passengers exit. Several public transit systems have implemented courtesy stops for riders at night, including WMATA, Austinʼs Capital Metropolitan Transportation Authority (CapMetro), Los Angeles Department of Transportation Transit (DASH), and Marylandʼs Montgomery County Department of Transportation (MCDOT). Though daytime service may limit or ban drivers from making stops outside designated stops (Pan, 2023), less rigorous performance standards, reduced impact on median vehicle speeds, decreased ridership, and increased emphasis on safety make implementing courtesy stops a simple nighttime policy that can improve rider experience.
Security for Operations Personnel, Passengers, and Infrastructure
Nighttime operations can create challenges for operators and passengers due to real and perceived safety issues from reduced activity and visibility. Operators have reported feeling unsafe due to reduced street activity and central office support (e.g., field supervisors) should something occur while on the road. At SEPTA, bus operators reported facing verbal harassment and threats from passengers and felt unsafe due to behavior that occurs on overnight buses (Winberg, 2021). Due to the process bus operators choose the routes and times they work, less experienced operators are often left with the least desirable routes in the early morning and late hours (TransitCenter, 2022). Layovers is another area where operator safety can be an issue. Similar to passengers who may be unable to access retail stores after closing hours, bus operators may be unable to utilize daytime layover locations. Nighttime can exacerbate already poor access to bathroom amenities and can result in operators having to travel additional distances to
access bathrooms, rest areas, and food (TransitCenter, 2022). Some layover locations that may be acceptable during the day, such as a quiet street or under a bridge, may not be well-lit, visible, or safe at night.
Gender plays an important role in the use of transit at nighttime. A survey of San Francisco transit riders found that 60 percent of respondents often or sometimes choose not to travel at night due to safety concerns. When isolating results by gender, the figure rose to 70 percent for women (San Francisco Entertainment Commission, San Francisco County Transportation Authority, and San Francisco Office of Economic and Workforce Development, 2015). Furthermore, a 2018 report found that many surveyed women residing in New York City felt unsafe using public transportation at night, with 29 percent of those surveyed reporting they do not take transit at night due to safety concerns (Kaufman, Polack, and Campbell, 2018). The same report found that the perception of public transit safety at night was much lower among infrequent users of transit and that ride-hailing services were considered the safest transportation option among all riders, creating a challenge to encouraging new nighttime transit riders. In both New York City and San Francisco, the reports found that poor lighting creates safety concerns for women.
Intergovernmental and Private Partnerships
Explicit federal funding for implementing nighttime transit and other off-peak transit services was first available via a competitive grant and then a formula program titled the Job Access and Reverse Commute (JARC) program from 1998 to 2012 (Freemark, et al., 2021). While some states have implemented their own JARC program that agencies can use to fund nighttime transit services, an equivalent federal program does not currently exist. For this reason, agencies that are unable to implement budget-neutral nighttime service or obtain funding from traditional funding sources (such as farebox recovery, state funding, and sales taxes) often choose to enter partnerships with local governments, academic institutions, and large employers to provide nighttime transit service.
A partnership between local government and transportation agencies can benefit both entities. Transportation agencies receive consistent funding for night service, which can be expensive to operate for agencies due to the higher cost per passenger, labor costs, and increased maintenance needs. Having funding specifically set aside to operate nighttime services removes the risk of pitting daytime service against nighttime service. City governments benefit by having a safe and cost-effective mobility option for tourists, nighttime workers, and nighttime patrons. Plus, it minimizes the number of cars in the downtown area, where parking may be limited. In Salt Lake City, the city government partners with the Utah Transportation Authority (UTA) to provide microtransit and fixed-route transit service between regional employment centers and downtown Salt Lake City from 4:00 a.m. to 12:15 a.m. on weekdays and Saturday (Salt Lake City, n.d.).
In addition to local governments, employers can play a role in providing nighttime transit service to employees. In municipalities with one or a few large employers, employers may fund or subsidize transit service to enable workers to get to and from the workplace when regional transit agencies are not in service. The Metropolitan Council of the Minneapolis/St. Paul region is a transit operator that partnered with employers at Minneapolis-St. Paul International Airport to provide nighttime bus service for employees to and from the airport. This service is partially funded through an employer match of passenger fares of those who ride the bus (Metropolitan Council, 2017).
Employers can facilitate transit ridership by providing commuter benefits. In New Orleans, a survey found that three out of 16 hotels where respondents worked provided employees with transit passes (Ride New Orleans, 2023). While the distribution of transit passes may not enable
the provision of night service, providing pre-loaded transit passes as an employee benefit can provide a consistent form of funding for night transit services for agencies and support employees who use transit. Employers can implement other strategies, such as providing well-lit protected transit shelters, especially for workers in industrial parks, information on transit timetables, and an open communication channel with the local transit agency to share current shift information to make it easier for employees to access existing transit during nighttime hours.
Conclusion
This chapter consolidates findings from existing literature on topics related to nighttime transit planning and operations, including a review of post-COVID ridership trends, how transit serves the nighttime economy, the characteristics of nighttime transit in the United States and Canada, nighttime transit and economy in the context of this review, the challenges and success of nighttime transit operations, and how partnerships play a key role in providing nighttime transit services.
Gaps in the literature review include an understanding of the internal agency structure for nighttime planning and a comprehensive review of the economic impact of the nighttime economy on municipalities. The survey results in Chapter 3 clarify the focus areas and structures of agencies that operate or have operated nighttime transit services.


