Trends in Federal Support of Research and Graduate Education (2001)
Chapter: 4 Agency Trends in Research and Graduate Education Support
4
Agency Trends in Research and Graduate Education Support
In this chapter we examine the data presented in Chapters 2 and 3 from the perspective of the principal federal agencies supporting research. How did agencies with shrinking, growing, or steady research budgets treat their research portfolios in the 1990s, and how did these decisions affect the composition of the federal research portfolio overall? Did they change or maintain the mix of research they were funding? Did agencies that were dominant funders of particular fields attempt to protect those fields from budget cuts? Did agencies with growing budgets diversify their research portfolios? Did they step in to increase their investments in research fields whose support from other agencies was declining or to pick up slack in graduate student support? Finally, once growth resumed, as it did to varying degrees in all but one agency by 1999, have agencies moved to restore funding of fields that they previously had cut?
A variety of factors, many of them specific to agencies, their missions, and their political environments and much too complex to examine here, determine how agencies treated their research portfolios during this period. We are simply interested in whether, in a period of budget contraction, adjustments occur across agencies or across time that reflect concern about reductions in investment in particular research fields. The answer is that in most agencies, both those experiencing tight budgets and those benefiting from increasing congressional appropriations, there were substantial changes in research priorities but little evidence of adjustments across agencies.
PORTFOLIO CHANGES IN AGENCIES WITH REDUCED RESEARCH FUNDING
Department of Defense
As of 1999, two agencies had less funding for research than in 1993—Department of Defense (DOD) and Department of the Interior. Others, including the DOE and USDA, surpassed their 1993 level of spending with the budget gains in 1998 and 1999. DOD funding of research fell by 13.2 percent from 1993 to 1994 and continued to decline through 1997, when it was 26.6 percent less than in 1993. Despite some budget growth in 1998 and 1999, DOD’s funding of research was still 22.4 percent less than it was in 1993.
Did the substantial cuts in research funding at DOD negatively affect fields that received most of their funding from DOD in 1993? At that time, for example, DOD accounted for 82 percent of federal funding of electrical engineering, 75 percent of mechanical engineering, 73 percent of metallurgy/materials engineering, and 57 percent of computer science research.1
As Annex Table 4–1 indicates, DOD did not impose across-the-board cuts on the research fields it was supporting in 1993. Those cut more than average (22.4 percent) were environmental biology, psychology, chemistry, physics, atmospheric sciences, geology, mathematics, social sciences and most fields of engineering—astronautical, chemical, civil, electrical, mechanical, and metallurgy/ materials. DOD was far and away the dominant funder of the latter three fields in 1993. Medical sciences were cut, but less than average (Figure 4–1).
Despite the strong downward pressure on DOD’s research spending in the mid-1990s, several fields received increased although not necessarily substantially increased DOD support—biology, astronomy, oceanography, computer science, and aeronautical engineering.
In the case of oceanography, increased funding from DOD helped offset a decrease of more than a third by the Department of Commerce, the field’s largest single federal
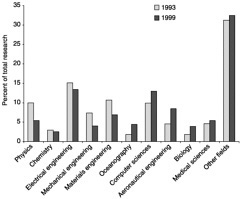
FIGURE 4–1 Research funding by field, Department of Defense, FY 1993 vs. FY 1999.
source of support in 1993 through its agency, the National Oceanographic and Atmospheric Administration. In aeronautical engineering, in which NASA is the major funder, DOD funding went from being about 7 percent less in 1997 than in 1993 to being 44 percent more in 1999. That increase helped put overall federal funding of aeronautical engineering research 21 percent higher than in 1993. DOD funding of life sciences (primarily biological and medical sciences) fell from 1993 to 1997, when it was 28 percent less than the 1993 level. But it began to increase again in 1998 (by 48 percent over 1997). In 1999, it was 14 percent more in 1999 than in 1993, and it was expected to be 43 percent more in 2000. The largest boost after 1997 was in the biological sciences, reflecting in part the growth in the congressionally mandated research programs on breast, prostate, and ovarian cancers and also increased attention to biological threats to national security.
As shares of DOD’s research budgets, the life sciences increased from 7.8 percent to 11.4 percent, computer science from 9.9 percent to 13.0 percent, and environmental sciences from 5.5 percent to 7.9 percent because of increased funding of oceanography (Annex Table 4–1). The physical sciences dropped from 14.1 percent to 9.8 percent and engineering from 51.2 percent to 47.1 percent. Thus, there was a shift in DOD’s portfolio of about 9 percentage points from the physical sciences and engineering to the life sciences (up 3.6 percentage points), computer science (up 3.1 percentage points), and oceanography (up 2.6 percentage points).
The fields that DOD favored—biological and medical sciences, computer science, oceanography, aeronautical engineering, and metallurgy/materials engineering—were fields receiving increases from other agencies. In fact, all but metallurgy/materials engineering had at least 20 percent more funding in 1999 than in 1993. Some fields cut at DOD—mathematics, astronautical and civil engineering, psychology, and social science—have ended up with increased funding overall because other agencies stepped up their support. But other fields with less DOD support—chemistry, physics, geology, and chemical, electrical, and mechanical engineering—did not pick up increases from other agencies and were down compared with 1993, all but chemistry by at least 20 percent.
Trends in the number of full-time graduate students supported by the DOD are generally consistent with the changes in funding levels of research. Overall, the number of DOD-supported full-time graduate students decreased by 17.6 percent, from 1993 to 1999 (Annex Table 4–2). The decreases occurred in almost all fields. Among engineering fields with the largest decreases were civil engineering, down by 52.1 percent, aerospace engineering, down by 41.5 percent, and metallurgy and materials engineering, down by 38.2 percent. Among graduate students in the sciences, those in mathematical science decreased by 43.1 percent, those in social sciences decreased by 37.4 percent, those in earth, atmospheric and ocean sciences decreased by 34.4 percent, and those in physical sciences decreased by 25.6 percent. DOD-supported students in the health fields were down by 16.6 percent, but students in the biological science were up by 23.4 percent. Also increasing were the numbers of graduate students in electrical engineering, up by 4.4 percent, and in chemical engineering, up by 17.3 percent.
Department of Energy
Although DOE’s funding of research was 2.1 percent higher in 1999 than in 1993, the DOE research budget took a 7 percent cut from 1993 to 1994, bottomed out in 1996, and did not reach its 1993 level until 1998. Some fields were cut more than others were, and although research is growing, the allocation of funds among fields has been changed (Figure 4–2, Annex Table 4–3).
Despite increases in research funding since 1996, the physical sciences were cut by more than a quarter from 1993 to 1999 (26.8 percent, from $2.2 to $1.7 billion). As a share of the DOE research portfolio they declined from 58 percent to 42 percent. Environmental science research support also was reduced after 1997. These fields were up by 6 percent over 1993 in 1997 but down by 8 percent two years later. From 1993 to 1999, oceanography was down by 36 percent, geology by 33 percent, and atmospheric sciences by 8 percent.
Life sciences were also down (by 7 percent, from $275 to $255 million), but not as much as in 1997 when they were 17 percent less than in 1993. The big hits were in biology (down by $13 million) and n.e.c. (down $11 million). Environmental biology nearly quadrupled, but from a small base (280 percent, from $2.2 to $8.5 million).
Meanwhile, computer science gained relative advantage. In 1999, computer science funding was 339 percent greater than in 1993, and the field went from 3 to 13 percent of the DOE research portfolio. Engineering also increased its support, absolutely—rising 46 percent—and relatively, going from 19 to 28 percent of the portfolio. Chemical, electrical, and mechanical engineering were down substantially (19, 36, and 61 percent, respectively), but these reductions were swamped by tremendous growth in materials engineering (343 percent, from $75 million to $331 million). Engineering other (up 33 percent, from $427 million to $568 million) and civil engineering (up 27 percent, from $36 million to $46 million) also received increased funding.
In dollar terms, from 1993 to 1999 there was a substantial shift toward computer science (+$391 million) and materials engineering (+$256 million) and away from physics (−$461 million), chemistry (−$85 million), and to a lesser amount, other fields in engineering and environmental sciences (−$20 million to −$40 million each). Computer science and materials engineering went from a combined 5 percent to 21 percent of DOE’s portfolio. In the case of computer science, several other agencies also increased funding although DOE accounted for 66 percent of the net increase. DOE’s increase of $256 million in metallurgy/materials engineering offset most of the DOD reduction of $283 million. DOE increases for environmental biology, mathematics, and civil engineering helped offset cuts elsewhere.
DOE was the majority funder of physics in 1993, and the large reductions in funding after 1993 have not been offset by other agencies. In fact, as shown above, DOD, the second largest funder, also reduced its funding substantially, and funding for physics research is 25 percent less in 1999 than in 1993, about the same level it has been since 1996. Some other fields with reduced DOE funding have also been those cut overall—astronomy, chemistry, geology, and chemical, electrical, and mechanical engineering. It is not possible to relate these research funding trends to DOE graduate student support because the latter data were not available by field until very recently.
PORTFOLIO CHANGES IN AGENCIES WITH INCREASED RESEARCH FUNDING
National Institutes of Health
NIH has received steady annual increases during the 1993 to 1999 period, resulting in an annual compound growth rate of 4.9 percent. Those increases accounted for most of the net increase in all federal spending on research from 1993 to 1999. Where were these increases invested?
NIH increased the allocation of its research funding to the life sciences by a percentage point, to 86.8 percent, from 1993 to 1999 (Annex Table 4–4). Within the life
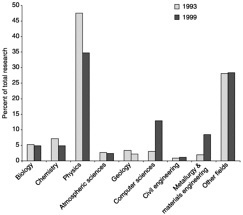
FIGURE 4–2 Research funding by field, Department of Energy, FY 1993 vs. FY 1999
sciences, however, there was a modest shift toward medical sciences and away from biological sciences (Figure 4–3). Biological sciences went from 44.1 percent to 40.6 percent of all spending by NIH on research while medical sciences went from 40.2 percent to 43.3 percent. The greater emphasis on medical sciences was especially evident in the period between 1993 and 1997. Since 1997, the annual increases for biological sciences have been about the same as those for medical sciences.
Chemistry, physics, psychology, and social sciences received more funding in absolute terms but declined as a percentage of all NIH research funding. The increases occurred mainly after 1997. NIH accounted for 22 percent of all federal funding of chemistry research in 1999, and if it had not increased its level of support by $22 million over 1993, federal funding of chemistry would have been 15.7 percent less than in 1993 instead of 13.4 percent less. The amount of NIH funding for physics research was small, $23 million, just 1 percent of all federal funding in 1999, so the NIH increase had little effect on the reduction of 24.6 percent in funding of physics research.
Math and computer science received large percentage increases between 1993 and 1999–1,201 percent and 209 percent, respectively—but the amounts were small ($45 million in 1993, $116 million in 1999). Together, they constituted 0.5 percent of NIH spending on research in 1993, 0.9 percent in 1999. The trend was similar for engineering. NIH increased its funding substantially in percentage terms (69.9 percent) but not as a share of its portfolio (from 1.1 to 1.4 percent).
Overall, NIH continued to focus on the life sciences, accounting for most of the 28 percent increase in total

FIGURE 4–3 Research funding by field, National Institutes of Health, FY 1993 vs. FY 1999.
federal funding, and especially the medical sciences. There has been little diversification, at least with respect to the physical sciences and engineering. Mathematics and computer science support has increased substantially but still constitutes less than 1 percent of NIH’s research budget.
A similar pattern holds for NIH graduate student support. The number of full-time graduate students in science, engineering, and health fields whose primary source of support was NIH increased 4.8 percent from 1993 to 1999 (Annex Table 4–5). The greater part of the increase in NIH support for graduate students went to those in health fields and the biological sciences. NIH-supported graduate students in health fields increased by 746, or 32.9 percent, and those in biological sciences increased by 4.1 percent. While their numerical increases are not as great, NIH-supported psychology graduate students increased 9.6 percent and NIH-supported engineering students increased 6.3 percent. An increase of 12.2 percent in biomedical engineering students supported by NIH accounts for much of the engineering increase. The rising tide at NIH, however, did not lift all boats. NIH-supported graduate students in the physical sciences declined by 19.2 percent and in computer science by 35 percent.
National Science Foundation
Among federal research agencies, NSF has the broadest portfolio and the most discipline-based organization and funding procedure. How the agency has distributed its budget increases is therefore of particular interest.
In the 1993 to 1999 period, NSF gave larger than average (19.3 percent) increases to the life sciences, computer science, several fields of engineering, and the social sciences, and this pattern is expected to continue in 2000 (Figure 4–4, Annex Table 4–6). Life sciences research went from 15.9 percent of the NSF research budget to 16.4 percent. Computer science funding increased from 6.7 percent to 11.9 percent of the NSF research budget. Civil engineering and metallurgy/materials engineering went from 1.5 percent to 1.6 percent and 1.1 percent to 4.5 percent, respectively. Social sciences went from 3.0 percent to 4.4 percent.
During the same period NSF gave less than average increases to mathematics research and most fields in the physical sciences, environmental sciences, engineering, and psychology. In some fields, NSF funding increased (astronomy, chemistry, atmospheric sciences, oceanography) and in some fields it declined (physics, geology, math, chemical engineering, electrical engineering, and mechanical engineering), but all of these fields consumed a smaller share of the NSF research budget in 1999 than in 1993. Nevertheless, although research funding for the physical sciences did not do as well at NSF as some other fields, astronomy and chemistry had a level of funding that was slightly larger in 1999 than 1993 and physics was not cut nearly as much as elsewhere, which moderated the government-wide reductions for these fields.
In dollar terms, there were substantial shifts away from the physical sciences and geology and toward computer science and metallurgy/materials engineering. Shifts in other fields were smaller in terms of changes in the NSF portfolio, although perhaps quite large for a particular field.2 If the physical sciences had still accounted for 24.9 percent of the NSF research budget in 1999 as they did in 1993, those fields would have received $96 million more than the $528 million NSF actually spent in 1999. Geology would have received $183 million rather than the $110 million NSF spent in 1999. The life sciences would have had a little less ($12 million) if the allocation had not shifted from 1993 to 1999. Computer science research received about $9 million more in 1999 than it would have using the 1993 percentage. The big dollar shifts were toward oceanography and some subfields of engineering. Funding for oceanography was $111 million more than it would have been if NSF had not doubled its share of the research budget since 1993. Similarly, funding for metallurgy/materials engineering research was $84 million more than if NSF had not quadrupled its share. There was also a large increase in other engineering, which received $128 million more than it would have.
The physical sciences, environmental sciences (except
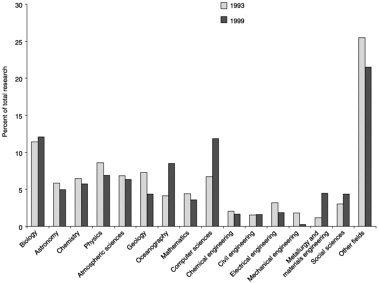
FIGURE 4–4 Research funding by field, National Science Foundation, FY 1993 vs. FY 1999.
for oceanography), math, and psychology were a smaller part of NSF funding in 1999 than in 1993. But the same fields also received smaller shares of DOD research funding. The percentage of NSF spending on life sciences research increased, but it also did so at DOD. When added to the large increase at NIH, the increases by NSF and DOD helped push the percentage of federal research funding spent on life sciences from 40.1 percent in 1993 to 46.0 percent in 1999.
Oceanography was another field that increased at both NSF and DOD, giving that field a large boost despite decreases at Commerce and Interior. A greater percentage of NSF research funding went to engineering research, compared with a smaller percentage of DOD’s. Most of the increase in engineering research at NSF was for metallurgy/materials engineering. That increase of $88.1 million did, however, partially offset DOD’s reduction of $283.0 million. The NSF increase together with DOE’s increase of $256.4 million more than offset the DOD reduction. The increase in the NSF budget for social sciences research of $45.9 million also helped offset decreases at DOD, DOE, and USDA of $22.3 million, $23.0 million, and $20.7 million, respectively.
In short, with some exceptions—psychology, mathematics, chemistry, and astronomy—NSF increased funding of fields with increased funding overall and reduced funding of fields whose combined federal support was stable or declining in the 1990s, thus reinforcing rather than offsetting the changes occurring elsewhere. Of course, given the relatively modest size of the NSF budget, increases in NSF funding would not be sufficient to compensate for the substantial cutbacks in some fields at DOD and DOE. In chemistry research, for example, which was down by $126.2 million overall in 1999 compared with 1993, NSF’s increase of $7.9 million in 1999 over 1993 did little to offset decreases totaling $181.3 million at DOD, DOE, and other agencies.3 NSF had more effect in astronomy, where its increase ($1.9 million) was larger relative to cuts at DOE and NASA ($15.7 million).
The pattern of NSF graduate support is more mixed. There were increases in some fields whose research support was growing but also in some fields whose research funding was declining. Overall, the number of full-time graduate students in science, engineering, and health fields whose primary source of support was NSF increased 2.4 percent from 1993 to 1999 (Annex Table 4–7). The largest numerical increases in NSF-supported graduate students were in computer science, which increased by 30.1 percent, electrical engineering, which increased by 15.1 percent, and the biological sciences, which increased by 8.8 percent. There were substantial increases in several
additional fields. NSF-supported graduate students in mechanical engineering increased by 9.1 percent, in metallurgy and materials engineering by 13.3 percent, other engineering by 16 percent, and the social sciences by 7.3 percent. There were also large reductions in several fields. NSF-supported graduate students in aerospace engineering declined by 38.0 percent, in physical sciences by 9.5 percent, and earth, atmospheric, and ocean sciences by 17.4 percent.
ANNEX
TABLE 4–1 Trends in DOD Support of Research by Field, 1993 to 1997, 1999 (constant dollars)
TABLE 4–2 Full-time Graduate Students Whose Primary Source of Support is the Department of Defense by Field, 1993–1999
| Change 1993–1999 | ||||||||
| 1993 | 1994 | 1995 | 1996 | 1997 | 1998 | 1999 | Number | Percent |
Engineering, total | 5,139 | 4,717 | 4,810 | 4,538 | 4,773 | 4,316 | 4,352 | −787 | −15.3% |
Aerospace | 749 | 605 | 535 | 492 | 501 | 459 | 438 | −311 | −41.5% |
Chemical | 139 | 128 | 164 | 169 | 169 | 160 | 163 | 24 | 17.3% |
Civil | 328 | 321 | 290 | 215 | 232 | 192 | 157 | −171 | −52.1% |
Electrical | 1,764 | 1,664 | 1,706 | 1,651 | 1,938 | 1,803 | 1,842 | 78 | 4.4% |
Mechanical | 797 | 782 | 823 | 739 | 766 | 728 | 713 | −84 | −10.5% |
Metallurgy/Materials | 518 | 426 | 468 | 468 | 441 | 342 | 320 | −198 | −38.2% |
Engineering, other | 844 | 791 | 824 | 804 | 726 | 632 | 719 | −125 | −14.8% |
Sciences, total | 4,176 | 4,351 | 4,196 | 3,933 | 3,928 | 3,643 | 3,322 | −854 | −20.5% |
Physical sciences | 1,187 | 1,316 | 1,198 | 1,073 | 1,037 | 994 | 883 | −304 | −25.6% |
Earth, Atmos., Ocean. Sci. | 517 | 494 | 410 | 393 | 366 | 336 | 339 | −178 | −34.4% |
Mathematics | 399 | 372 | 322 | 351 | 363 | 283 | 227 | −172 | −43.1% |
Computer science | 1,327 | 1,345 | 1,419 | 1,349 | 1,434 | 1,307 | 1,213 | −114 | −8.6% |
Agricultural sciences | 37 | 35 | 32 | 38 | 39 | 47 | 28 | −9 | −24.3% |
Biological sciences | 273 | 347 | 359 | 365 | 373 | 356 | 337 | 64 | 23.4% |
Psychology | 163 | 175 | 175 | 139 | 113 | 128 | 124 | −39 | −23.9% |
Social sciences | 273 | 267 | 281 | 225 | 203 | 192 | 171 | −102 | −37.4% |
Health Fields, total | 435 | 381 | 333 | 331 | 320 | 300 | 363 | −72 | −16.6% |
Total | 9,750 | 9,449 | 9,339 | 8,802 | 9,021 | 8,259 | 8,037 | −1,713 | −17.6% |
SOURCE: NSF/SRS Survey of Graduate Students and Postdoctorates in Science and Engineering, Fall 1999. | |||||||||
TABLE 4–3 Trends in DOE Support of Research by Field, 1993 to 1997, 1999 (constant dollars)
| Percent change | Share of total | |||
| 1993–1997 | 1993–1999 | 1993 | 1997 | 1999 |
Total, all fields | −4.4% | 2.1% | 100.0% | 100.0% | 100.0% |
Life sciences, total | −17.4% | −7.2% | 7.2% | 6.2% | 6.5% |
Biol (excl. environmental) | −17.0% | −6.4% | 5.3% | 4.6% | 4.8% |
Environmental biology | −54.0% | 280.2% | 0.1% | 0.0% | 0.2% |
Agricultural sciences | −100.0% | −100.0% | 0.0% | 0.0% | 0.0% |
Medical sciences | −1.5% | −2.9% | 1.4% | 1.5% | 1.4% |
Psychology, total | 0.0% | 0.0% | 0.0% | 0.0% | 0.0% |
Physical sciences, total | −19.0% | −26.8% | 58.1% | 49.2% | 41.6% |
Astronomy | −100.0% | −100.0% | 0.4% | 0.0% | 0.0% |
Chemistry | −11.4% | −31.0% | 7.2% | 6.6% | 4.8% |
Physics | −27.7% | −25.3% | 47.5% | 35.9% | 34.8% |
Environmental sciences, total | 6.1% | −8.3% | 8.9% | 9.8% | 8.0% |
Atmospheric sciences | −11.5% | −8.3% | 2.7% | 2.5% | 2.4% |
Geological sciences | −54.7% | −33.1% | 3.4% | 1.6% | 2.2% |
Oceanography | −10.7% | −36.3% | 0.2% | 0.2% | 0.1% |
Math and computer science, total | 84.2% | 167.1% | 6.0% | 11.5% | 15.7% |
Mathematics | 15.9% | 32.9% | 2.0% | 2.4% | 2.6% |
Computer science | 183.9% | 338.7% | 3.0% | 8.9% | 12.9% |
Engineering, total | 10.6% | 45.7% | 19.4% | 22.5% | 27.7% |
Aeronautical | 0.0% | 0.0% | 0.0% | 0.0% | 0.0% |
Astronautical | 0.0% | 0.0% | 0.0% | 0.0% | 0.0% |
Chemical | 6.1% | −18.5% | 3.0% | 3.3% | 2.4% |
Civil | 6.1% | 26.8% | 0.9% | 1.0% | 1.2% |
Electrical | −48.1% | −35.9% | 1.3% | 0.7% | 0.8% |
Mechanical | −61.6% | −60.9% | 1.2% | 0.5% | 0.4% |
Metallurgy and materials | 279.6% | 343.1% | 1.9% | 7.7% | 8.4% |
Engineering, other | −21.1% | 33.0% | 11.1% | 9.2% | 14.5% |
Social sciences, total | −100.0% | −100.0% | 0.0% | 0.0% | 0.0% |
TABLE 4–4 Trends in NIH Support of Research by Field, 1993 to 1997, 1999 (constant dollars)
TABLE 4–5 Full-time Graduate Students Whose Primary Source of Support is the National Institutes of Health by Field, 1993–1999
| Change 1993–1999 | ||||||||
| 1993 | 1994 | 1995 | 1996 | 1997 | 1998 | 1999 | Number | Percent |
Engineering, total | 794 | 782 | 768 | 731 | 766 | 754 | 844 | 50 | 6.3% |
Aerospace | 5 | 5 | 1 | 0 | 3 | 3 | 3 | −2 | −40.0% |
Chemical | 119 | 143 | 136 | 148 | 121 | 111 | 127 | 8 | 6.7% |
Civil | 30 | 37 | 31 | 33 | 41 | 35 | 39 | 9 | 30.0% |
Electrical | 86 | 83 | 84 | 71 | 70 | 79 | 85 | −1 | −1.2% |
Mechanical | 70 | 71 | 82 | 63 | 70 | 71 | 87 | 17 | 24.3% |
Metallurgy/Materials | 10 | 13 | 11 | 7 | 9 | 5 | 6 | −4 | −40.0% |
Engineering, other* | 474 | 430 | 423 | 409 | 452 | 450 | 497 | 23 | 4.9% |
Sciences, total | 15,077 | 15,168 | 14,906 | 14,757 | 14,590 | 14,556 | 15,154 | 77 | 0.5% |
Physical sciences | 2,051 | 2,074 | 1,886 | 1,783 | 1,639 | 1,631 | 1,657 | −394 | −19.2% |
Earth, Atmos., Ocean. Sci. | 41 | 36 | 30 | 30 | 27 | 21 | 22 | −19 | −46.3% |
Mathematics | 74 | 68 | 63 | 61 | 66 | 68 | 78 | 4 | 5.4% |
Computer science | 99 | 95 | 93 | 80 | 78 | 75 | 64 | −35 | −35.4% |
Agricultural sciences | 32 | 47 | 19 | 17 | 21 | 15 | 17 | −15 | −46.9% |
Biological sciences | 11,314 | 11,464 | 11,400 | 11,302 | 11,299 | 11,304 | 11,774 | 460 | 4.1% |
Psychology | 1,163 | 1,098 | 1,094 | 1,218 | 1,198 | 1,226 | 1,275 | 112 | 9.6% |
Social sciences | 303 | 286 | 321 | 266 | 262 | 216 | 267 | −36 | −11.9% |
Health Fields, total | 2,266 | 2,345 | 2,437 | 2,444 | 2,731 | 2,828 | 3,012 | 746 | 32.9% |
Total | 18,137 | 18,295 | 18,111 | 17,932 | 18,087 | 18,138 | 19,010 | 873 | 4.8% |
*In 1999, there were 452 students in biomedical engineering whose primary source of support was NIH. They comprise 90 percent of the 497 “engineering, other” students in this table and 53 percent of all engineering graduate students whose primary source of support was NIH. SOURCE: NSF/SRS Survey of Graduate Students and Postdoctorates in Science and Engineering, Fall 1999. | |||||||||
TABLE 4–6 Trends in NSF Support of Research by Field, 1993 to 1997, 1999 (constant dollars)
| Percent change | Share of total | |||
| 1993–1997 | 1993–1999 | 1993 | 1997 | 1999 |
Total, all fields | 10.1% | 19.3% | 100.0% | 100.0% | 100.0% |
Life sciences, total | 1.6% | 22.7% | 15.9% | 14.7% | 16.4% |
Biol (excl. environmental) | 3.3% | 26.3% | 11.4% | 10.7% | 12.1% |
Environmental biology | 8.1% | 26.6% | 4.1% | 4.0% | 4.3% |
Agricultural sciences | 0.0% | 0.0% | 0.0% | 0.0% | 0.0% |
Medical sciences | 0.0% | 0.0% | 0.0% | 0.0% | 0.0% |
Psychology, total | −66.2% | −73.3% | 0.8% | 0.2% | 0.2% |
Physical sciences, total | −6.1% | 0.7% | 24.9% | 21.3% | 21.0% |
Astronomy | −3.2% | 1.6% | 5.8% | 5.1% | 5.0% |
Chemistry | −2.3% | 5.8% | 6.5% | 5.7% | 5.7% |
Physics | −27.1% | −4.7% | 8.6% | 5.7% | 6.9% |
Environmental sciences, total | 1.8% | 9.8% | 21.4% | 19.8% | 19.7% |
Atmospheric sciences | −6.8% | 10.2% | 6.8% | 5.8% | 6.3% |
Geological sciences | −32.8% | −28.4% | 7.3% | 4.4% | 4.4% |
Oceanography | 136.2% | 145.3% | 4.1% | 8.9% | 8.5% |
Math and computer science, total | 42.4% | 60.8% | 11.5% | 14.8% | 15.5% |
Mathematics | 2.0% | −2.6% | 4.4% | 4.1% | 3.6% |
Computer science | 75.2% | 109.5% | 6.7% | 10.7% | 11.9% |
Engineering, total | 67.9% | 66.2% | 12.9% | 19.7% | 18.0% |
Aeronautical | −100.0% | −100.0% | 0.2% | 0.0% | 0.0% |
Astronautical | 0.0% | 0.0% | 0.0% | 0.0% | 0.0% |
Chemical | −7.6% | −4.1% | 2.1% | 1.7% | 1.7% |
Civil | 20.9% | 22.9% | 1.5% | 1.7% | 1.6% |
Electrical | −35.1% | −30.0% | 3.2% | 1.9% | 1.9% |
Mechanical | −80.5% | −81.7% | 1.8% | 0.3% | 0.3% |
Metallurgy and materials | 361.3% | 369.7% | 1.1% | 4.8% | 4.5% |
Engineering, other | 245.1% | 226.0% | 3.0% | 9.3% | 8.1% |
Social sciences, total | 42.8% | 72.5% | 3.0% | 3.9% | 4.4% |
TABLE 4–7 Full-time Graduate Students Whose Primary Source of Support is the National Science Foundation by Field, 1993–1999
| Change 1993–1999 | ||||||||
| 1993 | 1994 | 1995 | 1996 | 1997 | 1998 | 1999 | Number | Percent |
Engineering, total | 4,559 | 4,763 | 4,579 | 4,591 | 4,611 | 4,719 | 4,959 | 400 | 8.8% |
Aerospace | 158 | 139 | 121 | 101 | 109 | 112 | 98 | −60 | −38.0% |
Chemical | 730 | 749 | 759 | 111 | 708 | 756 | 744 | 14 | 1.9% |
Civil | 522 | 587 | 530 | 534 | 529 | 544 | 544 | 22 | 4.2% |
Electrical | 1,283 | 1,342 | 1,324 | 1,317 | 1,344 | 1,304 | 1,477 | 194 | 15.1% |
Mechanical | 812 | 800 | 743 | 770 | 841 | 908 | 886 | 74 | 9.1% |
Metallurgy/Materials | 459 | 505 | 495 | 504 | 514 | 501 | 520 | 61 | 13.3% |
Engineering, other | 595 | 641 | 607 | 588 | 566 | 594 | 690 | 95 | 16.0% |
Sciences, Total | 8,882 | 9,110 | 8,982 | 8,739 | 8,653 | 8,622 | 8,769 | −113 | −1.3% |
Physical sciences | 3,623 | 3,703 | 3,601 | 3,385 | 3,372 | 3,318 | 3,278 | −345 | −9.5% |
Earth, Atmos., Ocean Sci. | 1,366 | 1,409 | 1,387 | 1,242 | 1,201 | 1,122 | 1,128 | −238 | −17.4% |
Mathematics | 470 | 518 | 474 | 435 | 386 | 384 | 441 | −29 | −6.2% |
Computer science | 1,006 | 1,047 | 1,054 | 1,051 | 1,087 | 1,171 | 1,309 | 303 | 30.1% |
Agricultural sciences | 76 | 87 | 92 | 97 | 102 | 91 | 107 | 31 | 40.8% |
Biological sciences | 1,382 | 1,382 | 1,411 | 1,494 | 1,541 | 1,544 | 1,504 | 122 | 8.8% |
Psychology | 314 | 289 | 288 | 289 | 211 | 283 | 310 | −4 | −1.3% |
Social sciences | 645 | 675 | 675 | 746 | 687 | 709 | 692 | 47 | 7.3% |
Health Fields, total | 89 | 117 | 100 | 82 | 98 | 118 | 121 | 32 | 36.0% |
Total | 13,530 | 13,990 | 13,661 | 13,412 | 13,362 | 13,459 | 13,849 | 319 | 2.4% |
SOURCE: NSF/SRS Survey of Graduate Students and Postdoctorates in Science and Engineering, Fall 1999. | |||||||||


