Trends in Federal Support of Research and Graduate Education (2001)
Chapter: 3 Field Trends in Graduate Education Support
3
Field Trends in Graduate Education Support
Since World War II, graduate education in science and engineering in the United States has been closely linked to university-based research.1 Trends in federal obligations for university research directly affect graduate enrollment because research funding supports graduate research assistantships. Moreover, trends in federal obligations for university-based research also indirectly affect graduate enrollment by shaping the job market in given research fields. Students become aware of whether research funding opportunities in a field, and therefore academic job prospects, are increasing or decreasing and choose fields of study at least in part based on those prospects.
Yet there are many other factors that influence enrollment in graduate education programs. The flow of students through secondary school science and mathematics courses and undergraduate science and engineering majors determines the number of domestic students qualified to pursue graduate degrees in science and engineering. Higher education institutions may allocate funding, including graduate student assistance, to sustain competence in research and training in a wide range of fields. And investigators have a variety of options for staffing their laboratories—not only graduate student assistants and students on fellowships and traineeships but also postdoctoral fellows, non-faculty research scientists, and trained labora-tory technicians. In part this is an economic decision, and in some fields such as the biological sciences the number of recent Ph.D.’s available for postdoctoral fellowships at costs similar to those of graduate research assistants has increased in recent years.
Student preferences, influenced by the intrinsic interest of particular subjects, perceived job opportunities, and other factors, also affect graduate enrollment trends. Federal research funding plays a role in this equation by affecting the prospects for future academic employment of Ph.D.’s. Nevertheless, an increasing majority of students in science and engineering—many of whom will leave school with master’s degrees rather than doctorates—eventually pursue careers outside of academia. In the latter half of the 1990s an important factor in the job market for people with advanced technical training was the high demand on the part of industry as well as the public and non-profit sectors for expertise in information technology (IT). The tight job market for IT workers contributed to rising salaries and other compensation that attracted students to computer science and engineering, perhaps away from other fields, and lured other students out of graduate school altogether or away from completing any advanced degree or progressing from a master’s degree to a Ph.D. program.2
As the most highly regarded system for advanced technical training in the world, U.S. science and engineering graduate education attracts large number of students
from abroad.3 Trends in the enrollment of foreign graduate students—a substantial portion of students in many fields and a majority in some—are also affected by many factors, including home country political conditions and employment and training opportunities, the availability of home country financial support for graduate education abroad, and opportunities for permanent residence and eventual employment in the United States.
While acknowledging that a host of factors influences trends in graduate enrollment in different disciplines, this chapter seeks to relate trends in federal obligations for university research to graduate enrollments in subfields of science, engineering, and health, and to anticipate what recent increases and reductions in research support mean for the production of people with advanced technical degrees. To the extent that graduate enrollment is affected by changes in research funding, changes in enrollment should appear within a year or two. Analyzing trends in awarded doctoral degrees is more complicated because of the substantial time lag between initial enrollment and completion of Ph.D. degree requirements—on average between 6.6 and 7.5 years in the natural sciences, engineering, and social sciences.4 Thus, it may take 7 years for enrollment increases in a field to show up in doctoral award data, although the effect of declining enrollment on doctorates may show up earlier as students drop out of degree programs or switch fields.
The analysis that follows draws principally on data from the National Science Foundation’s Survey of Graduate Students and Postdoctorates in Science and Engineering (GSPSE), which allows us to examine trends in graduate enrollment by field, by mechanism of support (i.e., research assistantship, teaching assistantship, traineeship or fellowship) and by source of support (i.e., federal government agency, nonfederal sources, institutional support, and self-support). Federal support is in the form of research assistantships, fellowships, and traineeships. Research assistantships (RAships) now account for a large majority of students with federal support in most fields except for the medical sciences, where traineeships and fellowships are the dominant mode of government support. RAships are typically the only form of federal government support for which non-U.S. citizens are eligible. Self-support includes loans (including federal loans), personal and family contributions, and foreign government grants for foreign nationals’ study in the United States. The analysis also draws on data gathered on doctorate awards by field for U.S. and non-U.S. citizens from the Survey of Earned Doctorates (SED). The field classification used in both surveys is similar but not identical to the classification of research fields used in the Federal Funds Survey and in Chapter II. Here aeronautical and astronautical engineering are combined as “aerospace engineering.” Environmental biology is combined with biological sciences, and “health sciences” encompasses most of the clinical fields that comprise “medical sciences.”5
In general we find a high but not perfect correlation between declining research funding in the mid-1990s and declining graduate student enrollment and Ph.D. production through 1999.6 Fields that experienced increasing federal research support show a mixed pattern of enrollment and Ph.D. output. The anomalies—fields with rising research funding and declining enrollment (aeronautical, astronautical, chemical, civil, and materials engineering; astronomy, agricultural sciences, atmospheric and ocean sciences and psychology)7 —underscore that there are other factors at work and demonstrate the complexity of any causal analysis or, to the extent that the decreases are of concern, of any attempt to boost enrollment and Ph.D. awards.
The data may be misleading in one respect. Although the role of federally funded research assistantships, fellowships, and traineeships varies greatly among fields, in general less than one-third of graduate students are reported to be supported principally by federal funds and in some cases—e.g., much of engineering, computer science, and agriculture—the share is closer to 20 percent. This might lead one to conclude that federal research funding is a relatively small factor in enrollment trends. Yet the data on sources of support reflect students’ principal funding at a snapshot in time. Over the typical 6 to 7 year graduate education career leading to the Ph.D., students are likely to receive support from different sources. Thus, the proportion of students who during their tenure receive some support from federal research grants and contracts is undoubtedly higher than one third. Moreover, the availability of research assistantships enables institutions to allocate resources to other purposes and thus has powerful indirect effects on enrollment and institutional operations generally.
3 | William G.Bowen and Neil L.Rudenstine. 1992. In Pursuit of the Ph.D., Princeton, N.J.: Princeton University Press. National Academy of Sciences, National Academy of Engineering, and Institute of Medicine, Committee on Science, Engineering, and Public Policy. 1995. Reshaping the Graduate Education of Scientists and Engineers, Washington, D.C.: National Academy Press. |
4 | Allen R.Sanderson, Bernard L.Guoni, et al. 2000. Doctorate Recipients from United States Universities: Summary Report, 1999, pp. 54. Chicago: National Opinion Research Center. |
5 | See Appendix. |
6 | The decline in graduate enrollment in science and engineering is not explained by an overall decline in the number of students graduating from U.S. institutions with appropriate bachelor’s degrees. In fact, that number increased by 12.9 percent from 1992 to 1997, the last year for which NSF data are available, although there may have been declines in bachelor’s degrees in certain fields and in certain years during the decade. |
7 | Of these ten fields, four had declining research funding through 1997. There are no cases of declining research funding and rising enrollments. |
PHYSICAL, ENVIRONMENTAL, AND MATHEMATICAL SCIENCES
Federal funding for physical, environmental, and mathematical sciences declined for most, though not all, fields from 1993 to 1999. In a number of these fields, including three cases where federal research funding actually increased, there is a uniform pattern of decline in graduate student enrollment in the 1990s. The drop in the number of students whose primary source of support was the federal government was larger than the overall decline in numbers of graduate students. The number of students with federally funded graduate research assistantships declined in each case, although typically by smaller percentages than the numbers of students with other kinds of federal support (e.g., fellowships and traineeships).
Federal funding for university physics research declined by 7.4 percent from 1993 to 1999. During this period, the number of full-time physics graduate students declined steadily and substantially, by 22.1 percent (Figure 3–1). Federally supported graduate students declined by 22.6 percent and federally supported graduate research assistants (RAs) declined by 20.8 percent. The average annual decrease for federally supported physics graduate students was 4.2 percent and for those with nonfederal funding was 4.0 percent.
In 1999, federal funding for university chemistry (Figure 3–2) was 2.0 percent lower than in 1993. During this period, the number of full-time chemistry graduate students declined by 7.2 percent, federally supported graduate students declined 13.2 percent, and federally supported RAs declined by 7.9 percent. The average annual decline in federally supported graduate students was 2.3 percent and in those with nonfederal funding was 0.7 percent.
By contrast, federal funding for university astronomy research increased by 46.9 percent from 1993 to 1999 (Figure 3–3). Full-time graduate enrollment in astronomy nevertheless dropped 4.7 percent during this period. This was largely due to a decrease of 7.6 percent in the number of graduate students supported by the federal government. The number of federally supported RAs declined slightly by 1.2 percent. The average annual decline in federally supported graduate students was 1.3 percent. The average annual decline in those with nonfederal funding was negligible.
Federal funding for university research in mathematical sciences declined by 13.5 percent from 1993 to 1999 (Figure 3–4). The number of full-time mathematics graduate students declined by 18.8 percent and the number of mathematics graduate students with federal support declined by 25.1 percent in the same period. Federally supported RAs in mathematics decreased by 19.3 percent. The average annual decline in federally supported graduate students was 4.7 percent and among those whose primary
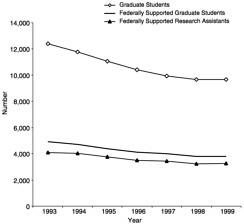
FIGURE 3–1 Full-time graduate enrollment in physics, 1993–1999.
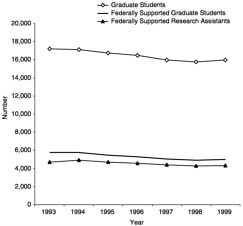
FIGURE 3–2 Full-time graduate enrollment in chemistry, 1993–1999.


support was from a nonfederal source the average decrease was 3.3 percent.
Federal funding for university research in geology decreased sharply, by 31.6 percent, from 1993 to 1999 (Figure 3–5). The number of full-time graduate students in the geosciences decreased by 12.2 percent and those who were federally supported decreased by 23.3 percent during this period. Federally supported RAs decreased by a similar margin of 22.3 percent. The average annual decline in federally supported graduate students was 4.3 percent and in those whose primary support was from a nonfederal source was 1.4 percent.
Federal funding for atmospheric research in universities increased by 13.7 percent from 1993 to 1999 (Figure 3–6). Full-time graduate enrollment in atmospheric sciences nevertheless decreased 19.1 percent during this period and federally supported graduate students decreased by 23.7 percent. Federally supported RAs decreased by a similar margin of 21.4 percent. The average annual decline in federally supported graduate students was 4.4 percent and among those whose primary support was from a nonfederal source the decline was 1.8 percent.
Federal funding for university research in oceanography increased by 46.9 percent from 1993 to 1999 (Figure 3–7). Full-time graduate enrollment in ocean sciences decreased by 2.2 percent during this period anyway and federally supported graduate students declined by 10.1 percent. Federally supported RAs were down by 8.9 percent. The average annual decrease in graduate students with federal support was 1.8 percent and for those with nonfederal funding was 0.8 percent.
Institutions may have stepped in to pick up support of students in the pipeline who previously received federal support. This may account for the slower decline in graduate enrollment supported by nonfederal funds. Institutional support of graduate students in the geological and atmospheric sciences actually increased from 1993 to 1999.
At the same time the number of self-supported students in these fields declined even more rapidly than the numbers receiving federal support, suggesting that students do not readily invest their resources in fields that are not growing. The exception was ocean sciences, a field with rising federal research expenditures, an increase in self-supporting students, and a drop in students with institutional support.
ENGINEERING
It is more difficult to generalize about trends in engineering fields. Changes in federal funding for university research between 1993 and 1999 range from large gains to flat funding to deep cuts. Nevertheless, full-time graduate enrollment in every engineering field is down. In two cases—aerospace and civil engineering—graduate students with federal support declined more rapidly than other
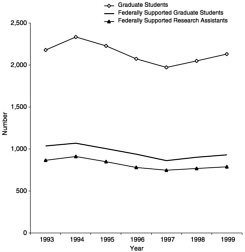
FIGURE 3–7 Full-time graduate enrollment in ocean sciences, 1993–1999.
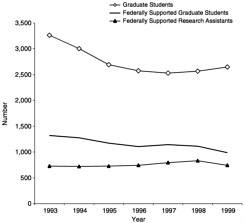
FIGURE 3–8 Full-time graduate enrollment in aerospace engineering, 1993–1999.
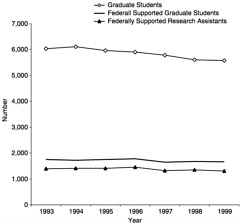
FIGURE 3–9 Full-time graduate enrollment in chemical engineering, 1993–1999.
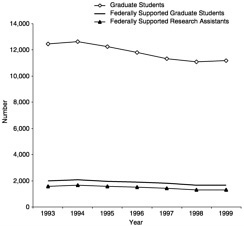
FIGURE 3–10 Full-time graduate enrollment in civil engineering, 1993–1999.
categories, but the reverse was the case in other fields. Overall, the number of engineering graduate students with institutional support has increased very slightly, but the number of self-supported students has dropped precipitously. The drop in self-supported students accounts for almost 85 percent of the overall enrollment decline in engineering.
Federal funding for aeronautical engineering research in universities is 24.5 percent higher in 1999 relative to 1993 and for astronautical research it is 79.5 percent higher in 1999. But these gains were the result of a late turnaround, from 1998 to 1999. Earlier research funding was down significantly from 1993. The downward trend in full-time graduate enrollment in aerospace engineering of 18.9 percent from 1993 to 1999 is consistent with the deep cuts in spending in the early part of this period (Figure 3–8). Moreover, the number of graduate students in this field who are federally supported dropped by 25.5 percent during this period. On the other hand, the number of federally supported RAs in aerospace engineering increased by 2.2 percent during this period, increasing from 55 to 75 percent of federally supported students over this period. The average annual decline in federally supported graduate students was 4.8 percent and in those whose primary support was from a nonfederal source was 2.6 percent.
Federal funding for university research in chemical engineering was also down from 1993 to 1997, by 11.6 percent, before increasing in 1998 and 1999. Funding in 1999 is up 2.2 percent from 1993 (Figure 3–9). During this period, the number of full-time graduate students in the field declined by 7.8 percent. The number of graduate students with federal support declined by 5.2 percent and the number of federally supported RAs declined 6.3 percent. Federally supported graduate students had an average annual decline of 0.9 percent, while those with nonfederal support declined 1.5 percent annually.
Federal funding for university research in civil engineering increased by 6.4 percent from 1993 to 1999, but full-time graduate enrollment fell by 10.3 percent during this period (Figure 3–10). Federally supported graduate students decreased by 15.6 percent and federally supported RAs by 17.2 percent. RAs supported by nonfederal sources increased 13.0 percent generating an overall increase in civil engineering RAs. The average annual decrease in the number of federally supported graduate students was 2.8 percent and that for those with nonfederal support declined 1.6 percent annually.
By contrast, full-time graduate enrollment in electrical engineering declined by only 0.6 percent from 1993 to 1999, despite a decrease of 12.0 percent in federal funding for university research in this field (Figure 3–11). Indeed, the number of full-time graduate students with federal support increased by 12.3 percent during this period, largely due to an increase of 15.1 percent in the number of
graduate students in electrical engineering supported by NSF. Federally supported RAs increased 33.6 percent. Institutional support increased 5.8 percent, but students who are self-supporting decreased 15.9 percent. The average annual change in federally supported students was 2.0 percent and for nonfederally supported students −0.7 percent.
Mechanical engineering has experienced declines in both funding and enrollment (Figure 3–12). Federal funding of university research in this field decreased more than 40 percent from 1993 to 1999. Full-time graduate enrollment decreased 16.6 percent. Despite an increase of 9.1 percent in the number of graduate students with support from NSF, the total number of graduate students with federal support declined 13.4 percent during this period and federally supported RAs decreased 8.7 percent. Students with institutional support declined 4.6 percent. Students supporting themselves declined 41.8 percent. The average annual decrease in the number of federally supported graduate students was 2.4 percent and that for those with nonfederal support declined 3.2 percent annually.
Federal funding for university-based research in metallurgical and materials engineering increased 7.7 percent from 1993 to 1999 (Figure 3–13). Nonetheless, both full-time graduate enrollment and federally supported graduate enrollment in the field decreased 16.8 percent during this period, an average annual decrease of 3.0 percent. Federally supported RAs were down 13.7 percent.
Graduate students in other engineering fields not represented in the survey of federal research obligations—agricultural, biomedical, industrial, mining, nuclear, and petroleum engineering and engineering science and phys-ics—make up about 20 percent of full-time graduate enrollment in engineering. The number of students in these fields decreased 4.5 percent from 1993 to 1999, at an average annual rate of −0.8 percent. Federally supported graduate students were down 2.3 percent and federally supported RAs were down 2.4 percent.
COMPUTER SCIENCE
In the computer sciences, both federal funding for university research and full-time graduate enrollment are increasing rapidly. The number of students with nonfederal support, however, is growing faster than the number with federal support, as seen in Figure 3–14. Federal funding for university research in computer science grew by 34.3 percent from 1993 to 1999. During this period, the number of full-time graduate students in computer science whose primary source of support is the federal government grew by 15.1 percent (annual average of 2.4 percent), whereas, the number whose main source of support was nonfederal grew 33.6 percent (annual average growth of 4.9 percent) (Figure 3–14). The number of federally supported research assistants grew 15.6 percent and the number of research
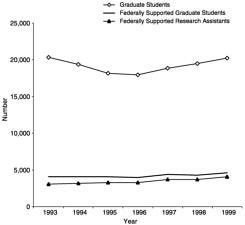
FIGURE 3–11 Full-time graduate enrollment in electrical engineering, 1993–1999.
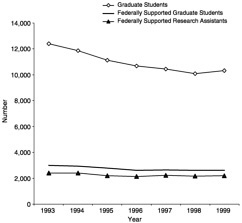
FIGURE 3–12 Full-time graduate enrollment in mechanical engineering, 1993–1999.
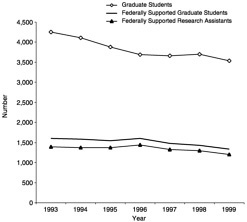
FIGURE 3–13 Full-time graduate enrollment in metallurgical and materials engineering, 1993–1999.
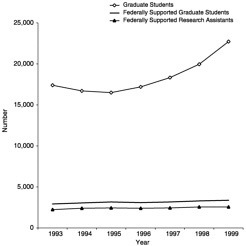
FIGURE 3–14 Full-time graduate enrollment in computer science, 1993–1999.
assistants supported by other sources of funding grew 47.3 percent. That the number of institutionally supported graduate students grew 25.8 percent and the number of self-supporting students increased 34.3 percent in the 1990s is probably a testament to how promising these fields were or were perceived to be in terms of employment opportunities by both institutions and individuals.
LIFE SCIENCES
Although funding for university research in the life sciences increased from 1993 to 1999, graduate enrollment changes differed significantly among subfields. In agricultural sciences the number of graduate students fell. In biological sciences enrollment grew only modestly, while in medical sciences enrollment grew at an even faster rate than the growth in research spending.
Federal funding for university agricultural sciences research increased 21.7 percent from 1993 to 1999 (Figure 3–15). Despite this increase in research obligations, the number of full-time graduate students in the agricultural sciences decreased 2.9 percent and the number of federally supported graduate students decreased 2.7 percent during this period. Federally supported RAs decreased 4.1 percent. The average annual decrease in the number of both federally and nonfederally supported graduate students was 0.5 percent.
Given that federal funding for university research in the biological sciences increased 39.9 percent from 1993 to 1999, it is somewhat surprising that graduate enrollment in the biological sciences has grown only modestly during this time (Figure 3–16). Total graduate enrollment in the biological sciences grew only 1.7 percent and the number of graduate students supported by federal funds grew only 2.0 percent, an average annual change of 0.3 percent. The number of federally supported RAs actually dropped 4.5 percent during this period. It is important to note, however, that the number of postdoctorates in the biological sciences increased 15.4 percent. This trend is consistent with anecdotal evidence that the troubled job market in the biological sciences not only dampens potential growth in graduate enrollment but also funnels recent Ph.D.’s into a series of postdoctoral appointments.
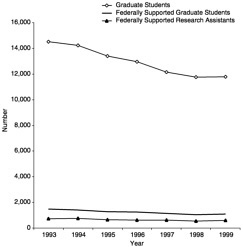
Meanwhile federal support for university research in the medical sciences increased 20.5 percent from 1993 to 1999 and graduate enrollment in health fields increased 41.5 percent during this time (Figure 3–17). Those who were supported by federal sources grew just 14.1 percent, an average annual increase of 2.2 percent, but a disproportionate share of the additional students supported by the federal government were RAs. Federally supported RAs grew 39.7 percent. Still, the number of students supported by nonfederal sources increased 48.5 percent, an average annual increase of 6.8 percent. As with computer science,
the number of students whose primary source of support was institutional support grew 33.8 percent and the number who were self-supporting increased by an extraordinary 56.3 percent. Again, this trend is probably attributable to perceived growth and superior career opportunities in these fields.
SOCIAL AND BEHAVIORAL SCIENCES
Federal funding for university research in the social and behavioral sciences declined after 1993, turning up again in only the last few years. The upturn in university-based social science research appears not to have affected graduate enrollment trends yet. The upturn in federal—especially NIH—funding for university psychology research may have helped lift enrollments in that field.
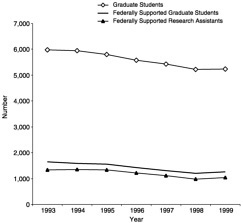
Although federal funding for university research in the social sciences was up in 1999 over 1998, it was still 4.0 percent lower than in 1993 (Figure 3–18). In 1998, funding for university research had been 20.3 percent lower than in 1993. Graduate enrollment in the social sciences decreased 4.2 percent from 1993 to 1999 and the number of federally supported graduate students decreased 10.2 percent, an average annual decline of 1.8 percent. Federally supported RAs dropped about 1.7 percent per annum.
Federal funding of university-based psychology research, boosted by increases from NIH, was up 1.5 percent from 1993 to 1999 (Figure 3–19). Such funding of basic psychology research in universities, however, was 20.3 percent higher in 1999 than 1993. Federal funding may have made much of the difference in graduate enrollment in psychology. Federally supported graduate students in psychology were up 22.7 percent, an average annual increase of 3.5 percent. Students supported by nonfederal sources decreased by 2.1 percent, an average annual decline of 0.4 percent. Thus, overall, graduate enrollment in psychology was down 0.2 percent from 1993 to 1999. It is interesting to note that trends in number of RAs were reversed. Federally supported RAs were down 7.0 percent, while nonfederally supported RAs increased by 11.5 percent.
RECENT TRENDS IN DOCTORAL AWARDS
To supplement trends in graduate enrollment, it is useful to examine trends in the number of new doctorates by field during the period 1993 to 1999. Analyzing the trends in doctoral degrees awarded is somewhat more complicated because of the time lag between enrollment and degree award, which is often seven or more years. Thus, it may take 7 years for enrollment increases in a field to show up in doctoral award data, though the effect of enrollment decreases on doctoral degrees awarded may show up much sooner as students drop out of degree

FIGURE 3–15 Full-time graduate enrollment in agricultural sciences, 1993–1999.
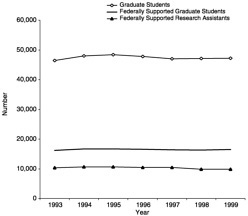
FIGURE 3–16 Full-time graduate enrollment in biological sciences, 1993–1999.
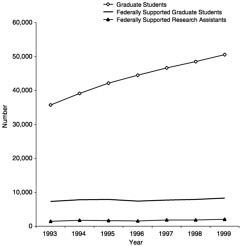
FIGURE 3–17 Full-time graduate enrollment in health fields, 1993–1999.
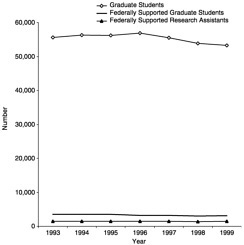
FIGURE 3–18 Full-time graduate enrollment in social sciences, 1993–1999.
programs or switch fields. Indeed, the data shown below reveal that fields in which federal funding for R&D decreased from 1993 to 1997 almost universally had decreases in doctoral awards from 1993 to 1999. Fields with increases in federal funding from 1993 to 1997, however, had mixed results in doctoral awards, which may be accounted for, in part, by time to degree for Ph.D.’s.
During this period the number of individuals earning science and engineering doctorates from U.S. institutions peaked at 27,309 in 1998 and then declined by 5.0 percent from 1998 to 1999. There are, however, important differences in trends by field that correspond to trends in federal funding for university research and graduate education. Moreover, there are important differences in trends for U.S. and non-U.S. citizens that contribute to overall trends. For engineering fields, the number of new doctorates was 6.3 percent lower in 1999 than in 1993. As seen in Table 3–1, the decreases in new Ph.D.’s were seen across almost all engineering fields. The one exception to this trend was “other” engineering in which new doctorates increased 12.2 percent from 1993 to 1999.
There were key differences in trends among new engineering doctorates by citizenship status. While the number of new U.S. citizen engineering doctorates was down by 3.6 percent in 1999 compared to 1998, it was nevertheless up by 11.0 percent in 1999 compared to 1993. Here there were major differences by field. From 1993 to 1999, new U.S. doctorates increased 54.2 percent in civil engineering, 32.6 percent in “other” engineering, and 14.1 percent in mechanical engineering. In the same period, new U.S. doctorates declined 9.6 percent in aeronautical/astronautical engineering, 3.4 percent in industrial engineering, and 2.2 percent in metallurgical and materials engineering. By contrast, the number of new non-U.S. citizen engineering doctorates was down over 20 percent from 1993 to 1999 and this drop occurred across engineering fields. The largest numerical and percentage drop from 1993 to 1999 was in mechanical engineering (−34.9 percent). There was also a major drop of 30.8 percent in non-U.S. citizens earning civil engineering Ph.D.’s.
For science fields, the story is somewhat different. The number of new doctorates in the sciences decreased 3.6 percent from 1998 to 1999, but the number in 1999 was still 4.4 percent higher than in 1993. This masks important differences by field. From 1993 to 1999, the number of new Ph.D.’s decreased 9.1 percent in physics, 5.3 percent in mathematics, and 3.4 percent in computer science. Meanwhile, there were increases in astronomy (10.3 percent), biological sciences (10.0 percent), social sciences (7.7 percent), psychology (7.2 percent), and earth, atmospheric, and ocean sciences (4.7 percent).
For U.S. citizens, trends in new doctorates are generally in the same direction as for all new Ph.D.’s. The one exception is in mathematics where the number of U.S.
citizen Ph.D.’s is 8.5 percent higher in 1999 compared to 1993, while the overall number of Ph.D.’s in that field has decreased by 5.3 percent. For non-U.S. citizens, trends in new doctorate recipients are in the same direction as for Ph.D.’s overall, although the changes are pronounced. For example, non-U.S. citizens earning physics Ph.D.’s decreased 16.3 percent from 1993 to 1999 compared with an overall decline of 9.1 percent and non-U.S. citizens earning mathematics Ph.D.’s decreased 16.4 percent from 1993 to 1999 compared to an overall decrease of 5.3 percent. Similarly, non-U.S. citizens earning biological sciences Ph.D. have increased 13.0 percent from 1993 to 1999 compared to an overall increase of 10.0 percent. There is a similar trend for health fields, in which non-U.S. citizens earning doctorates increased 32.8 percent from 1993 to 1999 compared to a 17.8 percent increase in all doctorates in health fields.
Trends for non-U.S. citizen Ph.D.’s have clearly affected overall trends in the number of new Ph.D.’s. The drop in non-U.S. citizens earning Ph.D.’s from 1993 to 1999 accounts for much or all of the overall decline in physics, mathematics, computer science, and nearly every engineering field that experienced a decrease in Ph.D.’s. Non-U.S. citizens also account for a significant share of the increase in such fields as astronomy, earth, atmospheric, and ocean sciences, biological sciences, and health fields. Fields that do not fit this pattern are agricultural sciences, in which non-U.S. citizen Ph.D.’s increased while overall Ph.D.’s decreased, and psychology and social sciences, in which non-U.S. citizen Ph.D.’s decreased despite substantial overall increases in new Ph.D.’s.
TRENDS ACROSS FIELDS
The data in Table 3–1, summarizing data in federal funding for university research, full-time graduate enrollment, and doctorate recipients from 1993 to 1999, reveal two divergent patterns among science and engineering fields. First, fields in which federal funding for university research was down from 1993 to 1997 have almost all had declines in both graduate enrollments and doctorate recipients from 1993 to 1999. Second, fields with increasing federal funding for university research have a range of divergent trends in graduate enrollment and doctorate production.
Fields With Decreased Federal Funding
Seven fields experienced substantial cuts in both federal funding for university research from 1993 to 1997 and full-time graduate enrollment from 1993 to 1999—mechanical engineering, aerospace engineering, chemical engineering, mathematics, physics, chemistry, and social sciences.
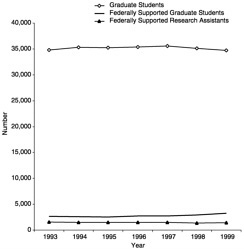
FIGURE 3–19 Full-time graduate enrollment in psychology, 1993–1999.
These fields have had cuts in federal funding for university research ranging from 9.7 percent to 40.2 percent from 1993 to 1997 and the majority of them are still substantially below their 1993 funding levels in 1999. These fields have also experienced decreases in full-time graduate students, graduate students who are supported by the federal government, and graduate research assistants supported by the federal government. The declines in federally supported RAs have typically not been as deep as for all students who are federally supported.
Electrical engineering and psychology are exceptions. Electrical engineering also had deep cuts in federal funding for university research (31.1 percent from 1993 to 1997 and was still down 12.0 percent by 1999), but had only a very minor drop in graduate enrollment from 1993 to 1999 of 0.6 percent. Moreover, federally supported graduate students increased 12.3 percent and federally supported RAs, in particular, increased 33.6 percent. As noted above, this increase in federally supported graduate students in electrical engineering can be accounted for in large part by a 15.1 percent increase in graduate students whose primary source of support is NSF. Psychology meanwhile had a decrease of 9.2 percent in federal funding for university research from 1993 to 1997, but recent increases in federal funding resulted in an overall increase of 1.5 percent from 1993 to 1999. Perhaps because of the recent increase, the field had almost no change in graduate enrollment and a substantial increase in federally supported graduate students.
The number of doctorate awards from 1993 to 1999 was also generally down for these seven fields by 0.1 to 17.2 percent, although there were divergent trends for U.S. and non-U.S. citizens. For seven of these eight fields, doctorate awards decreased between 0.1 and 17.2 percent during this time. The exception to this trend was the social sciences, a field less dependent on federal research dollars, which experienced a 7.7 percent increase during this period. There were, however, differences among the seven fields based on citizenship status. Non-U.S. Ph.D.-earners declined across all nine fields, from 3.7 to 34.9 percent, accounting for most or all of the decline in doctorates awarded. U.S. citizens earning Ph.D.’s, by contrast, have increased for six of the nine fields and declined in only three.
Federal funding for university research may have played a key role in determining graduate enrollment patterns for most of these fields, particularly in engineering and the physical sciences, but institutions and students also played an important role. Students with institutional support in these fields also generally declined in number from 1993 to 1999 but not as rapidly as the number of students with federal support. The number of self-supported students in these fields, however, has generally declined even more sharply than the number supported by federal funding. This suggests that students do not invest their own funds in fields that are not perceived as growing. In effect, institutions may act to mitigate the effects of cuts in federal research funding, but students may work to further ratify federal cuts by opting for training in growth fields.
Fields With Increased Federal Funding
Compared to the clear downward direction in graduate enrollments and new doctorates for fields with decreased federal funding for university research, the direction of change in graduate students and doctorates in those fields with increased federal funding for university research in both 1997 and 1999 relative to 1993 is highly varied. This variability suggests that many factors in addition to federal funding play a role in determining trends in graduate enrollment and doctorates in these fields.
In only two fields with increased federal funding, health and biological sciences, have graduate enrollments and doctorate awards increased from 1993 to 1999 but even here there are other factors at play. Funding for research in the medical sciences is up 20.5 percent, graduate enrollment in the field has increased 41.5 percent, and doctorates are up 17.8 percent. Federally funded graduate students, however, have increased only 14.1 percent, while self-supporting students have increased 54 percent during this period suggesting that when a field is perceived as growing it attracts not only research funding but also students. Funding in the biological sciences is up even more, at 39.9 percent. Yet, while graduate enrollment grew, it was up only 1.7 percent and federally funded research assistants decreased 4.5 percent. Here, it appears, faculties have relied principally on postdoctorates (up 15.4 percent from 1993 to 1999 in this field) rather than graduate students to staff their laboratories.
The remaining fields exhibit a wide array of trends, influenced by various factors including the industrial job market. In computer science, graduate enrollment is up, but doctorate awards are down, reflecting the strong pull of the late 1990s information technology (IT) job market away from completing a Ph.D. degree. In astronomy and earth, atmospheric, and ocean sciences, by contrast, graduate enrollment was down but doctorate awards were up. The agricultural sciences, chemical engineering, and metallurgical and materials engineering had declining enrollments and doctorate awards, suggesting that these fields are having trouble attracting students even when funding increases. There were increases in non-U.S. citizens earning Ph.D.’s in agricultural sciences and in U.S. citizens earning Ph.D.’s in chemical engineering. Finally, psychology, which had only a modest increase in federal research funding from 1993 to 1999, had a substantial increase in federally supported graduate students and a modest increase in doctorates due to increased support from NIH.
Doctorate Awards
Trends in the number of non-U.S. citizens earning Ph.D.’s tend to mirror trends in federal funding for university research. The decrease in non-U.S. citizens earning Ph.D.’s in fields with decreased federal funding accounts for much or all of the overall decrease in doctorate awards in these fields. Meanwhile, in four of the five fields with both increased federal funding and increased numbers of doctorates—astronomy, biological sciences, medical sciences (health fields), and earth, atmospheric, and ocean sciences—the rate of growth among non-U.S. citizens has been far higher than the rate of growth among U.S. citizens.
The exception to this trend may prove the rule. In psychology, the number of U.S. citizens earning doctorates has increased 2.9 percent and the number of non-U.S. citizens has decreased 6.3 percent. Since federally supported graduate students have increased while federally supported research assistants has decreased, this suggests that the increase in federal support to graduate students has been provided in the form of traineeships. While both U.S. and non-U.S. citizens may be supported on research assistantships, only U.S. citizens are eligible to receive traineeships.
ANNEX
TABLE 3–1 Percent Change in Federal Funding for University Research, Full-time Graduate Enrollment, and Doctorate Degrees Awarded, by field, 1993–1999
| Percent Change in Federal Funding for University Research | Percent Change in Full-time Graduate Enrollment, 1993–1999 | Percent Change in Ph.D.’s, 1993–1999 | |||||
| 1993–1997 | 1993–1999 | Total | Total students federally supported | Federally supported research assistants | Total | U.S. Citizens | Non-U.S. Citizens |
Mechanical engineering | −40.2% | −40.5% | −16.6 | −13.4 | −8.7 | −17.2 | 14.1 | −34.9 |
Mathematics | −19.9% | −13.5% | −18.8 | −25.1 | −19.3 | −5.3 | 8.5 | −16.4 |
Electrical engineering | −31.1% | −12.0% | −0.6 | 12.3 | 33.6 | −4.3 | 1.1 | −12.3 |
Physics | −20.9% | −7.4% | −22.1 | −22.6 | −20.8 | −9.1 | −7.5 | −16.3 |
Social sciences, total | −15.8% | −4.0% | −4.2 | −10.2 | −1.7 | 7.7 | 16.0 | −11.7 |
Chemistry | −9.7% | −2.0% | −7.2 | −13.2 | −7.9 | −0.1 | −1.7 | −3.7 |
Aeronautical engineering | −12.8% | 24.5% | −18.9 | −25.5 | 2.2 | −9.2 | −9.6 | −13.3 |
Astronautical engineering | −20.8% | 79.5% |
| |||||
Chemical engineering | −11.6% | 2.2% | −7.8 | −5.2 | −6.3 | −8.0 | 3.4 | −17.0 |
Astronomy | 28.9% | 46.9% | −4.7 | −7.6 | −1.2 | 10.3 | 3.8 | 15.4 |
Biological sciences | 17.5% | 39.9% | 1.5 | 2.0 | −4.5 | 10.0 | 5.9 | 13.0 |
Computer science | 17.1% | 34.3% | 30.5 | 15.1 | 15.6 | −3.4 | −3.1 | −7.2 |
Agricultural sciences | 6.9% | 21.7% | −2.9 | −2.7 | −4.1 | −0.3 | −3.7 | 2.8 |
Medical sciences | 0.1% | 20.5% | 41.5 | 14.1 | 39.7 | 17.8 | 9.9 | 32.8 |
Civil engineering | 10.1% | 6.4% | −10.3 | −15.6 | −17.2 | −6.3 | 54.2 | −30.8 |
Metallurgy and materials engineering | 20.0% | 7.7% | −16.8 | −16.8 | −14.8 | −12.1 | −2.2 | −20.5 |
Earth, atmospheric, and ocean sciences | 4.9% | 5.6% | −7.6 | −18.2 | −17.3 | 4.7 | 1.5 | 6.2 |
Psychology, total | −9.2% | 1.5% | −0.2 | 22.7 | −7.0 | 7.2 | 2.9 | −6.3 |
SOURCES: NSF, Survey of Federal Funds for Research and Development; NSF, Survey of Graduate Students and Postdoctorates in Science and Engineering; NSF/NIH/USED/NEH/USDA/NASA, Survey of Earned Doctorates. | ||||||||
TABLE 3–2 Full-time Graduate Enrollment in Science and Engineering, by Field and by Selected Source and Mechanism of Support, 1993–1999
| 1993 | 1994 | 1995 | 1996 | 1997 | 1998 | 1999 | Change Number | Change Percent 93–99 |
Aerospace Engineering |
| ||||||||
Graduate Students | 3,262 | 3,000 | 2,693 | 2,576 | 2,529 | 2,565 | 2,645 | −617 | −18.9% |
Federally Supported Graduate Students | 1,320 | 1,279 | 1,168 | 1,104 | 1,143 | 1,109 | 983 | −337 | −25.5% |
Federally Supported Research Assistants | 727 | 719 | 727 | 740 | 793 | 833 | 743 | 16 | 2.2% |
Chemical Engineering |
| ||||||||
Graduate Students | 6,041 | 6,105 | 5,957 | 5,909 | 5,784 | 5,601 | 5,569 | −472 | −7.8% |
Federally Supported Graduate Students | 1,748 | 1,716 | 1,752 | 1,786 | 1,649 | 1,683 | 1,657 | −91 | −5.2% |
Federally Supported Research Assistants | 1,393 | 1,405 | 1,415 | 1,459 | 1,317 | 1,348 | 1,305 | −88 | −6.3% |
Civil Engineering |
| ||||||||
Graduate Students | 12,458 | 12,641 | 12,248 | 11,791 | 11,331 | 11,079 | 11,178 | −1,280 | −10.3% |
Federally Supported Graduate Students | 1,982 | 2,090 | 1,970 | 1,886 | 1,807 | 1,670 | 1,672 | −310 | −15.6% |
Federally Supported Research Assistants | 1,580 | 1,657 | 1,581 | 1,503 | 1,435 | 1,291 | 1,309 | −271 | −17.2% |
Electrical Engineering |
| ||||||||
Graduate Students | 20,343 | 19,385 | 18,167 | 17,967 | 18,854 | 19,470 | 20,224 | −119 | −0.6% |
Federally Supported Graduate Students | 4,104 | 4,085 | 4,056 | 3,984 | 4,389 | 4,316 | 4,610 | 506 | 12.3% |
Federally Supported Research Assistants | 3,068 | 3,199 | 3,287 | 3,277 | 3,722 | 3,694 | 4,100 | 1,032 | 33.6% |
Mechanical Engineering |
| ||||||||
Graduate Students | 12,395 | 11,875 | 11,128 | 10,690 | 10,432 | 10,073 | 10,333 | −2,062 | −16.6% |
Federally Supported Graduate Students | 2,999 | 2,946 | 2,777 | 2,602 | 2,626 | 2,607 | 2,596 | −403 | −13.4% |
Federally Supported Research Assistants | 2,406 | 2,403 | 2,205 | 2,122 | 2,237 | 2,178 | 2,197 | −209 | −8.7% |
Metallurgy and Materials Engineering |
| ||||||||
Graduate Students | 4,249 | 4,108 | 3,880 | 3,693 | 3,661 | 3,702 | 3,537 | −712 | −16.8% |
Federally Supported Graduate Students | 1,605 | 1,578 | 1,544 | 1,597 | 1,473 | 1,431 | 1,336 | −269 | −16.8% |
Federally Supported Research Assistants | 1,393 | 1,373 | 1,373 | 1,437 | 1,328 | 1,297 | 1,202 | −191 | −13.7% |
Engineering, Other |
| ||||||||
Graduate Students | 15,022 | 14,425 | 13,681 | 13,203 | 12,985 | 12,841 | 14346 | −676 | −4.5% |
Federally Supported Graduate Students | 3,130 | 3,160 | 3,093 | 2,873 | 2,780 | 2,687 | 3059 | −71 | −2.3% |
Federally Supported Research Assistants | 2,158 | 2,230 | 2,092 | 1,914 | 1,885 | 1,885 | 2106 | −52 | −2.4% |
Physics |
| ||||||||
Graduate Students | 12,397 | 11,766 | 11,052 | 10,400 | 9,923 | 9,661 | 9,661 | −2,736 | −22.1% |
Federally Supported Graduate Students | 4,916 | 4,716 | 4,397 | 4,130 | 4,008 | 3,810 | 3,807 | −1,109 | −22.6% |
Federally Supported Research Assistants | 4,103 | 4,042 | 3,764 | 3,504 | 3,437 | 3,223 | 3,248 | −855 | −20.8% |
Chemistry |
| ||||||||
Graduate Students | 17,204 | 17,104 | 16,736 | 16,479 | 15,992 | 15,777 | 15,963 | −1,241 | −7.2% |
Federally Supported Graduate Students | 5,751 | 5,775 | 5,469 | 5,278 | 5,031 | 4,909 | 4,994 | −757 | −13.2% |
Federally Supported Research Assistants | 4,713 | 4,936 | 4,719 | 4,588 | 4,393 | 4,291 | 4,340 | −373 | −7.9% |
Astronomy |
| ||||||||
Graduate Students | 848 | 953 | 871 | 854 | 768 | 787 | 808 | −40 | −4.7% |
Federally Supported Graduate Students | 421 | 472 | 434 | 418 | 362 | 366 | 389 | −32 | −7.6% |
Federally Supported Research Assistants | 330 | 376 | 351 | 313 | 278 | 293 | 326 | −4 | −1.2% |
| 1993 | 1994 | 1995 | 1996 | 1997 | 1998 | 1999 | Change Number | Change Percent |
Geosciences |
| ||||||||
Graduate Students | 5,970 | 5,946 | 5,796 | 5,579 | 5,432 | 5,214 | 5,239 | −731 | −12.2% |
Federally Supported Graduate Students | 1,647 | 1,587 | 1,556 | 1,425 | 1,305 | 1,205 | 1,263 | −384 | −23.3% |
Federally Supported Research Assistants | 1,338 | 1,348 | 1,339 | 1,214 | 1,108 | 973 | 1,040 | −298 | −22.3% |
Atmospheric Sciences |
| ||||||||
Graduate Students | 980 | 993 | 959 | 980 | 966 | 856 | 793 | −187 | −19.1% |
Federally Supported Graduate Students | 636 | 644 | 592 | 633 | 639 | 531 | 485 | −151 | −23.7% |
Federally Supported Research Assistants | 547 | 572 | 507 | 537 | 556 | 466 | 430 | −117 | −21.4% |
Ocean Sciences |
| ||||||||
Graduate Students | 2,177 | 2,333 | 2,228 | 2,074 | 1,971 | 2,047 | 2,130 | −47 | −2.2% |
Federally Supported Graduate Students | 1,037 | 1,070 | 1,003 | 940 | 860 | 904 | 932 | −105 | −10.1% |
Federally Supported Research Assistants | 865 | 911 | 849 | 780 | 748 | 769 | 788 | −77 | −8.9% |
Mathematical Sciences |
| ||||||||
Graduate Students | 14,530 | 14,226 | 13,410 | 12,966 | 12,144 | 11,751 | 11,792 | −2,738 | −18.8% |
Federally Supported Graduate Students | 1,474 | 1,397 | 1,287 | 1,237 | 1,152 | 1,044 | 1,104 | −370 | −25.1% |
Federally Supported Research Assistants | 736 | 743 | 659 | 615 | 625 | 541 | 594 | −142 | −19.3% |
Computer Science |
| ||||||||
Graduate Students | 17,401 | 16,701 | 16,510 | 17,195 | 18,335 | 19,972 | 22,708 | 5,307 | 30.5% |
Federally Supported Graduate Students | 2,920 | 3,067 | 3,176 | 3,106 | 3,173 | 3,309 | 3,361 | 441 | 15.1% |
Federally Supported Research Assistants | 2,226 | 2,380 | 2,435 | 2,380 | 2,435 | 2,548 | 2,573 | 347 | 15.6% |
Agricultural Sciences |
| ||||||||
Graduate Students | 9,484 | 9,510 | 9,633 | 9,327 | 9,133 | 9,015 | 9,210 | −274 | −2.9% |
Federally Supported Graduate Students | 1,965 | 1,922 | 2,061 | 1,973 | 1,783 | 1,683 | 1,911 | −54 | −2.7% |
Federally Supported Research Assistants | 1,752 | 1,739 | 1,851 | 1,811 | 1,624 | 1,505 | 1,680 | −72 | −4.1% |
Biological Sciences |
| ||||||||
Graduate Students | 46,487 | 48,026 | 48,366 | 47,782 | 47,011 | 47,105 | 47,268 | 781 | 1.7% |
Federally Supported Graduate Students | 16,210 | 16,725 | 16,649 | 16,564 | 16,365 | 16,251 | 16,531 | 321 | 2.0% |
Federally Supported Research Assistants | 10,369 | 10,642 | 10,593 | 10,448 | 10,399 | 9,816 | 9,899 | −470 | −4.5% |
Health Fields |
| ||||||||
Graduate Students | 35,679 | 39,109 | 42,111 | 44,497 | 46,633 | 48,468 | 50,490 | 14,811 | 41.5% |
Federally Supported Graduate Students | 7,295 | 7,776 | 7,900 | 7,392 | 7,723 | 7,931 | 8,326 | 1,031 | 14.1% |
Federally Supported Research Assistants | 1,473 | 1,725 | 1,659 | 1,542 | 1,850 | 1,857 | 2,058 | 585 | 39.7% |
Social Sciences |
| ||||||||
Graduate Students | 55,606 | 56,255 | 56,212 | 56,894 | 55,535 | 53,822 | 53,258 | −2,348 | −4.2% |
Federally Supported Graduate Students | 3,491 | 3,529 | 3,523 | 3,247 | 3,177 | 3,029 | 3,135 | −356 | −10.2% |
Federally Supported Research Assistants | 1,487 | 1,437 | 1,454 | 1,448 | 1,424 | 1,391 | 1,462 | −25 | −1.7% |
Psychology |
| ||||||||
Graduate Students | 34,782 | 35,288 | 35,222 | 35,412 | 35,551 | 35,148 | 34,715 | −67 | −0.2% |
Federally Supported Graduate Students | 2,653 | 2,634 | 2,543 | 2,752 | 2,720 | 2,927 | 3,255 | 602 | 22.7% |
Federally Supported Research Assistants | 1,549 | 1,473 | 1,467 | 1,499 | 1,491 | 1,359 | 1,440 | −109 | −7.0% |
SOURCE: National Science Foundation, Survey of Graduate Students and Postdoctorates in Science and Engineering. | |||||||||


