Trends in Federal Support of Research and Graduate Education (2001)
Chapter: 2 Field Trends in Federal Research Support
2
Field Trends in Federal Research Support
In recent years, concern has grown about the shifting allocation, or “balance,” of federal research funding among fields, with continuing reductions in most fields of engineering and the physical sciences on the one hand, and accelerating growth in funding for biomedical research. FY 1999 marked the first year of a campaign to double NIH’s budget in 5 years with annual increases of 15 percent through FY 2003, which promises to increase the gap between fields unless there are substantial funding increases for the other fields.1
To characterize the nation’s research portfolio in a reasonably comprehensive and quantitative way, we have only two taxonomies: classification by field or discipline for research performed or supported by government and nonprofit institutions, and classification by industrial sector for research supported by and performed in private industry (see Chapter 5).
Disciplinary classifications generally reflect long-standing academic organization of faculty and graduate training. In other words, they correspond relatively closely to university departments and degree programs. A relatively static disciplinary taxonomy is subject to legitimate criticism for obscuring, among other phenomena
the diversity of some research fields such as physics, encompassing nuclear, particle, and solid state among many sub-disciplines;
the growing importance of inter- and multidisciplinary research;
the extent to which some fields have shifted focus and approach—for example, the predominance of biologically-based chemistry relative to physical chemistry;
the integration of related fields—for example, electrical engineering and computer science and molecular biology and biochemistry; and
the emergence of new fields and subfields—for example, materials science, computational biology, and biophysics—and the decline of others.
The field taxonomy used by the NSF to obtain data on federal and university research expenditures (see Box 2) has other limitations. It may be difficult for non-academic institutions to use,2 it is not uniform across surveys,3 and it is not very detailed. All of these are valid concerns recognized by the NSF. Since its introduction in 1970, the survey of federal R&D obligations has been modified by the addition of the fields of computer science in 1976 and environmental biology and agricultural sciences in 1978. The Foundation nevertheless approaches changes cautiously to minimize discontinuities in the time series. In view of the increased concern about the overall and individual agency research portfolios, the field taxonomy in the Federal Funds Survey deserves even more attention. In the meantime, we are dependent on the classification currently in use to characterize what changes have occurred in the federal research portfolio. To assess the implications of those changes for the health of the research enterprise requires recognition that certain parts of some fields such as physics, astronomy, and oceanography are
BOX 2Classification of Research Fields Engineering Aeronautical: aerodynamics Astronautical: aerospace; space technology Chemical: petroleum; petroleum refining; process Civil: architectural; hydraulic; hydrologic; marine; sanitary and environmental; structural; transportation Electrical: communication; electronic; power Mechanical: engineering mechanics Metallurgy and materials: ceramic; mining; textile; welding Engineering, other: agricultural; bioengineering; biomedical; industrial and management; nuclear; ocean; systems Physical Sciences Astronomy: laboratory astrophysics; optical astronomy; radio astronomy; theoretical astrophysics; X-ray, gamma-ray, and neutrino astronomy Chemistry: inorganic; organic; organometallic; physical Physics: acoustics; atomic and molecular; condensed matter; elementary particle; nuclear structure; optics; plasma Mathematics and computer science Mathematics: algebra; analysis; applied mathematics; foundations and logic; geometry; numerical analysis; statistics; topology Computer science: computer and information sciences (general); design, development, and application of computer capabilities to data storage and manipulation; information sciences and systems; programming languages; systems analysis Life Sciences Biological: anatomy; biochemistry; biology; biometry and biostatistics; biophysics; botany; cell biology; entomology and parasitology; genetics; microbiology; neuroscience (biological); nutrition; physiology; zoology Environmental biology: ecosystem sciences; evolutionary biology; limnology; physiological ecology; population and biotic community ecology; population biology; systematics Agricultural: agronomy; animal sciences; food science and technology; fish and wildlife; forestry; horticulture; phytopathology; phytoproduction; plant sciences; soils and soil science; general agriculture Medical: dentistry; internal medicine; neurology; obstetrics and gynecology; ophthalmology; otolaryngology; pathology; pediatrics; pharmacology; pharmacy; preventive medicine; psychiatry; radiology; surgery; veterinary medicine Environmental Sciences Atmospheric sciences: aeronomy; extraterrestrial atmospheres; meteorology; solar; weather modification Geological sciences: engineering geophysics; general geology; geodesy and gravity; geomagnetism; hydrology; inorganic geochemistry; isotopic geochemistry; laboratory geophysics; organic geochemistry; paleomagnetism; paleontology; physical geography and cartography; seismology; soil sciences Oceanography: biological oceanography; chemical oceanography; marine geophysics; physical oceanography Social Sciences include anthropology; economics; political science; and sociology. Psychology comprises biological aspects (animal behavior; clinical psychology; comparative psychology; ethology; experimental psychology) and social aspects (development and personality; educational, personnel, and vocational psychology and testing; industrial and engineering psychology; social psychology). |
dependent on high cost facilities and that funding trends in agencies that support construction exhibit fluctuations accordingly. The assessment also necessarily entails an appreciation for and articulation of how the character and orientation of research are changing.
Also, from time to time, agencies responding to the NSF survey of federal funds for research and development change their procedures for classifying research obligations by field of research. In 1996, for example, NSF changed its classification of engineering and the environmental sciences research activities so that its support of mechanical engineering appeared to be much less and its funding of oceanography much greater. Mechanical engineering funding went from about $60 million in 1995 to $6 million in 1996; oceanography funding went from about $85 million to $209 million at the same time. If NSF did not actually change what it was funding, the drop in overall federal funding of mechanical engineering was somewhat less than reported, and the apparent increase in federal support of oceanography may not be real. The impact of NSF changes is addressed in the discussion of these two fields (below). Most fine fields were not affected by such changes during the 1993–1999 period, and the broad trends documented in this report—expansion of life sciences funding relative to funding of the physical sciences and engineering—are not affected.
HISTORICAL TRENDS IN RESEARCH FUNDING
The point of departure for our analysis is 1993, the year in which research funding in most fields peaked before the effect of the end of the Cold War and consensus to reduce the budget deficit took hold. Because this or any other point of departure influences the findings regarding trends in subsequent years, we briefly examine previous funding trends in major fields of research. The NSF Federal Funds Survey began to ask federal agencies about their research allocations in 1970, early in a 5-year period of flat research funding following the lunar landing and coinciding with the budget pressures of the Vietnam War. Within the total, however, there were major shifts in shares (Figure 2–1). Engineering and the physical sciences (mainly physics) experienced reductions of 18 and 15 percent while support of the life sciences increased 26 percent and the environmental sciences increased 10 percent.
Following a 5-year period of growth in most fields, research funding overall went down in the early 1980s, a period of recession, but the drop was of shorter duration and affected fewer fields—mainly the environmental and social sciences that were less popular with a conservative administration. Support of the physical sciences actually increased 16 percent from 1980 to 1985, as did support of the life sciences. Engineering support dropped slightly. The next 7 years, 1986 to 1993, were another period of across-the-board growth in support for the most part.
Taken as a whole, the quarter century from 1970 to the early 1990s saw relatively sustained growth of the life sciences, with the exception of a slight and brief downturn in the early 1980s (and more fluctuation in support of other fields.) The U.S. emphasis on health-related research (nearly 20 percent of the nation’s entire R&D investment) is of course a distinguishing characteristic in international comparisons.4
RECENT TRENDS IN RESEARCH FUNDING
As the STEP Board observed in its previous report, although the overall level of federal research funding in 1997 was about the same as in 1993, there were markedly divergent trends among fields of research, with 12 of the 22 fields experiencing a decline in federal funding (four of them by margins of 20 percent or more) while other fields prospered (one—computer science—by more than 20 percent). As noted above, the funding level of most federal agencies’ research programs increased after 1997. This broad improvement in the budget picture raises the question of what has happened to funding by field in 1998 and 1999 and beyond. Was the decline in funding in some fields through the mid-1990s, particularly in some fields of the physical sciences and engineering, halted or even reversed? The answer is yes in a few, but by no means all, cases. Funding was greater in 1999 than in 1993 in 15 of the 22 fields, six of them by more than 20 percent (aeronautical engineering, other engineering, biological sciences, medical sciences, computer science, and oceanography). But seven fields were still below their 1993 funding levels, five of them by more than 20 percent. The seven fields with less funding included three fields of engineering (chemical, electrical, and mechanical), three fields in the physical sciences (astronomy, chemistry, and physics), and one in the environmental sciences (geology).
ENGINEERING
Total Research. Overall, engineering experienced a modest turnaround after 1997, from a 4.7 percent deficit in FY 1997 to an increase of 2.0 percent in FY 1999, but within engineering, the picture is exceedingly mixed (Figure 2–2). Aeronautical (Figure 2–3) and civil engineering (Figure 2–4) went from little or negligible growth to increases of 20.9 and 16.8 percent, respectively. Astronautical engineering (Figure 2–5) also experienced modest growth through 1999 (12.6 percent).5 On the other hand, funding of chemical (Figure 2–6) and mechanical engineering (Figure 2–7) research was even less in 1999 than in
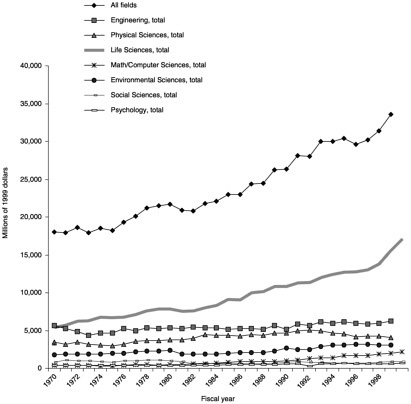
FIGURE 2–1 Federal obligations for research, total and by broad field FY 1970–FY 2000 (in constant dollars).
1997. They were down by −25.9 and −53.9 percent from 1993 to 1999, in contrast with −11.8 and −49.8 percent from 1993 to 1997, respectively.6 Another losing field in the mid-1990s, electrical engineering (Figure 2–8), showed little improvement after 1997. In 1999, its support was still 29.0 percent less than its 1993 peak. Surprisingly, one of the mid-1990s “success stories,” metallurgy/materials engineering (Figure 2–9), suffered a reversal in 1998. Its 14.0 percent increase in 1997 was shaved to a mere 1.5 percent in 1999, compared with 1993. Other engineering (Figure 2–10) also increased substantially from 1998 to 1999, by 25.1 percent.7 The increases came at DOE, where other engineering went from $365.2 million in 1998 to 567.9 million in 1999, and DOD, where it went from $346.7 to $465.9 million, reduced by a decrease at EPA, from $138.0 million to $28.1 million.
Basic Research. Basic engineering research fared well compared with overall research in engineering. While total engineering research was just 2.0 percent more in 1999 than in 1993 in real terms, basic engineering research was 21.7 percent more. This increase took place, of course, at the expense of applied engineering research, which had 3.5
6 | Mechanical engineering was substantially affected by a change in NSF’s criteria for classifying research in 1996. See Appendix A. NSF funding of the field dropped from $54.5 million in 1995 to $6.1 million in 1996. If NSF support is held constant at the 1995 level, assuming that only the classification of the research changed and not the nature of the research funded, then the overall decrease in federal funding is less, 44.3 instead of 53.9 percent. |
7 | “Other engineering” includes agricultural, bioengineering, biomedical, industrial and management, nuclear, ocean, and systems engineering (see Box 2). |
percent less funding in 1999 than in 1993. The same fields that had increases in total research also experienced increases in basic research from 1993 to 1999: aeronautical, astronautical, civil, metallurgy/materials, and other engineering. Those that had less total research funding also had less basic research funding: chemical, electrical, and mechanical engineering.
In some fields, the increase or decrease in basic research funding was about the same for total and basic research (e.g., aeronautical, astronautical, and chemical engineering). Most of the increase took place in a few fields. In metallurgy/materials engineering, total federal research funding increased 1.5 percent (from $776.5 to $788.0 million), but basic research funding increased by 78.6 percent (from $269.4 to $481.2 million). This increase of $211.8 million accounted for nearly three-quarters of the net overall increase in basic engineering research during the 1993 to 1999 period. Other fields in which basic research increased substantially more than total research included civil engineering (59.5 vs. 16.8 percent) and other engineering (50.5 vs. 25.1 percent).
In several fields, federal funding of basic research dropped less than total research funding. In electrical engineering, for example, research funding fell 29.0 percent, while basic research funding fell 18.1 percent. In mechanical engineering, support for basic research dropped 37.4 percent, less than the drop in support for total research of 53.9 percent. If we assume that the amount of total and basic research that NSF defined as mechanical engineering in 1993 has stayed at the same funding level in real terms, then support for basic research fell 24.4 percent, less than the drop of 44.3 percent in total research.
University-Performed Research. Federal obligations for engineering research at universities were $1,046 million in 1999, 5.5 percent more than the $991 million they obligated in 1993 in 1999 dollars. That increase was larger than the 2.0 percent increase in agency obligations for total engineering research during the same 6-year period. As a result, the share of federally funded engineering research performed by universities increased slightly, from 16.1 to 16.7 percent.8
From 1993 to 1999, federal funding of university research increased by a larger percentage than federal funding of total research or decreased by a smaller percentage in most fields of engineering: aeronautical (24.5 vs. 20.9 percent), astronautical (79.5 vs. 12.6 percent), chemical (+2.2 vs. −25.9 percent), electrical (−12.0 vs. −29.0
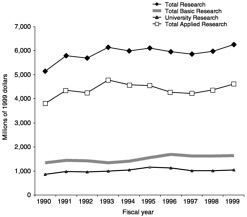
FIGURE 2–2 Federal funding of engineering research, FY 1990–FY 1999 (in constant dollars).
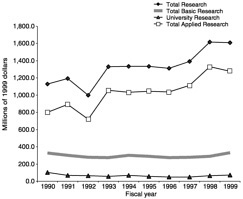
FIGURE 2–3 Federal funding of aeronautical engineering research, FY 1990–FY 1999 (in constant dollars).
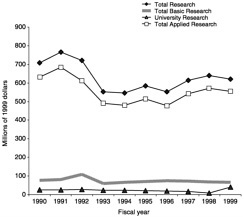
FIGURE 2–4 Federal funding of civil engineering research FY 1990–FY 1999 (in constant dollars).

FIGURE 2–5 Federal funding of astronautical engineering research, FY 1990–FY 1999 (in constant dollars).
percent), mechanical (−40.5 vs. −53.9 percent),9 and metallurgy/materials (7.7 vs 1.5 percent). Civil engineering was the only engineering field in which university research had a smaller increase than total research.
Because of relatively higher increases in funding (or smaller decreases) from 1993 to 1999, universities now perform a substantially higher share of federally funded engineering research in several fields. In chemical engineering, for example, federal funding of university research held steady (+2.2 percent) while overall federal funding fell (−25.9 percent), and universities increased their share of federal funding from 26.6 percent to 36.7 percent. In mechanical engineering, funding of university research was cut less than funding of total research (−40.5 vs. −53.9 percent), and universities increased their share of mechanical engineering research from 25.1 to 32.4 percent. The university share in 1999 was larger—37.6 percent—if we assume that NSF changes are a function of the 1996 reclassification and the agency supported mechanical engineering to the same extent in 1999 as in 1993.
Federal funding of basic engineering research at universities also increased, from $647.4 million in 1993 to $725.2 million in 1999, although that increase of 12.0 percent was less than the increase of 21.7 percent in overall federal funding of basic engineering. Basic research funding was larger in 1999 than in 1993 in five of the seven fields of engineering: aeronautical (2.6 percent), astronautical (114.4 percent), chemical (5.4 percent), civil (9.7 percent), metallurgy/materials (43.6 percent), and other engineering (58.9 percent). Only electrical and mechanical engineering had less funding in 1999 than in 1993 in real terms (−15.4 and −36.8 percent, respectively).10
Universities were responsible for performing much more federally funded basic research than total research in engineering in 1993 (48.0 vs. 16.1 percent in 1993). This role had not changed much by 1999, when universities accounted for 44.2 percent of federally funded basic engineering research vs. 16.7 percent of total engineering research. There were more complex shifts at the fine field level, however. The university share of federal funding of basic research increased sharply in two fields—astronautical and chemical engineering (from 22.1 to 42.9 percent and from 51.8 to 80.4 percent, respectively). It fell in two other fields—civil and metallurgy/materials engineering (from 67.8 to 46.7 percent and from 53.0 to 42.6 percent, respectively).
There were substantial shifts in emphasis on basic
versus applied research in a few fields. In astronautical and metallurgy/materials engineering, basic research expanded relative to applied research. In 1999, for example, 85.0 percent of research in metallurgy/materials engineering was basic, compared with 63.7 percent in 1993. In aeronautical research performed at universities, however, 62.8 percent was basic in 1999, compared with 76.3 percent in 1993.
In summary, universities, which play a relatively small role in performing federally funded engineering research, fared relatively well compared with other performers in most fields during the period of budget cuts and recovery, and within universities, basic research did better than applied research in most fields. Nevertheless, there is less funding in two of the seven fields in 1999 than there was in 1993 (electrical and mechanical engineering), and several other fields experienced modest growth—chemical, civil, and metallurgy/materials (2.2, 6.4, and 7.7 percent, respectively). Only two fields had substantial increases—aeronautical and astronautical engineering (24.5 percent and 79.5 percent, respectively).
Other engineering also experienced substantial growth. Federally funded engineering research in universities in this category grew 36.1 percent from 1993 to 1999 (from $221.8 million to $301.9 million, in 1999 dollars), and basic research support in this category increased by 58.9 percent (from $101.7 million to $161.6 million). If this category of funding had not increased, federal support of engineering research at universities would have been 4.9 percent less in 1999 than in 1993, rather than 5.5 percent more.
PHYSICAL SCIENCES
Total Research. The physical sciences overall continued to experience a decline in funding (Figure 2–11). Down by 13.6 percent from 1993 in 1997, they were down by 17.7 percent in 1999. That trend was reflected in the support of chemistry research, which was off by 13.4 percent from 1993 in contrast to a 7.6 percent decline from 1993 to 1997 (Figure 2–12). Astronomy, which had been up by 4.0 percent in 1997 compared with 1993, had 1.1 percent less funding in 1999 than in 1993 (Figure 2–13). Like electrical engineering, physics experienced a slight improvement in funding from 1997 to 1999, although the total federal research support of the field was still nearly one-quarter below its 1993 level (Figure 2–14).
Federal funding of research in the physical sciences was $4.1 billion in 1999, compared with $4.9 billion in 1993 (measured in 1999 dollars). The bulk of the decline occurred in physics research. Federal funding was $2.2 billion, compared with $2.9 billion in 1993. Astronomy also had less funding in 1999 than in 1993 ($757.9 vs. $766.0 million), as did chemistry ($814.9 vs. $941.1 million).
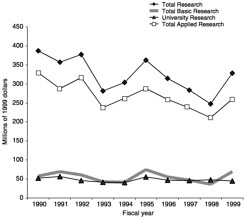
FIGURE 2–6 Federal funding of chemical engineering research, FY 1990–FY 1999 (in constant dollars).

FIGURE 2–7 Federal funding of mechanical engineering research, FY 1990–FY 1999 (in constant dollars).

FIGURE 2–8 Federal funding of electrical engineering research, FY 1990–FY 1999 (in constant dollars).
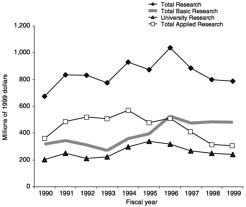
FIGURE 2–9 Federal funding of metallurgy/materials engineering research, FY 1990–FY 1999 (in constant dollars).
The major cuts in physics research were made by DOE and DOD. DOE reduced its support by $461.7 million (−25.3 percent) and DOD by $308.3 million (−57.8 percent), compared with the 1993 funding level. NSF also reduced its level of support, by 8.6 million (−4.7 percent). Some agencies (NIH, DOC, NASA, and others) increased funding, but the total of $75.4 million did little to offset the large cuts at DOE and DOD.
In astronomy, where federal funding fell slightly, from $766.0 to $757.9 million, the major factor was DOE, which dropped funding of astronomy in 1995. Although more than half that cut of $14.0 million was offset by other agencies by 1999, astronomy was still down from 1993.
In chemistry, funding declined rather than improved after 1997. Federal funding in 1999 was $814.9 million, compared with $941.1 million in 1993 (13.4 percent less). In 1997, the funding level was $869.9 million (7.6 percent less than in 1993). The major factors were cuts of $85.4 million by DOE (−31.0 percent) and $50.5 million by DOD (−32.3 percent). The Interior Department reduced its funding by $28.7 million (−98.3 percent) and USDA by $10.3 million (−10.8 percent). Small increases at DOC, NIH, Department of the Interior, EPA, and NSF offset the cuts by $55.1 million. It should be noted that Interior’s level of funding of approximately $35 million a year in 1994 through 1997 fell sharply to less then $1 million in 1998 and to half a million dollars in 1999.
Basic Research. Basic research fared better than total research in the physical sciences as it did in engineering. Basic research funding was 4.8 percent less in 1999 than in 1993, while total research funding was 17.7 percent less. This was mostly due to substantial cuts in applied physics research (−54.4 percent) and to a lesser extent, in applied chemistry research (−22.1 percent).
In physics, federal agencies obligated 5.2 percent less for basic research in 1999 than they had in 1993, compared with a decrease in 24.6 percent in total research. Similarly, in chemistry, the decrease in funding for basic research was less than the decrease for total research, although the differential was not as great as in physics (−8.6 vs. −13.4 percent). In astronomy, however, the decrease in basic research was greater than that for total research (−3.0 vs. −1.1 percent), because DOD and NASA cut support of basic astronomy and increased support of applied astronomy.
University-Performed Research. Federal obligations for university research in the physical sciences increased by $14 million (1.1 percent) from 1993 to 1999 (from $1,309 million to $1,323 million, in 1999 dollars). This was much better than overall federal support of the physical sciences, which was 17.7 percent less in 1999 than in 1993. Federal support of basic research performed by universities was 6.9 percent larger in 1999, again better than overall federal
support of basic research in the physical sciences, which dropped by 4.8 percent.
The funding situation for university research in the physical sciences has improved since 1997, when federal funding was $181 million, 8.5 percent less than in 1993. In 1998, it was $1,197 million, 6.7 percent less.
Two of the three fields had less federal funding for university research in 1999 than in 1993. Federal funding of university physics research decreased by 7.4 percent (from $678.6 to $628.7 million). In chemistry, funding decreased by 2.0 percent (from $388.4 to $380.7 million). These decreases were more than offset by the increase in funding of university astronomy research during the 1993–1999 period. Federal funding of astronomy research at universities increased from $134.1 to $197.0 million, or by 46.9 percent.
Because federal funding of total research decreased more than federal funding of university research in each field, universities performed a larger share of federal research in each field in 1999 compared with 1993. The university role in astronomy research increased the most, because federal funding of astronomy research at universities had increased substantially despite an overall decrease in federal support for astronomy research. Universities conducted 26.0 percent of all federally funded astronomy research in 1999, compared with 17.5 percent in 1993. In the other two fields, universities increased their share of federal support even though federal funding decreased, because federal support fell even more for other performers. In 1999, universities accounted for 46.7 percent of federal funding for chemistry research, and 28.3 percent of physics research, compared with 41.3 and 23.0 percent in 1993, respectively.
In astronomy, NASA increased support of university research by 77.6 percent. DOD reduced its support by 69.6 percent, and NSF’s support stayed about the same (+1.2 percent). The same pattern held for basic research (70.5, −69.6, and 1.3 percent, respectively). NASA support was 12 times larger than DOD’s to begin with, so the increase in NASA support drove the large increase in federal support of astronomy research.
In chemistry, NIH, NSF, and NASA provided more funding for university research in 1999 than in 1993 (9.8, 6.5, and 115.0 percent, respectively), but this increase was offset by decreased funding levels at DOE, USDA, and DOD (−9.6 percent, −21.2 percent, and −38.7 percent, respectively). Basic research did less well. USDA and DOD reduced support by 28.8 and 37.6 percent. Although DOE increased its funding by 7.1 percent, NIH reduced its level of support by 10.5 percent and NSF and NASA increases were modest (3.8 and 5.6 percent, respectively).
In physics, all the major agencies except NASA and USDA cut the level of funding in 1999 from 1993, especially DOD and NIH (by 31.8 and 47.1 percent, respectively). DOE, the largest funder, and NSF, the second

FIGURE 2–10 Federal funding of other engineering research, FY 1990–FY 1999 (in constant dollars).
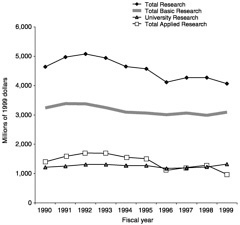
FIGURE 2–11 Federal funding of physical sciences research, FY 1990–FY 1999 (in constant dollars).
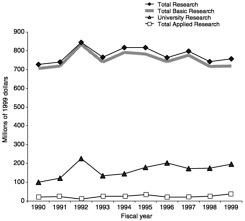
FIGURE 2–12 Federal funding of chemistry research, FY 1990–FY 1999 (in constant dollars).

FIGURE 2–13 Federal funding of astronomy research, FY 1990–FY 1999 (in constant dollars).
largest funder, imposed relatively small decreases (−3.3 and −6.2 percent, respectively), so overall funding was reduced by only 7.4 percent. Basic research in physics at universities increased despite the cut in total university funding for physics. This occurred because DOE’s contribution was 40.6 percent larger ($77.6 million), which more than offset the decreased funding by most of the other agencies, especially DOD (−28.7 percent) and NSF (−6.6 percent).
In summary, universities were less affected than other performers by the steep decrease in federal funding for research in the physical sciences in the 1993 to 1996 period. Since 1996, funding for university research increased each year while overall funding stayed flat. Thus in 1999, federal funding of university research in the physical sciences was larger than in 1993 by 1.1 percent, while overall federal funding of the physical sciences remained 17.7 percent less. The increase was not across the board, however. University research in astronomy actually increased in the 1993 to 1996 period before leveling off. Meanwhile, federal support of chemistry and physics declined after 1993 and has only recovered recently. Funding of chemistry research at universities, 2.0 percent less in 1999 than in 1993, was 13.5 percent less just a year earlier.
MATHEMATICS AND COMPUTER SCIENCE
Total Research. Mathematics funding, like that of some engineering and biological fields, experienced a modest turnaround after 1997 (Figure 2–15). By 1999, its support was up by 6.4 percent over 1993 levels whereas in 1997 it had been down by 4.4 percent from the peak year. Computer science funding continued to accelerate (Figure 2–16). By 1999, it was up 64.4 percent from the 1993 level, compared with 41.1 percent in 1997.
Federal funding of computer science research was $1.5 billion in 1999, up from $0.9 billion in 1993. The main forces in this large percentage increase were DOE, which increased its support by $390.9 million (338.7 percent), and NSF, which increased support by $155.3 million (109.5 percent). Several other agencies also increased their support, including DOD despite the substantial cut in its funding of research overall. DOD support was up by $10.0 million over 1993 (1.9 percent). There were relatively small cuts at USDA, NASA, and Department of the Interior, and among other agencies.
In 1997, federal funding of mathematics research was $310.2 million, $14.4 million less than in 1993. By 1999, it was up to $345.3 million, $20.7 million more than in 1993. In dollar terms, the main factors were a large cut at DOD and substantial increases at NIH and DOE. In 1997, DOD funding was $43.7 million less than in 1993, offset by increases at NIH, DOE, and NSF. DOD funding increased after 1997 (although it was still down by $31.3
million), as did support by NIH and DOE (NSF funding decreased to less than the 1993 level).
Basic Research. In these fields, basic research did not increase as much as total research funding. Overall, federal obligations for basic research in mathematics were 2.6 percent larger in 1999 than in 1993, while the increase in total research was 6.4 percent. Basic research in computer science was up 38.1 percent, compared with an increase of 64.4 percent in total research funding.
Federal agencies made relatively larger investments in applied research than in basic research in both mathematics and computer science in 1999, compared with 1993. This occurred mostly because, although cutting its overall level of support, DOD increased support of applied mathematics, while other agencies increased support of basic and applied research about the same.
Although federal funding of basic computer science research increased by 38.1 percent from 1993 to 1999 (from $317.4 million to $438.3 million), federal funding of total research in computer science increased much more: 64.4 percent (from $922.1 million to $1,516.1 million). Most of this was the result of increased investment in applied computer science research by DOD. There were substantial increases in basic computer science by NSF (119.5 percent) and, from a small base, NIH (408.4 percent), but these were offset by reductions in funding of basic computer science by DOD (−47.8 percent).
University-Performed Research. The fact that federal funding of basic research did not increase as much as total federal funding of research in math/computer science affected university research, because universities conduct a higher percentage of basic research than total research in this area. Although overall federal support of math/computer research was 44.8 percent larger in 1999 than in 1993, federal support of such research at universities was 21.2 percent larger. In 1999, federal agencies obligated $663.0 million, compared with $547.1 million in 1993. Most of this was basic research ($484.0 million, or 73 percent, in 1999). Of the two fields, however, computer science experienced a large increase and mathematics a decrease.
Federally funded computer science research at universities increased by 34.3 percent from 1993 to 1999 (from $377.1 million to $506.3 million). Mathematics research at universities decreased by 13.5 percent (from $151.7 million to $131.3 million). The divergence was even greater in basic research. Federal support of basic research in computer science in 1999 was 38.1 percent more than in 1993 ($337.9 million vs. $242.6 million), while support of basic mathematics research was 16.5 percent less ($121.5 million vs. $145.5 million). As a result, funding for computer science research went from 2.8 percent of federal funding of all research conducted at universities in 1993 to 4.0

FIGURE 2–14 Federal funding of physics research, FY 1990–FY 1999 (in constant dollars).
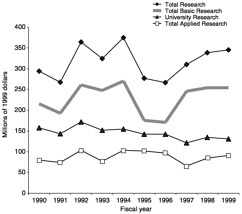
FIGURE 2–15 Federal funding of mathematics research, FY 1990–FY 1999 (in constant dollars).
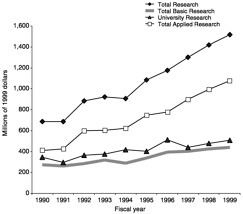
FIGURE 2–16 Federal funding of computer science research, FY 1990–FY 1999 (in constant dollars).
percent in 1999, a large increase but still a small share of overall federal investment in academic research.
LIFE SCIENCES
Total Research. In the 1990s, the life sciences as a whole experienced faster growth then other major fields (Figure 2–17). This is primarily because after 1993, when many federal agency research budgets were flat or decreasing, NIH’s budget authority for R&D increased about 6 percent a year until 1999, when the increase was 14.0 percent.11 The sustained growth in the NIH budget is reflected in the higher level of funding of the medical sciences in 1999 (up by 38.3 percent from 1993) (Figure 2–18) as well as in substantial growth in biological science support (up by 21.2 percent from 1993), although the latter had been relatively flat through 1997 (Figure 2–19). The other biological subfields, which draw most of their support from agencies other than NIH, have reversed downward trends in funding in the past 2 years. Environmental biology is up by 16.0 percent, in contrast to a decline of 3.5 percent through 1997 (Figure 2–20), and funding of agricultural biology is 6.7 percent more in 1999 than in 1993, compared with being 17.1 percent less in 1997 (Figure 2–21).
Federal obligations for medical sciences research increased from $4.9 billion in 1993 to $6.8 billion in 1999, or 38.3 percent. Most of the net increase of $1.9 billion was accounted for by NIH and other parts of the Department of Health and Human Services. Most other agencies, in fact, scaled back support of medical research, but the amounts were comparatively small. DOD reduced its support by $24.0 million (−9.7 percent), EPA by $18.9 million (−98.7 percent), USDA by $8.2 million (−24.8 percent), DOE by $1.6 million (−2.9 percent), and other agencies (primarily VA) by $54.4 million (−16.2 percent). Accordingly, NIH’s share of federal funding of medical research increased from 78.8 percent in 1993 to 82.0 percent.
The pattern in biological research was similar. Federal funding increased from $5.2 billion in 1993 to $6.5 billion in 1999, with 86.1 percent of the net increase accounted for by NIH. In contrast to medical sciences, most other agencies also increased support, including DOD by $65.4 million (67.7 percent), NSF, by 62.9 million (26.3 percent), and Department of the Interior, by $29.2 million (55.4 percent). The level of federal funding of biological sciences did not increase as much as for medical sciences (21.2 vs. 38.3 percent), primarily because NIH expanded the medical research part of its portfolio more than the biological sciences.
The reversal of fortune for agriculture research in 1999, after a period of little or no growth, resulted from a large increase in support by USDA that year. Federal funding of the field was $849.4 million in 1999, compared with $773.5 million in 1998. The increase of $75.9 million came from USDA, which jumped its funding by $91.7 million [offset by decreases elsewhere, primarily the AID].
The environmental biology story is more complicated because it has a more diverse base of support. Like agricultural sciences, federal funding increased sharply in 1999 to $720.6 million, from $612.9 million in 1998, but the increased levels of support came from several agencies. EPA, USDA, NSF, and Department of the Interior each increased funding by amounts ranging from $53.3 to $22.3 million (61.5 to 23.3 percent) and other agencies contributed smaller increases. In the longer run, from 1993 to 1999, increased support from these same agencies far outweighed reductions in funding at DOD, NIH, and other agencies (primarily AID and Smithsonian Institution). DOD support was $24.4 million in 1999, compared with $56.7 million in 1993, a reduction of 56.9 percent.
Basic Research. Basic research increased a little more than total research in the life sciences (31.0 vs. 28.3 percent), although both increased substantially. The pattern at the fine field level was a little more complicated. In the biological sciences and environmental biology, basic research did not increase quite as much as total research. This was due to relatively larger increases in applied biological research by NIH and applied environmental research by EPA and, to a lesser extent, USDA. The trend
in the medical sciences and agricultural sciences was toward basic research and away from applied research. This was the result of a shift toward basic medical sciences research by VA and toward basic agricultural sciences research by USDA.
University-Performed Research. Federal obligations for life sciences research at universities increased by $2.0 billion (31.8 percent) from 1993 to 1999 (from $6.1 to $8.1 billion). This percentage increase was a little more than the 28.3 percent increase in total federal funding of life sciences research in the same period. Federally funded basic research at universities was 28.5 percent more in 1999, not quite as much of an increase as the 31.0 percent increase in total basic research.
Federal funding of life sciences research was flat for several years after 1993 but began to grow again after 1995, with the largest increases occurring in the last several years (from $6.8 billion in 1997 to $7.1 billion in 1998 to $8.1 billion in 1999). The funding of basic life sciences research at universities has followed a similar trend.
Universities are the largest performers of federally funded life sciences research. They received 52.5 percent of the research funding and 58.9 percent of basic research funding in 1999. These percentages had not changed much since 1993, when they were 51.1 percent and 60.0 percent, respectively. There was some shifting at the fine field level, however. The percentage of federal funding going to universities for biology research increased from 57.3 percent in 1993 to 66.2 percent in 1999; in basic research, the increase was from 62.8 to 70.7 percent. Federal funding of medical sciences at universities decreased in the same time period, from 53.0 to 46.2 percent; federal funding of research in the basic medical sciences decreased more, from 62.7 to 51.0 percent. The role of universities in performing environmental research and agricultural research did not change appreciably.
Federal obligations for research and basic research at universities increased in every field of the life sciences from 1993 to 1999, more in some than others. In two cases, university funding increased by a greater percentage than total research funding for all performers. Research in biological sciences increased by 39.9 percent (from $3.1 to $4.3 billion), although total research funding for biological sciences increased only 21.2 percent. Similarly, in agricultural sciences, funding for research performed at universities increased by 21.7 percent (from $166.6 to $202.7 million), compared with a total increase of 6.7 percent. In the other two fields, university research funding increased, but less than for total research. In medical sciences, for example, federal funding increased by 20.5 percent (from $2.6 to $3.1 billion), compared with an overall increase of 38.3 percent. In environmental biology, the increase was 8.7 percent (from $179.1 to $194.7 million, less than the
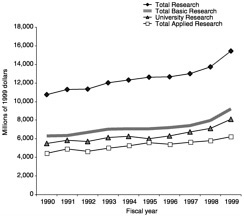
FIGURE 2–17 Federal funding of life sciences research, FY 1990–FY 1999 (in constant dollars).
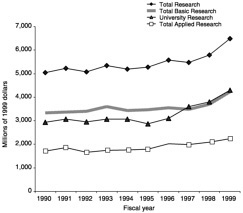
FIGURE 2–18 Federal funding of medical sciences research, FY 1990–FY 1999 (in constant dollars).
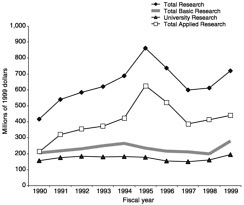
FIGURE 2–19 Federal funding of biological sciences research, FY 1990–FY 1999 (in constant dollars).
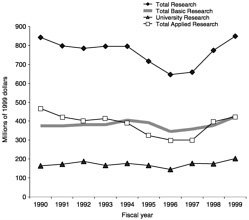
FIGURE 2–20 Federal funding of environmental biology research, FY 1990–FY 1999 (in constant dollars).
overall increase of 16.0 percent. The same pattern held in basic research funding.
In biological sciences, funding provided by NIH for research at universities increased by 44.7 percent and accounted for 95.2 percent of the net increase of $1.2 billion in 1999 over 1993. USDA and DOE provided less funding (−15.7 percent and −17.8 percent, respectively), but the amounts were relatively small (−$28.8 million together). NSF increased its funding of universities by 24.4 percent ($52.5 million) and DOD by 70.0 percent ($25.7 million). The latter increase occurred at Washington headquarters (expanded research programs on breast, prostate, and uterine cancer) and DARPA (research related to defense against biological terrorism). Basic biological research did a little less well, mostly because NIH did not provide as large a percentage increase for basic research relative to its overall increase. NIH increased its funding of universities by 38.2 percent, which accounted for 96.8 percent of the net increase of $738.6 million. DOD provided less funding for basic biological research in 1999 than in 1993 despite the larger overall increase it provided for total biological research at universities. Thus both NIH and DOD shifted support from basic to applied research at universities.
In agricultural sciences, USDA is the dominant funder, providing more than 99 percent of the federal funding in 1993 and 1999. Its increase of 22.0 percent ($36.5 million) accounted for the entire increase in federal funding. DOD and DOE zeroed out funding for agricultural research in 1999, although the amounts were very small, and NASA funding was about the same. The pattern was similar for basic research.
In medical sciences, NIH is the largest funder, accounting for 92.1 percent of all federal funding at universities. NIH funding increased by 18.1 percent ($442.2 million) from 1993 to 1999. This determined most of the increase in federal funding of 20.5 percent. Other DHHS agencies [Agency for Healthcare Research and Quality (AHRQ), Centers for Disease Control and Prevention (CDC), and Health Resources and Services Administration (HRSA)] provided an increase of 85.5 percent ($66.2 million). Funding from DOD and DOE was also larger by about 50 percent ($31.1 million), offset slightly by small decreases from USDA and NASA. The basic research picture was a little more complicated. DOE and DHHS agencies other than NIH do not support basic medical research. NIH’s increase of 22.4 percent ($362.8 million) accounted for the entire federal increase. DOD cut its support of basic medical research by 20.6 percent ($7.1 million) although DOD funding of total medical research at universities was up.
In environmental biology, NSF and USDA provided more funding for university research in 1999 than in 1993 (26.0 percent and 19.7 percent, respectively), but DOD
offset half the increase with a reduction of 68.0 percent. Other agencies also provided less funding although the amounts were small. It was the same pattern for basic research.
ENVIRONMENTAL SCIENCES
Total Research. The 1993 to 1997 pattern in the environmental sciences more or less continued in the subsequent two fiscal years (Figure 2–22). Atmospheric research held its single-digit growth (Figure 2–23) and oceanography its double-digit growth (Figure 2–24), while geology continued its steep decline (down by 25.9 percent in FY 1999 in contrast to 20.1 percent in 1997) (Figure 2–25).
In atmospheric sciences, EPA reduced its level of support from $113.2 million in 1993 to $56.5 million in 1999 (−50.1 percent), and there were smaller cuts at DOD, DOE, USDA, and DOI totaling $29.2 million. But the majority funder, NASA, increased its support from $574.1 million in 1993 to $657.9 million in 1999, joined by DOC, NSF, and smaller agencies, and federal funding of the field increased by $78.0 million (7.1 percent). In fact, unlike most other fields of research, funding of atmospheric sciences has declined somewhat in the past few years. In 1997, funding was 9.0 percent more than in 1993; in 1998, it was 8.4 percent more. This trend results from declining support by NASA during those years.
Oceanography appears to have done well compared with most other fields. Federal obligations increased from $521.7 million in 1993 to $656.6 million in 1999. Much of the increase of $134.9 million came from NSF, which obligated $126.4 million more in 1999 than in 1993. DOD also increased its level of support by $86 million (to $182.8 million), despite the substantial overall reduction in its annual budget for research. These increases, along with a smaller increase at EPA, overcame cuts at DOC, DOI, and NASA by a wide margin, making oceanography one of the six fields to register an increase of 20 percent or more from 1993 to 1999. However, oceanography is another field substantially affected by a change in NSF’s criteria for classifying research in 1996.12 NSF funding of the field increased from $84.5 million in 1995 to $209.4 million in 1996. If NSF support is held constant at the 1995 level, assuming that only the classification of the research changed and not the nature of the research funded, there was no change in the overall level of federal funding (+0.1 percent).
Geology did not fare as well as the other environmental sciences. It lost support by most agencies and went from $890.6 million in 1993 to $660.2 million in 1999, making it one of the five fields with a loss of funding of 20 percent
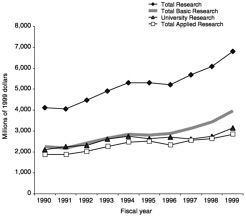
FIGURE 2–21 Federal funding of agricultural sciences research, FY 1990–FY 1999 (in constant dollars).
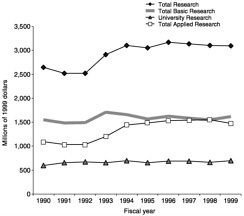
FIGURE 2–22 Federal funding of environmental sciences research, FY 1990–FY 1999 (in constant dollars).
12 | See Appendix. |

FIGURE 2–23 Federal funding of atmospheric sciences research, FY 1990–FY 1999 (in constant dollars).

FIGURE 2–24 Federal funding of oceanography research, FY 1990–FY 1999 (in constant dollars).
or more. The largest reduction was at DOD ($87.4 million), which cut its funding by more than 90 percent, but there were also substantial cuts at DOI (−$50.1 million), NSF (−$43.4 million), and DOE (−$43.1 million). These were cuts of 17.1, 28.4, and 33.1 percent, respectively. It should be noted that geology was one of the fields affected by NSF’s decision to reclassify the research fields of some of its activities in 1996. NSF funding of geology went from $160.0 million in 1995 to $98.5 million in 1996, a level it has maintained since. If we assume that NSF only changed its definition of geology and not the actual types of projects it funds, and we therefore hold NSF funding constant at the 1995 level, then the cut in geology was closer to 21.4 percent than 25.9 percent.
Basic Research. Federal obligations for basic research in the environmental sciences totaled 5.6 percent less in 1999 than in 1993 even though obligations for total research increased by 6.3 percent. That is, federal agencies spent $96.0 million less on basic research but $279.6 million more on applied research in the environmental sciences. Most ($204.1 million) of the increase in applied research came in the unclassified environmental sciences category. The rest came from increases in federal funding of applied atmospheric research.
Oceanography was the only field in which support for basic research was larger in 1999 than in 1993 (but see below). In basic atmospheric research, federal funding decreased by 5.3 percent ($37.9 million). Although NSF increased its support by $15.0 million (10.4 percent), EPA and DOD reduced support by $27.9 million (−100.0 percent) and $24.3 million (−61.8 percent), respectively. In basic geological research, federal funding decreased by 33.5 percent ($207.7 million). Most agencies reduced funding, with Interior making the largest cut in absolute terms (−$125.9 million). DOD and NSF also reduced support substantially, by $57.2 million (−94.7 percent) and $40.8 million (−27.2 percent), respectively. Only DOE increased funding of basic geology, by $25.1 million (40.4 percent).
Oceanography was a different story. Federal agencies obligated 25.9 percent more in total research dollars but 66.0 percent more in basic research. The main driver was NSF, which increased funding of basic oceanography by 149.0 percent ($127.6 million) from 1993 to 1999. DOD also increased its investment in basic oceanography in 1999 (47.2 percent more than in 1993 and 105.4 percent more than in 1998). However, oceanography is another field affected by the change in NSF field definitions in 1996. NSF funding of basic oceanography research jumped from $83.1 million in 1995 to $207.5 million in 1996. At the same time, NSF funding of basic geology research dropped by $60.7 million and basic atmospheric research by $8.6 million. If we assume that NSF changed its classification criteria rather than what it funded, and hold its
investment constant at the 1995 level, then the increase in funding of basic oceanography research since 1993 is a much more modest 7.4 percent.
University-Performed Research. Federal funding of university research in the environmental sciences presents a very mixed picture. Overall, funding of university research from 1993 to 1999 did not increase by quite as much as total research (5.6 percent vs. 6.3 percent), but the increase in funding of basic research at universities was much larger than that for basic research overall. In fact, overall basic research was 5.6 percent less while university basic research was 5.6 percent more. These trends, however, mask very different situations at the detailed field level. Federal support for university research in atmospheric sciences is up moderately, for oceanography it is up substantially, and for geological sciences it is much less than in 1993. The trends in university basic research were basically the same in each detailed subfield.
In 1999, federal funding of atmospheric research at universities increased by 13.7 percent over 1993 ($202.6 compared with $178.1 million). Basic research was 11.1 percent more ($188.0 compared with $169.1 million). In the same time period, federal funding of oceanography research at universities increased by 46.9 percent (from $163.8 to $240.6 million). Since this was almost all basic research, funding of basic research increased by nearly the same percentage: 44.1 percent. The gains in atmospheric and, especially, oceanography research funding at universities were offset by a large decrease in geology research at universities of 31.6 percent (from $210.4 to $143.9 million). Similarly, basic geology research was 26.5 percent less. The trends in funding of university research in geology and oceanography are affected not only by NSF’s change in classification procedures in 1996 but also by the fact that only the six largest R&D agencies are included in the survey of federal funding of university research. That excludes funding from agencies that are large supporters of geology (U.S. Geological Survey in the Department of the Interior) and oceanography (National Oceanographic and Atmospheric Administration in the Department of Commerce).
SOCIAL SCIENCES
Total Research. For most of the period after 1993, federal funding of social sciences was reduced (Figure 2–26). As recently as 1997, it was 4.9 percent less than in 1993 ($716.2 million vs. $753.3 million). Federal support increased in 1998 and again in 1999, when it was $854.9 million, 13.5 percent larger than in 1993. The increases came from NSF and a number of smaller agencies (primarily the Social Security Administration, Department of Justice, and the Agency of International Development). Funding was 15.1 percent less from USDA (−$20.7 mil-
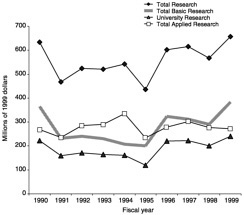
FIGURE 2–25 Federal funding of geology research, FY 1990–FY 1999 (in constant dollars).
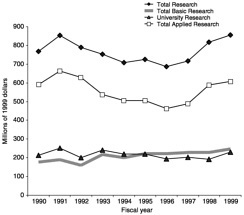
FIGURE 2–26 Federal funding of social sciences research, FY 1990–FY 1999 (in constant dollars).
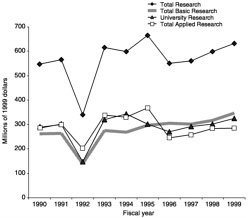
FIGURE 2–27 Federal funding of psychology research, FY 1990–FY 1999 (in constant dollars).
lion), 100 percent less from DOD (−$22.3 million), and 11.1 percent less from DHHS (−$23.0 million) despite an increase from NIH.13
Basic Research. The increase in support of the social sciences in 1999 over 1993 was about the same for basic as for total research (13.8 percent vs. 13.5 percent). This increase resulted from increased investment in basic research by NSF (by 82.5 percent) and DHHS (all from NIH) (by 29.7 percent). These increases, which totaled $62.2 million, were offset in part by reduced support by DOD (−100.0 percent) and USDA (−38.8 percent), which totaled $32.7 million. The large increase in total research from small agencies was mostly for applied research, as was the cut in total research by NIH.
University-Performed Research. Although federal funding of social sciences research at universities increased substantially from 1998 to 1999, it was still 4.0 percent less than in 1993. It had been 20.3 percent less in 1998. As with overall federal funding, USDA, DOD, and DHHS reduced their support, in DOD’s case to zero. NSF was the only agency that provided more funding in 1999 than 1993 (79.9 percent more). The increased funding of total research by SSA, IRS, and AID was mostly for applied research and did not go to universities. Basic research in the social sciences did better than total research. Although USDA and DOD reduced support of basic research, DHHS maintained its support while NSF increased its by 89.6 percent. As a result, university basic research funding increased by 15.7 percent. Like total university research in the social sciences, however, basic research was in negative territory until 1999, although not down as much as total university research.
PSYCHOLOGY
Total Research. Funding of psychology research was $632.6 million in 1999, 2.9 percent more than in 1993 (Figure 2–27). The low point in funding was 1996. Although funding resumed growth after 1996, it was still 8.7 percent less in 1997 than in 1993, and 2.5 percent less in 1998. DOD, which provided $111.2 million for psychology research in 1993, had reduced its investment by 58.8 percent in 1999 (−$45.8 million). NSF also reduced its funding by 73.3 percent (−11.7 million). But NIH maintained its support from 1993 to 1997, then increased it in 1998 and 1999. NIH funding was $479.1 million in 1999, 18.6 percent more than in 1993. The Department of Veterans Affairs (in the “All Others” category) almost doubled its funding of psychology, from $17.4 to $32.9 million, which also helped put psychology in positive territory in 1999.
Basic Research. The increase in federal obligations for basic psychology research was much larger than the increase in total psychology research in 1999 compared with 1993, because federal agencies not only increased their support of basic research (by 26.1 percent) but also reduced their funding of applied research substantially (by −15.9 percent). NIH stepped up funding of psychology by 41.6 percent ($94.4 million), which more than offset the decreases by DOD of $25.8 million (−81.9 percent) and NSF of $6.5 million (−60.5 percent). There was also an increase of $8.9 million in the “Other Agency” category, mostly due to increases in basic psychology research by VA.
University-Performed Research. The trends were similar in federal support of university research in psychology. Although DOD and NSF provided less funding in 1999 than in 1993 (86.8 percent and 70.4 percent, respectively), NIH increased its support enough in 1999 to give psychology a net increase over 1993 of 1.5 percent. The trend was more favorable in basic research, largely because DOD was not a major funder in 1993, so a reduction of 84.6 percent by DOD did not have a large impact on the total. With the major funder, NIH, increasing its funding by 40.2 percent, federal funding of university basic research in psychology increased from $186.0 million in 1993 to $223.8 million in 1999, or 20.3 percent.
CHANGING FUNDING BASE OF SOME FIELDS
In addition to the changing distribution of funding among fields, there were major changes in the funding base or support structure of some fields but virtually no change in the funding base of other fields. By funding base, we mean the set of agencies that are major supporters of a field. In 1993, for example, some fields had a single dominant support agency. DOD provided most of the funding for research in electrical engineering (82 percent), mechanical engineering (75 percent), and metallurgy/materials engineering (73 percent). DOE funded most research in physics (62 percent) and NASA was the principal supporter of research in aeronautical engineering (81 percent), astronautical engineering (79 percent), and astronomy (76 percent). NIH was the dominant funder of research in biological sciences (82 percent) and medical sciences (84 percent), and USDA funded most agricultural research (82 percent).14
Several patterns emerged in the post-1993 period. Some fields primarily funded by an agency that had flat or decreased research budgets in the 1993–1997 period or after have experienced substantial cuts. These include DOE physics support and DOD electrical engineering support. But other fields whose dominant funder had less research funding overall nevertheless have enjoyed increased funding, e.g., DOD computer science support and DOD metallurgy/materials engineering support. Unlike physics and electrical engineering, these fields also prospered by diversifying their base of support. Having a major funder with a growing budget did not guarantee increases, however. Although both biological and medical sciences research receive most of their funding from NIH, NIH’s funding increases in the 1993–1997 period went mostly to medical sciences. Some fields had a broad base of support in 1993. In some cases such as oceanography that worked to their advantage, but in other cases such as chemical engineering it did not insulate them from budget cuts.
Fields With a Shrinking Dominant Funder That Experienced Cuts
In 1993, physics research received 62 percent of its funding from DOE and 18 percent from DOD (Figure 2–28). Both DOE and DOD reduced funding, by 28 and 63 percent ($506 and $335 million), respectively, in 1997 compared with 1993. The next largest funder, NSF, also cut funding of physics research, by 27 percent ($49 mil
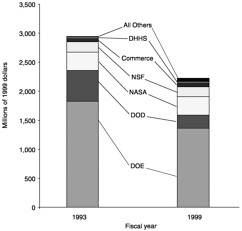
FIGURE 2–28 Agency funding of physics research, FY 1993 and FY 1999 (in constant dollars).
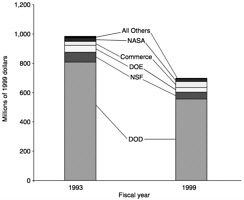
FIGURE 2–29 Agency funding of electrical engineering research, FY 1993 and FY 1999 (in constant dollars).
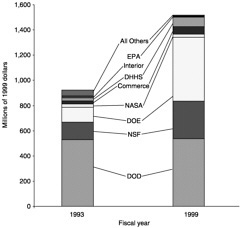
FIGURE 2–30 Agency funding of computer science research, FY 1993 and FY 1999 (in constant dollars).
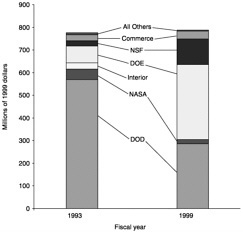
FIGURE 2–31 Agency funding of materials/metallurgy research, FY 1993 and FY 1999 (in constant dollars).
lion). There were small increases from NASA, DOC, NIH, and other agencies, but overall there was 28 percent less funding ($818 million) in 1997 compared with 1993. DOE, DOD, and NSF increased their support some after 1997, but physics research funding was still 25 percent less in 1999 than in 1993. DOE still accounted for most of the federal funding of physics research (61 percent in 1999 compared with 62 percent in 1993), indicating that physics was not able to change its base of support.
Electrical engineering was another field whose base did not change as its principal source of funds, DOD, was reducing its support (Figure 2–29). DOD support of electrical engineering was 31 percent ($252 million) less in 1999 than in 1993 in real terms. Support by most other agencies, notably DOE, NSF, and NASA, also fell. Only the Department of Commerce increased its level of funding, by 55 percent, but only $15 million. The percentage distribution of funding by agency thus barely changed between 1993 and 1999. DOD accounted for 82 percent of the federal support of electrical engineering research in 1993, 80 percent in 1999.
Fields With a Shrinking Dominant Funder That Experienced Growth
In computer science DOD was the majority federal funder of research in 1993, accounting for 57 percent (Figure 2–30). Despite funding cuts, DOD maintained its support of computer science research (2 percent more in 1999 than in 1993 in real terms); but more important, a number of other agencies increased their support substantially. In 1999, federal funding of the field was 64 percent larger than in 1993. As a result, DOD’s share of federal funding fell to 36 percent in 1999 ($538 million), while DOE’s stake increased from 13 percent to 33 percent and NSF’s from 15 percent to 20 percent.
Materials/metallurgy engineering research was another field that was able to change its base of support even though DOD funding dropped by half from 1993 to 1999 in real terms (Figure 2–31). NASA reduced its funding by 61 percent, and Interior almost eliminated its support. As a result, the DOD percentage of federal funding of materials research went from 73 percent in 1993 to 36 percent in 1999 and NASA’s from 6 percent to 2 percent. But these reductions were more than offset by increases at DOE (343 percent) and NSF (370 percent). The Department of Commerce also increased its support (by 33 percent), although the amount was relatively small. DOE accounted for 42 percent of federal support of materials engineering research in 1999, compared with 10 percent in 1993. The comparable percentages for NSF were 14 percent, compared with 3 percent. As a result, the field, which was 73 percent funded by DOD in 1993, now has a different and more distributed funding base: 36 percent DOD but also 42 percent DOE and 14 percent NSF.
Fields With a Growing Dominant Funder
Despite the sustained increases in its research budget, NIH’s shares of federal funding of research in the biological sciences and medical sciences (Figure 2–32) have not changed much, in large part because other agencies also have tended to maintain and even increase their support of those fields. NIH provided 81 percent of the federal funding of biology research in 1999, compared with 80 percent in 1993. It did increase somewhat its share of federal funding of research in medical sciences, to 82 percent in 1999, compared with 79 percent in 1993. Although both fields received most of their support from NIH, it should be noted that the two fields did not prosper equally from NIH’s substantial budget growth. From 1993 to 1999, NIH increased its support of medical science research more than of biological sciences research (43.8 vs. 22.9 percent), which explained nearly all of the change in federal funding of these fields (increases of 38.3 and 21.2 percent, respectively).
Fields With a Diversified Base of Support
Funding of oceanography research was more distributed at the outset of the 1990s (Figure 2–33). In 1993, the Department of Commerce accounted for one-third, NASA for nearly one-quarter, DOD for one-fifth, and NSF for a slightly smaller fraction. By 1999, Commerce had reduced its level of support by 35 percent, but other agencies had increased their support. NSF increased its funding by 145 percent and DOD by 89 percent. Funding of oceanography research was 26 percent larger in 1999 than in 1993. As a result, NSF became the largest federal funder of oceanography (33 percent), followed by DOD (28 percent) and NASA (17 percent). Commerce (16 percent) ended up just behind NASA. If the NASA increase was an artifact of a change in classification procedures the agency distribution would be different, still diversified but with Commerce still displaced as the primary funder. DOD would be the largest funder (35 percent), followed by NASA (21 percent), Commerce (21 percent), and NSF (15 percent).
Mathematics is another field with diversified support that was able to increase its level of funding (Figure 2–34). From 1993 to 1999, DOD support fell substantially (by 35 percent) and there were small reductions by a number of other agencies (USDA, Interior, NSF, Commerce, and NASA), but several other agencies increased funding, which offset the DOD loss. Federal funding of research in mathematics was 6 percent more in 1999 than in 1993, because of substantial increases in support by NIH (120 percent), DOE (33 percent), and EPA, which did not fund mathematics research in 1993. Accordingly, DOD’s share of federal support went from 28 percent to 17 percent, while DOE went from 24 percent to 30 percent, NIH from
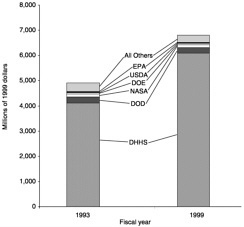
FIGURE 2–32 Agency funding of medical sciences research, FY 1993 and FY 1999 (in constant dollars).
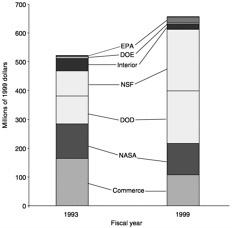
FIGURE 2–33 Agency funding of oceanography research, FY 1993 and FY 1999 (in constant dollars).

FIGURE 2–34 Agency funding of mathematical sciences research, FY 1993 and FY 1999 (in constant dollars).
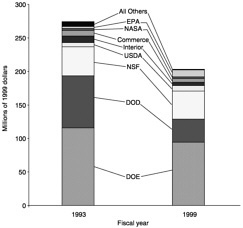
FIGURE 2–35 Agency funding of chemical engineering research, FY 1993 and FY 1999 (in constant dollars).
8 percent to 16 percent, and EPA from 0 percent to 3 percent.
Not all fields with a broad base of support were able to weather funding reductions, however. Chemical engineering, for example, received funding from a number of agencies in 1993, including DOE (42 percent), DOD (28 percent), NSF (16 percent), DOI (4 percent), DOC (3 percent), and smaller amounts from other agencies (USDA, EPA, NASA) (Figure 2–35). Although the percentages did not change much in 1999, overall research funding was 26 percent less in 1999 than in 1993 because all the funders but EPA and USDA reduced their support, including DOD (−55 percent), DOE (−19 percent), DOI (−50 percent), DOC (−34 percent), NASA (−6 percent), and NSF (−4 percent).
In summary, there were major shifts in the funding base of some fields. They included some but not all of the fields whose principal source of support was DOD or another agency, such as DOE or DOI, that cut research funding in the mid-1990s. The fields that grew despite reliance on a shrinking agency—e.g., computer science, metallurgy/materials engineering—diversification of support explains their success in large part. For the fields such as electrical engineering and physics that were dependent mainly on an agency with a shrinking budget and that were not able to diversify saw their funding decline significantly.
ANNEX
TABLE 2–1 Percent Change in Federal Funding for Research, by Field, FY 1993–1999 (in constant dollars)
| All Performers | Universities | ||||
Total | Total | Basic | Applied | Total | Basic | Applied |
All fields | 11.7% | 16.6% | 6.8% | 19.9% | 19.8% | 20.2% |
Engineering, total | 2.0% | 21.7% | −3.5% | 5.5% | 12.0% | −6.6% |
Aeronautical | 20.9% | 20.7% | 20.9% | 24.5% | 2.6% | 94.8% |
Astronautical | 12.6% | 10.6% | 12.8% | 79.5% | 114.4% | 31.3% |
Chemical | −25.9% | −32.1% | −23.2% | 2.2% | 5.4% | −2.2% |
Civil | 16.8% | 59.5% | 9.1% | 6.4% | 9.7% | −1.2% |
Electrical | −29.0% | −18.1% | −32.2% | −12.0% | −15.4% | −2.0% |
Mechanical* | −53.9% | −37.4% | −61.1% | −40.5% | −36.8% | −60.8% |
Metallurgy/materials | 1.5% | 78.6% | −39.5% | 7.7% | 43.6% | −55.3% |
Engineering other | 25.1% | 50.5% | 20.1% | 36.1% | 58.9% | 16.8% |
Physical Sciences, total | −17.7% | −4.8% | −42.4% | 1.1% | 6.9% | −22.9% |
Astronomy | −1.1% | −3.0% | 54.7% | 46.9% | 39.9% | 126.8% |
Chemistry | −13.4% | −8.6% | −22.1% | −2.0% | −7.5% | 33.1% |
Physics | −24.6% | −5.2% | −54.4% | −7.4% | 8.4% | −50.4% |
Life Sciences, total | 28.3% | 31.0% | 24.4% | 31.8% | 28.5% | 39.0% |
Biological Sciences | 21.2% | 17.8% | 28.1% | 39.9% | 32.7% | 60.2% |
Environmental Biology | 16.0% | 12.5% | 18.4% | 8.7% | 4.7% | 17.0% |
Agricultural Sciences | 6.7% | 11.1% | 2.7% | 21.7% | 18.7% | 24.6% |
Medical Sciences | 38.3% | 48.9% | 25.9% | 20.5% | 21.0% | 19.5% |
Math/Computer science, total | 44.8% | 28.8% | 56.3% | 21.2% | 23.2% | 16.1% |
Mathematics | 6.4% | 2.6% | 18.6% | −13.5% | −16.5% | 58.9% |
Computer science | 64.4% | 38.1% | 78.2% | 34.3% | 39.3% | 25.2% |
Environmental Sciences, total | 6.3% | −5.6% | 23.3% | 5.6% | 4.6% | 23.5% |
Atmospheric | 7.1% | −5.3% | 29.8% | 13.7% | 11.1% | 62.7% |
Geological | −25.9% | −33.5% | −8.4% | −31.6% | −26.5% | −95.1% |
Oceanography* | 25.9% | 66.0% | −6.1% | 46.9% | 44.1% | 238.4% |
Social Sciences, total | 13.5% | 13.8% | 13.4% | −4.0% | 15.7% | −24.3% |
Psychology, total | 2.9% | 26.1% | −15.9% | 1.5% | 20.3% | −24.6% |
NOTE: Constant dollar conversions were made using the GDP deflators in OMB, Historical Tables: Budget of the United States Government, FY 2002, Table 10.1. Washington, D.C.: U.S. Government Printing Office, 2001. *Mechanical engineering and oceanography are among the fields for which NSF changed the classification criteria in reporting funding for FY 1996. In these cases, NSF was a principal funding agency, and therefore the amounts reported in 1993 and 1999 are not strictly comparable. SOURCE: National Science Foundation/SRS, Survey of Federal Funds for Research and Development, Fiscal Years 1999, 2000, and 2001. | ||||||
TABLE 2–2 Trends by Field and Character of Research, 1990–1999 (millions of 1999 dollars)
| 1990 | 1991 | 1992 | 1993 | 1994 | 1995 | 1996 | 1997 | 1998 | 1999 | 1993–1997 | 1993–1999 |
All Fields |
| |||||||||||
Total Research | 26,346.2 | 28,112.1 | 27,989.3 | 30,015.1 | 29,951.1 | 30,407.9 | 29,631.7 | 30,201.9 | 31,355.0 | 33,527.5 | 0.6% | 11.7% |
Total Basic Research | 13,751.2 | 14,274.9 | 14,274.1 | 14,956.0 | 14,776.5 | 14,840.2 | 15,166.2 | 15,367.6 | 15,831.5 | 17,443.7 | 2.8% | 16.6% |
Total Applied Research | 12,595.1 | 13,837.2 | 13,715.1 | 15,059.0 | 15,174.5 | 15,567.7 | 14,465.5 | 14,834.3 | 15,523.5 | 16,083.9 | −1.5% | 6.8% |
University Research | 9,488.2 | 10,008.4 | 9,880.8 | 10,653.3 | 10,836.8 | 10,648.1 | 10,845.5 | 11,087.1 | 11,471.0 | 12,776.1 | 4.1% | 19.9% |
Engineering, total |
| |||||||||||
Total Research | 5,150.0 | 5,799.3 | 5,688.0 | 6,138.4 | 5,987.1 | 6,104.6 | 5,956.7 | 5,852.4 | 5,977.9 | 6,263.4 | −4.7% | 2.0% |
Total Basic Research | 1,342.2 | 1,447.0 | 1,428.4 | 1,347.7 | 1,410.0 | 1,549.5 | 1,690.3 | 1,628.1 | 1,616.8 | 1,639.7 | 20.8% | 21.7% |
Total Applied Research | 3,807.9 | 4,352.3 | 4,259.6 | 4,790.7 | 4,577.1 | 4,555.1 | 4,266.4 | 4,224.3 | 4,361.2 | 4,623.7 | −11.8% | −3.5% |
University Research | 868.4 | 972.1 | 955.5 | 991.2 | 1,043.0 | 1,166.5 | 1,132.0 | 1,016.2 | 1,007.6 | 1,046.1 | 2.5% | 5.5% |
Aeronautical engineering |
| |||||||||||
Total Research | 1,129.6 | 1,191.9 | 999.5 | 1,331.7 | 1,336.0 | 1,334.9 | 1,310.0 | 1,391.3 | 1,618.8 | 1,609.7 | 4.5% | 20.9% |
Total Basic Research | 328.6 | 300.5 | 280.1 | 274.8 | 301.4 | 289.9 | 274.4 | 276.7 | 289.2 | 331.7 | 0.7% | 20.7% |
Total Applied Research | 801.1 | 891.4 | 719.5 | 1,056.9 | 1,034.6 | 1,045.0 | 1,035.6 | 1,114.5 | 1,329.5 | 1,278.0 | 5.5% | 20.9% |
University Research | 102.4 | 68.3 | 65.1 | 58.2 | 69.1 | 56.2 | 48.8 | 50.7 | 63.0 | 72.5 | −12.8% | 24.5% |
Astronautical engineering |
| |||||||||||
Total Research | 707.7 | 766.0 | 720.5 | 551.4 | 545.3 | 584.5 | 552.1 | 613.3 | 639.9 | 620.6 | 11.2% | 12.6% |
Total Basic Research | 75.9 | 81.7 | 107.9 | 59.8 | 65.4 | 70.9 | 75.3 | 71.8 | 68.9 | 66.2 | 20.0% | 10.6% |
Total Applied Research | 631.8 | 684.3 | 612.6 | 491.6 | 480.0 | 513.5 | 476.8 | 541.5 | 571.0 | 554.4 | 10.2% | 12.8% |
University Research | 24.6 | 25.7 | 28.7 | 22.8 | 22.6 | 21.1 | 18.8 | 18.1 | 8.9 | 41.0 | −20.8% | 79.5% |
Chemical engineering |
| |||||||||||
Total Research | 294.7 | 356.9 | 340.0 | 274.1 | 260.3 | 263.2 | 225.6 | 241.7 | 192.8 | 203.2 | −11.8% | −25.9% |
Total Basic Research | 92.4 | 119.2 | 119.9 | 81.2 | 77.5 | 71.4 | 62.7 | 70.0 | 53.0 | 55.2 | −13.9% | −32.1% |
Total Applied Research | 202.3 | 237.7 | 220.0 | 192.8 | 182.8 | 191.8 | 162.9 | 171.7 | 139.8 | 148.0 | −11.0% | −23.2% |
University Research | 71.3 | 88.6 | 79.7 | 73.0 | 66.0 | 75.5 | 63.6 | 64.5 | 74.4 | 74.6 | −11.6% | 2.2% |
Civil engineering |
| |||||||||||
Total Research | 387.1 | 357.7 | 377.4 | 281.3 | 303.7 | 363.0 | 314.7 | 283.5 | 247.5 | 328.5 | 0.8% | 16.8% |
Total Basic Research | 57.6 | 69.5 | 61.0 | 43.2 | 41.7 | 75.0 | 55.4 | 46.7 | 36.4 | 68.8 | 8.2% | 59.5% |
Total Applied Research | 329.5 | 288.2 | 316.4 | 238.1 | 262.0 | 288.0 | 259.3 | 236.8 | 211.2 | 259.7 | −0.6% | 9.1% |
University Research | 52.3 | 56.5 | 45.5 | 42.1 | 40.8 | 55.3 | 47.1 | 46.4 | 48.1 | 44.8 | 10.1% | 6.4% |
Electrical engineering |
| |||||||||||
Total Research | 779.9 | 856.1 | 867.4 | 983.9 | 810.5 | 808.8 | 702.2 | 639.9 | 648.3 | 698.7 | −35.0% | −29.0% |
Total Basic Research | 179.0 | 167.1 | 189.0 | 226.7 | 224.8 | 218.8 | 211.2 | 177.8 | 216.9 | 185.6 | −21.6% | −18.1% |
Total Applied Research | 600.8 | 689.0 | 678.4 | 757.2 | 585.8 | 590.0 | 491.0 | 462.1 | 431.4 | 513.1 | −39.0% | −32.2% |
University Research | 168.3 | 167.5 | 169.8 | 218.4 | 207.7 | 185.7 | 171.8 | 150.5 | 179.8 | 192.2 | −31.1% | −12.0% |
Mechanical engineering |
| |||||||||||
Total Research | 327.0 | 393.5 | 385.4 | 521.1 | 413.1 | 441.1 | 308.3 | 261.8 | 253.0 | 240.4 | −49.8% | −53.9% |
Total Basic Research | 111.4 | 135.5 | 130.1 | 159.2 | 154.7 | 176.1 | 118.7 | 107.8 | 108.2 | 99.6 | −32.3% | −37.4% |
Total Applied Research | 215.6 | 258.0 | 255.3 | 361.9 | 258.4 | 265.0 | 189.6 | 154.0 | 144.9 | 140.8 | −57.4% | −61.1% |
University Research | 94.4 | 115.5 | 113.2 | 131.0 | 137.4 | 143.7 | 95.0 | 78.4 | 77.5 | 78.0 | −40.2% | −40.5% |
Metallurgy and materials engineering |
| |||||||||||
Total Research | 675.7 | 833.5 | 831.1 | 776.5 | 930.3 | 871.9 | 1,037.0 | 885.2 | 800.1 | 788.0 | 14.0% | 1.5% |
Total Basic Research | 317.0 | 345.5 | 312.7 | 269.4 | 360.7 | 394.0 | 526.2 | 475.8 | 484.9 | 481.2 | 76.6% | 78.6% |
Total Applied Research | 358.6 | 488.0 | 518.4 | 507.1 | 569.5 | 477.9 | 510.8 | 409.4 | 315.2 | 306.9 | −19.3% | −39.5% |
University Research | 201.7 | 250.7 | 209.6 | 223.9 | 298.1 | 340.0 | 318.5 | 268.6 | 250.1 | 241.2 | 20.0% | 7.7% |
Other engineering |
| |||||||||||
Total Research | 848.4 | 1,043.6 | 1,166.6 | 1,418.6 | 1,387.9 | 1,437.3 | 1,506.8 | 1,535.7 | 1,577.4 | 1,774.3 | 8.3% | 25.1% |
Total Basic Research | 180.2 | 227.9 | 227.7 | 233.4 | 183.9 | 253.3 | 366.4 | 401.5 | 359.3 | 351.4 | 72.0% | 50.6% |
Total Applied Research | 668.2 | 815.6 | 939.0 | 1,185.1 | 1,204.1 | 1,183.9 | 1,140.4 | 1,134.2 | 1,218.1 | 1,422.9 | −4.3% | 20.1% |
University Research | 153.4 | 199.4 | 244.0 | 221.8 | 201.5 | 288.8 | 367.5 | 339.0 | 305.9 | 301.9 | 52.8% | 36.1% |
Physical sciences, total |
| |||||||||||
Total Research | 4,640.8 | 4,967.6 | 5,073.3 | 4,941.4 | 4,647.6 | 4,575.3 | 4,113.4 | 4,267.4 | 4,268.6 | 4,066.2 | −13.6% | −17.7% |
Total Basic Research | 3,243.0 | 3,379.6 | 3,373.1 | 3,244.9 | 3,088.9 | 3,063.6 | 3,001.5 | 3,061.2 | 2,982.5 | 3,089.8 | −5.7% | −4.8% |
Total Applied Research | 1,397.8 | 1,587.9 | 1,700.3 | 1,696.4 | 1,558.7 | 1,511.6 | 1,111.9 | 1,206.2 | 1,286.0 | 976.4 | −28.9% | −42.4% |
University Research | 1,220.3 | 1,255.9 | 1,315.0 | 1,308.9 | 1,276.7 | 1,276.8 | 1,181.4 | 1,197.0 | 1,221.0 | 1,322.8 | −8.5% | 1.1% |
Astronomy |
| |||||||||||
Total Research | 727.6 | 740.9 | 844.6 | 766.0 | 816.9 | 817.5 | 764.3 | 796.8 | 742.4 | 757.9 | 4.0% | −1.1% |
Total Basic Research | 706.6 | 718.2 | 833.9 | 740.5 | 792.0 | 782.3 | 743.2 | 775.7 | 716.8 | 718.4 | 4.7% | –3.0% |
Total Applied Research | 21.0 | 22.7 | 10.7 | 25.5 | 24.9 | 35.2 | 21.1 | 21.1 | 25.6 | 39.4 | –17.1% | 54.7% |
University Research | 100.1 | 122.4 | 225.2 | 134.1 | 144.9 | 178.5 | 201.9 | 172.8 | 175.8 | 197.0 | 28.9% | 46.9% |
Chemistry |
| |||||||||||
Total Research | 928.1 | 971.6 | 1,024.2 | 941.1 | 955.5 | 923.4 | 923.9 | 869.9 | 830.5 | 814.9 | −7.6% | −13.4% |
Total Basic Research | 611.8 | 631.9 | 636.1 | 606.9 | 590.3 | 598.2 | 577.5 | 532.6 | 524.8 | 554.6 | −12.2% | −8.6% |
Total Applied Research | 316.3 | 339.8 | 388.1 | 334.3 | 365.2 | 325.2 | 346.4 | 337.3 | 305.7 | 260.3 | 0.9% | −22.1% |
University Research | 386.7 | 398.3 | 402.1 | 388.4 | 411.6 | 388.2 | 381.7 | 350.6 | 336.0 | 380.7 | −9.7% | −2.0% |
Physics |
| |||||||||||
Total Research | 2,747.6 | 2,886.4 | 2,946.5 | 2,944.9 | 2,669.5 | 2,621.3 | 2,088.0 | 2,126.5 | 2,161.6 | 2,221.9 | −27.8% | −24.6% |
Total Basic Research | 1,796.4 | 1,929.3 | 1,837.1 | 1,786.6 | 1,641.5 | 1,612.0 | 1,620.7 | 1,606.2 | 1,601.9 | 1,693.8 | −10.1% | −5.2% |
Total Applied Research | 951.1 | 957.1 | 1,109.4 | 1,158.3 | 1,028.1 | 1,009.3 | 467.3 | 520.3 | 559.7 | 528.1 | −55.1% | −54.4% |
University Research | 665.6 | 693.1 | 655.5 | 678.6 | 656.5 | 630.8 | 536.5 | 536.9 | 585.2 | 628.7 | −20.9% | −7.4% |
Life sciences, total |
| |||||||||||
Total Research | 10,758.9 | 11,285.5 | 11,326.3 | 12,023.8 | 12,329.9 | 12,630.8 | 12,650.0 | 13,022.0 | 13,747.3 | 15,422.5 | 8.3% | 28.3% |
Total Basic Research | 6,308.7 | 6,372.9 | 6,676.2 | 7,019.5 | 7,071.8 | 7,059.4 | 7,213.0 | 7,409.0 | 7,963.3 | 9,197.1 | 5.5% | 31.0% |
Total Applied Research | 4,450.2 | 4,912.5 | 4,650.0 | 5,004.2 | 5,258.1 | 5,571.3 | 5,437.1 | 5,613.1 | 5,784.0 | 6,225.3 | 12.2% | 24.4% |
University Research | 5,521.8 | 5,826.1 | 5,727.0 | 6,139.6 | 6,275.9 | 6,034.1 | 6,310.8 | 6,753.1 | 7,103.4 | 8,091.1 | 10.0% | 31.8% |
Biological sciences |
| |||||||||||
Total Research | 5,050.1 | 5,228.5 | 5,068.6 | 5,346.5 | 5,185.5 | 5,267.2 | 5,567.7 | 5,471.8 | 5,786.4 | 6,477.6 | 2.3% | 21.2% |
Total Basic Research | 3,341.2 | 3,364.4 | 3,407.8 | 3,596.9 | 3,430.1 | 3,473.8 | 3,551.6 | 3,487.6 | 3,704.1 | 4,236.9 | −3.0% | 17.8% |
Total Applied Research | 1,708.9 | 1,864.1 | 1,660.8 | 1,749.6 | 1,755.5 | 1,793.5 | 2,016.1 | 1,984.2 | 2,082.3 | 2,240.7 | 13.4% | 28.1% |
University Research | 2,932.7 | 3,061.9 | 2,945.7 | 3,064.5 | 3,076.5 | 2,862.0 | 3,096.9 | 3,600.3 | 3,791.4 | 4,288.3 | 17.5% | 39.9% |
| 1990 | 1991 | 1992 | 1993 | 1994 | 1995 | 1996 | 1997 | 1998 | 1999 | 1993–1997 | 1993–1999 |
Environmental Biology |
| |||||||||||
Total Research | 417.1 | 539.2 | 584.0 | 621.2 | 688.3 | 862.8 | 738.1 | 599.1 | 612.9 | 720.6 | −3.5% | 16.0% |
Total Basic Research | 205.1 | 219.3 | 230.4 | 249.1 | 264.6 | 236.0 | 215.7 | 211.9 | 199.6 | 280.2 | −14.9% | 12.5% |
Total Applied Research | 212.0 | 320.0 | 353.6 | 372.1 | 423.7 | 626.9 | 522.5 | 387.2 | 413.3 | 440.4 | 4.1% | 18.4% |
University Research | 155.9 | 175.1 | 185.2 | 179.1 | 182.3 | 178.3 | 155.2 | 150.8 | 160.5 | 194.7 | −15.8% | 8.7% |
Agricultural sciences |
| |||||||||||
Total Research | 842.5 | 797.9 | 785.8 | 795.8 | 794.6 | 716.8 | 645.9 | 659.6 | 773.5 | 849.4 | −17.1% | 6.7% |
Total Basic Research | 375.9 | 374.6 | 381.9 | 381.9 | 404.9 | 393.0 | 345.5 | 358.0 | 377.7 | 424.5 | −6.3% | 11.1% |
Total Applied Research | 466.5 | 423.3 | 403.9 | 413.8 | 389.7 | 323.8 | 300.4 | 301.6 | 395.7 | 424.9 | −27.1% | 2.7% |
University Research | 163.3 | 173.1 | 187.6 | 166.6 | 176.9 | 167.2 | 145.8 | 178.0 | 174.4 | 202.7 | 6.9% | 21.7% |
Medical sciences |
| |||||||||||
Total Research | 4,121.3 | 4,058.5 | 4,468.5 | 4,916.2 | 5,312.6 | 5,317.3 | 5,214.8 | 5,690.4 | 6,080.2 | 6,801.2 | 15.7% | 38.3% |
Total Basic Research | 2,253.7 | 2,178.9 | 2,435.5 | 2,657.5 | 2,852.2 | 2,797.4 | 2,873.8 | 3,121.6 | 3,439.9 | 3,956.5 | 17.5% | 48.9% |
Total Applied Research | 1,867.6 | 1,879.6 | 2,033.0 | 2,258.7 | 2,460.5 | 2,519.9 | 2,341.0 | 2,568.7 | 2,640.3 | 2,844.7 | 13.7% | 25.9% |
University Research | 2,106.3 | 2,263.3 | 2,312.9 | 2,607.9 | 2,740.2 | 2,640.3 | 2,708.7 | 2,609.6 | 2,752.4 | 3,141.6 | 0.1% | 20.5% |
Math/Computer science, total |
| |||||||||||
Total Research | 1,024.4 | 1,059.9 | 1,326.1 | 1,367.8 | 1,422.2 | 1,688.6 | 1,647.9 | 1,719.5 | 1,862.5 | 1,980.6 | 25.7% | 44.8% |
Total Basic Research | 495.8 | 499.8 | 550.2 | 570.7 | 570.1 | 644.8 | 670.6 | 680.2 | 715.4 | 734.9 | 19.2% | 28.8% |
Total Applied Research | 528.6 | 560.2 | 775.9 | 797.1 | 852.1 | 1,043.8 | 977.3 | 1,039.3 | 1,147.2 | 1,245.7 | 30.4% | 56.3% |
University Research | 505.6 | 467.6 | 545.9 | 547.1 | 590.2 | 572.3 | 682.2 | 587.9 | 632.8 | 663.0 | 7.5% | 21.2% |
Mathematics |
| |||||||||||
Total Research | 294.1 | 267.0 | 364.2 | 324.6 | 374.0 | 276.6 | 266.8 | 310.2 | 338.7 | 345.3 | −4.4% | 6.4% |
Total Basic Research | 214.9 | 192.8 | 260.8 | 247.6 | 270.6 | 175.3 | 170.5 | 245.0 | 254.2 | 254.0 | −1.0% | 2.6% |
Total Applied Research | 79.2 | 74.2 | 103.4 | 77.0 | 103.4 | 101.2 | 96.3 | 65.2 | 84.5 | 91.3 | −15.3% | 18.6% |
University Research | 157.4 | 143.0 | 171.9 | 151.7 | 154.1 | 142.4 | 142.6 | 121.5 | 134.4 | 131.3 | −19.9% | −13.5% |
Computer science |
| |||||||||||
Total Research | 684.9 | 686.1 | 882.0 | 922.1 | 907.1 | 1,084.2 | 1,174.2 | 1,300.7 | 1,418.3 | 1,516.1 | 41.1% | 64.4% |
Total Basic Research | 274.4 | 262.2 | 283.1 | 317.4 | 286.6 | 339.1 | 395.1 | 400.6 | 425.0 | 438.3 | 26.2% | 38.1% |
Total Applied Research | 410.5 | 423.9 | 598.9 | 604.7 | 620.5 | 745.1 | 779.1 | 900.1 | 993.3 | 1,077.8 | 48.8% | 78.2% |
University Research | 343.5 | 295.2 | 365.6 | 377.1 | 415.6 | 402.3 | 512.0 | 441.6 | 477.0 | 506.3 | 17.1% | 34.3% |
Environmental sciences, total |
| |||||||||||
Total Research | 2,649.1 | 2,521.4 | 2,523.0 | 2,911.6 | 3,101.2 | 3,052.5 | 3,166.3 | 3,132.4 | 3,104.8 | 3,095.3 | 7.6% | 6.3% |
Total Basic Research | 1,553.3 | 1,482.0 | 1,489.9 | 1,711.7 | 1,657.0 | 1,569.3 | 1,629.5 | 1,587.5 | 1,550.1 | 1,615.7 | −7.3% | −5.6% |
Total Applied Research | 1,095.7 | 1,039.5 | 1,033.1 | 1,199.9 | 1,444.2 | 1,483.2 | 1,536.8 | 1,545.0 | 1,554.7 | 1,479.5 | 28.8% | 23.3% |
University Research | 595.5 | 655.2 | 668.2 | 659.0 | 696.3 | 657.7 | 688.7 | 691.2 | 662.0 | 696.1 | 4.9% | 5.6% |
Atmospheric sciences |
| |||||||||||
Total Research | 942.4 | 941.5 | 876.9 | 1,098.5 | 1,196.5 | 1,214.4 | 1,138.4 | 1,197.5 | 1,190.9 | 1,176.5 | 9.0% | 7.1% |
Total Basic Research | 540.7 | 526.6 | 497.4 | 708.9 | 763.0 | 736.0 | 703.7 | 698.9 | 664.4 | 671.0 | −1.4% | −5.3% |
Total Applied Research | 401.7 | 414.9 | 379.5 | 389.5 | 433.5 | 478.4 | 434.7 | 498.6 | 526.5 | 505.5 | 28.0% | 29.8% |
University Research | 158.3 | 172.5 | 189.7 | 178.1 | 190.2 | 223.4 | 165.8 | 211.6 | 167.9 | 202.6 | 18.8% | 13.7% |


