Personal Cars and China (2003)
Chapter: 4 Present and Future Automotive Technologies
4
Present and Future Automotive Technologies
The tenth five-year plan envisions a future for China in which cars will be widely available to Chinese families and in which the Chinese automotive industry will grow into a “pillar industry” of China’s economy. Technology will play an important role in facilitating these goals.
This chapter describes the automotive technology options that are available today and some that may become available in the longer term, and it comments on their applicability to the development of China’s automotive industry and road transportation fleet. The choice of automotive technology is closely related to the kinds of materials and fuels selected, the economic impacts of the technology, and infrastructure requirements. The development of substantial transportation infrastructure, which requires major investments in land, influences in turn how land is developed. These issues are complex and variable, strongly depending on local values and conditions (see Chapter 6 for more discussion about the effects of motorization on land use).
Because the car is part of a much larger system, the overall costs and benefits of each technology choice must be assessed on a system basis. Such an assessment may reveal that the optimization of a single component may not be the best choice when the total system is considered. This life cycle analysis has been used in technology assessment studies worldwide and is appropriate for strategic decision making.
Although this chapter focuses on automotive technologies, many of the issues considered elsewhere in this report—automotive industry issues (Chapter 3), energy/fuels issues (Chapter 5), societal change (Chapter 6),
environmental and health concerns (Chapter 7), and government policies (Chapter 8)—impinge on the choices of technology. China has already decided to require Chinese cars to meet European Emission Standard I (Euro I) now and Euro II standards by 2004–2005, based on state environmental protection regulations. The European Union1 has been enacting increasingly stringent emissions standards and now requires Euro III standards for its member nations, with Euro IV standards planned for implementation in Europe in 2005. State plans call for Chinese cars to attain the current Euro emissions standards by 2010.
To meet the “wide availability” objective (that is, be affordable), the “China car” would have to cost about RMB60,000–80,000 ($7,200–9,600). Below this price range, the basic requirements for emissions control, performance, and safety cannot realistically be met.
To make the automotive industry into a pillar of the economy, China will have to build its domestic capabilities for supplying materials, manufacturing components, and providing the design, assembly, maintenance, sales, credit, and other services that in turn will contribute to an increase in China’s gross domestic product (GDP). As discussed in Chapter 3, consolidation of the Chinese automotive industry and improvements in efficiency and cost competitiveness will take on new importance. Imported cars and components create unfavorable trade balances for China, whereas exports will expand opportunities for its automotive industry. Where technology choices bear on the future competitiveness of the industry, these factors must be considered carefully.
Likewise, the China car should be highly fuel-efficient, because China’s domestic supply of petroleum fuel is limited at present and higher fuel demand can be met in the near future only through increased imports. This situation will affect China’s balance of trade over the next decade and perhaps longer. The China car also should be highly “clean” in emissions, because the air quality in many Chinese large cities ranks among the worst in the world. The situation is expected to worsen if vehicle tailpipe emissions are not controlled rigorously.
The buyer of the China car will have a heavy influence on automobile design and sales. Successful auto companies select product attributes that maximize markets. Consumers typically want the most performance and convenience they can afford. Initially, most Chinese drivers will be located in urban areas or on rural and intercity roads that are not designed for high speeds. The performance requirements and fuel efficiency of cars are heavily influenced by the “driving cycles” used in designing and op-
erating the vehicle. In the United States, where motorists engage in a lot of high-speed highway driving, many cars are designed with large engines to enable passing and hill-climbing capability at high speed. But these cars have poor fuel efficiency at low speeds and continue to burn fuel at a high rate when idling in urban traffic jams. Cars designed specifically for urban driving cycles could be much more fuel-efficient under these conditions. For example, new technologies based on greater electrification of the car are being developed to switch the engine off during vehicle stops. This feature has the double benefit of reducing emissions and wasted fuel. The envisioned China car also will have to be highly reliable, easily serviceable, and rugged to accommodate China’s present road and maintenance infrastructure.
Over the century of development of automobiles in member countries of the Organisation for Economic Co-operation and Development (OECD), governments and automakers continually responded to problems and applied the lessons learned to the development path. For example, pollution problems led to increasingly stringent emissions regulations; safety problems led to improved roadway designs, crashworthy vehicle designs, and safety features such as seat belts and air bags; and operational problems led to driver training and vehicle inspection programs. China, facing an anticipated period of rapid investment and growth for automobiles and the associated infrastructure of a decade or two rather than a century, will benefit from those lessons as well.
The technology choices that must be made in China are constrained by the marketplace and by various government policies and regulations. With that in mind, this chapter will focus on technologies that seem to best fit the rapidly growing automotive industry in China over the next five years or so, and will examine them within the context of both their short- and long-term implications for the industry and consumers. The discussion of near-term technologies will be placed in the context of current expectations of government policies. The discussion of longer-term technologies will address those that could be important whether current government policies remain as they are or not.
FLEET ISSUES FOR VEHICLE TECHNOLOGIES
Emissions Control
In view of the projected growth of China’s vehicle fleet, air quality issues in major urban areas are of great importance. As just noted, Chinese cars produced in 2004–2005 must meet Chinese emissions standards equivalent to the Euro II standards. China’s Technical Policy on Prevention and Control of Motor Vehicle Pollution states that emissions levels

FIGURE 4-1 Driving cycles for measuring emissions. NOTE: 20 miles per hour (mph) = 32 kilometers per hour (kph); 40 mph = 64 kph; 60 mph = 97 kph; 80 mph = 129 kph.
should approach the international level of control around the year 2010 (Chinese State Environmental Protection Agency, 1999). Table 4-1 summarizes the principal elements of the existing U.S., Japanese, and European standards. Emissions control technologies to meet these standards are discussed later in this chapter.
Vehicle emissions are the products of the incomplete combustion of propulsion fuels. Propulsion system efficiencies vary with output energy requirements, and different propulsion technologies achieve optimum efficiency under different conditions. In urban driving, conventional engines continue to run, using energy and producing emissions, even if a vehicle is stopped or moving slowly in traffic. Because any comparison of vehicle options must take into account the typical local driving conditions, when emissions standards are set they are based on a specified “driving cycle.” Figure 4-1 presents four examples of driving cycles specified by regulatory groups in the United States, Japan, and Europe.
TABLE 4-1 Examples of Emissions Standards in the United States, Japan, and Europe
In the United States, emissions are set on a per mile basis using a combined urban-highway cycle. Japanese and European driving cycles are more similar to the U.S. urban driving cycle than to the U.S. highway driving cycle. A comparison of the urban driving cycles used in Japan (Figure 4-1c), Europe (Figure 4-1d), and the United States (Figure 4-1a) to measure emissions indicates that in the Japanese and European cycles more time is spent with the vehicle stopped, engine idling, than in the U.S. cycle, which has an higher average speed and less idling time. Figure 4-1b depicts the U.S. highway cycle that was used in combination with the U.S. city cycle to determine vehicle fuel economy (45 percent share of the highway cycle and 55 percent of the city cycle).
When vehicles are operated only in urban environments where traffic constrains their rate of acceleration and maximum speed, users have modest expectations of vehicular performance in terms of acceleration and top speed. If users are able to drive vehicles on improved roads at high speeds with little competing vehicular traffic, their expectations for engine power and high-speed capability will rise. Because China has chosen the Euro emissions standards, it will have to measure emissions performance for the driving cycle that is established for the Euro system. In the future, however, China may choose to implement new standards, with a driving cycle and emissions standards suited to its specific environment.
Energy Use and Fuel Economy
The energy use of a vehicle fleet depends on the size, weight, type, and efficiency of vehicles in the fleet and on the driving conditions encountered in their use. Energy use includes not only the fuel consumed in operating the vehicle, but also the energy consumed in making the vehicle, producing and processing the fuel, and disposing of the vehicle at the end of its life.
Life Cycle Assessment
Anyone weighing the automotive technology options discussed later in this chapter would benefit from comparing alternative automotive technology systems over their full life cycle (see Figure 4-2, which depicts the steps in the life cycle of automotive technology from the production of the raw materials used to make the fuel and the vehicle through the vehicle’s useful life to its final disposition). Such an assessment would allow one to track the key parameters involved through each of these life cycle stages and assess the overall results as part of the technology selection process. For the vehicle, the major parameters of interest are: cost, performance, local emissions of air pollutants, greenhouse gas (GHG) emissions, and
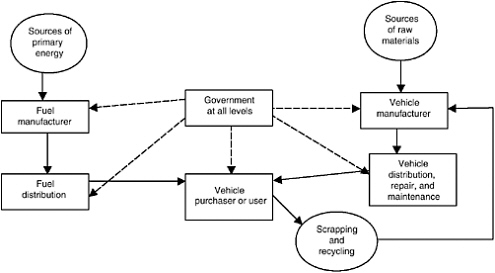
FIGURE 4-2 Steps in the life cycle of automotive technology. SOURCE: Weiss et al. (2000).
energy use. The vehicle also must have attributes that make it attractive to its purchasers and users over its lifetime, and it must meet established regulatory standards.
Various recent studies have compared the technologies for clean, fuel-efficient cars (Office of Technology Assessment, 1995; Automotive Engineering, 1996; Sierra Research, 1997; Höhlein et al., 1998; Singh et al., 1998; Ogden et al., 1999; NRC, 2000; Pembina Institute, 2000; Weiss et al., 2000; GMC, 2001). Not all of these studies treat the full life cycle of comparable fuel/vehicle systems. For example, the U.S. Partnership for a New Generation of Vehicles (PNGV) program does not consider the fuel cycle in its performance goals or comparisons of vehicles (NRC, 2000). And the General Motors study does not provide information on the production costs of new vehicles, nor does it state detailed design assumptions about the vehicles evaluated. The results of the study by Weiss et al. (2000) are summarized here to illustrate the importance of a life cycle review.
Beyond the organizations directly involved in producing fuels and vehicles are the vehicle purchasers and various levels of government. Those purchasing vehicles make their choices based largely on affordability, convenience, comfort, availability, and appearance. Local governments impose local zoning and safety codes; subnational governments issue planning, tax, and regional environmental regulations; and ultimately the national government is responsible for central investments in infrastructure, for national tax policies, and for the national trade, envi-
ronmental, safety, and other requirements that are applied to fuels and vehicles.
In the life cycle assessment used here for illustrative purposes (Weiss et al., 2000), the starting point is a vehicle similar to a 1996 Toyota Camry. It is assumed that this vehicle, the baseline vehicle for the study, evolves forward to the year 2020 into a car of similar performance and capacity. The analysis is based on a U.S. Environmental Protection Agency (U.S. EPA) combined city-highway driving cycle. Various choices in technology are then considered, resulting in the following set of study cases:
Baseline vehicle—the 2020 version of a car similar to a 1996 Toyota Camry, with a gasoline engine, 600 kilometer (km) refueling range, and some body lightweighting
Advanced body vehicle—a similar car that is about 10 percent lighter than the baseline because of changes in materials and that costs about 10 percent more
Advanced body, diesel (with both petroleum-based fuel and Fischer-Tropsch synthetic diesel fuel made from natural gas)
Advanced body, hybrid—gasoline, diesel, or compressed natural gas (CNG)
Advanced body, fuel cell hybrid—dependent on reforming gasoline, reforming methanol, or utilizing high-pressure hydrogen gas made from natural gas
Advanced body, electric (requiring recharging every 400 km because of battery limitations).
The comparisons that follow are based on these vehicle designs. But because forecasting technology some 20 years in the future involves some uncertainty, the forecasts here related to evolutionary and advanced body combustion engine cars are subject to underestimation or overestimation by about 10 percent; the hybrids by about 20 percent, and the fuel cell and electric vehicles by about 30 percent. The uncertainties are greater for the rapidly evolving technologies because of the possibilities of technological breakthroughs or the identification of unanticipated barriers. The study by Weiss et al. (2000) assumes a vehicle lifetime of 15 years and an annual distance traveled of 20,000 km.
Life Cycle Energy Consumption
Figure 4-3 shows the life cycle energy consumption, on a megajoule (MJ) per kilometer basis, of the various technology combinations evaluated. The top portion of each bar represents the energy equivalent of the fuel used by the vehicle in propulsion, the middle portion the energy used

FIGURE 4-3 Comparisons of life cycle energy use. NOTE: MJ/km = megajoule per kilometer; AB = advanced body; F-T = Fischer-Tropsch; CNG = compressed natural gas; FC = fuel cell; MeOH = methanol; H2 = hydrogen. SOURCE: Weiss et al. (2000).
in producing that amount of fuel, and the bottom portion the energy used in the actual manufacture of the vehicle (embodied energy). For the cases studied, the energy involved in vehicle manufacture is a relatively small part of the life cycle energy use. For much smaller, more efficient vehicles, the embodied energy becomes a more significant factor.
For petroleum fuels and natural gas, the energy required for fuel production is a relatively small part of total energy requirements (Figure 4-3). However, the energy associated with producing a synthetic fuel by a Fischer-Tropsch process adds substantially to life cycle energy use, which is related to GHG emissions as well. The energy production requirement for electric vehicles is based on the mix of energy sources and power generation efficiencies of the U.S. electricity supply. On that basis, the fuel cycle is the predominant energy requirement for the electric vehicle.
Life Cycle Costs and Emissions
Figure 4-4 presents similar comparative data, but it looks at total annual operating costs, new vehicle costs, and total GHG emissions. It is assumed that the vehicles would have to incorporate technology to meet

FIGURE 4-4 Life cycle comparisons of costs and carbon emissions. NOTE: Annual operating costs include amortized new vehicle costs and running costs as shown in Table 4-2. AB = advanced body; F-T = Fischer-Tropsch; CNG = compressed natural gas; FC = fuel cell; MeOH = methanol; H2 = hydrogen; gC/km = grams carbon per kilometer. SOURCE: Weiss et al. (2000).
the 2020 U.S. emissions standards for local pollutants. The pattern of GHG emissions follows that of energy use for the petroleum fuel-based systems, but emissions are somewhat reduced for the CNG-fueled hybrid. GHG emissions for the hydrogen fuel cell and for the electric car are slightly higher than those for the gasoline hybrid, based on the U.S. electric sector average GHG emissions.
Table 4-2 presents estimates of the annual operating costs for new U.S. vehicles based on fuel cost averages and vehicle fuel consumption. A flat fuel tax of $0.0033 (RMB0.027) per megajoule of fuel ($0.40 per gallon of gasoline equivalent) is used across all the fuel sources (this assumption is made so that tax policy does not affect relative results; taxation is a policy tool that may be used to influence the economic choice between technologies). A constant maintenance or other charge of $0.036 (RMB0.30) per kilometer for the various technologies is assumed to avoid introducing an additional bias. Total fixed costs are based on known fixed annual
TABLE 4-2 Vehicle Costs per Kilometer for Selected New Vehicle Options, 2020 (1997 U.S. dollars per kilometer)
| Evolved Body Gasoline | AB Gasoline | AB Diesel | AB Gasoline Hybrid | AB Diesel Hybrid | AB, CNG Hybrid | AB Gasoline FC Hybrid | AB Methanol FC Hybrid | AB Hydrogen FC Hybrid | AB Electric |
Total running costs | 0.056 | 0.053 | 0.047 | 0.049 | 0.044 | 0.049 | 0.056 | 0.050 | 0.054 | 0.045 |
Fuel ex tax (percent of total) | 0.014 (5%) | 0.012 (4%) | 0.007 (2%) FT=0.009 | 0.009 (3%) | 0.005 (1%) FT=0.006 | 0.010 (3%) | 0.014 (4%) | 0.010 (3%) | 0.015 (4%) | 0.007 (2%) |
Fuel tax | 0.006 | 0.005 | 0.004 | 0.004 | 0.003 | 0.003 | 0.006 | 0.004 | 0.003 | 0.002 |
Other (oil, tires, maintenance) | 0.036 | 0.036 | 0.036 | 0.036 | 0.036 | 0.036 | 0.036 | 0.036 | 0.036 | 0.036 |
Total fixed costs | 0.250 | 0.268 | 0.281 | 0.292 | 0.304 | 0.297 | 0.317 | 0.315 | 0.303 | 0.363 |
Insurance | 0.050 | 0.052 | 0.053 | 0.056 | 0.057 | 0.056 | 0.057 | 0.057 | 0.057 | 0.063 |
License, excise tax, registration | 0.020 | 0.022 | 0.023 | 0.024 | 0.025 | 0.024 | 0.026 | 0.026 | 0.025 | 0.030 |
Capital costs | 0.180 | 0.194 | 0.205 | 0.212 | 0.222 | 0.217 | 0.234 | 0.232 | 0.221 | 0.270 |
Total costs | 0.306 | 0.321 | 0.328 | 0.341 | 0.348 | 0.346 | 0.373 | 0.365 | 0.357 | 0.408 |
NOTE: AB = advanced body; FC = fuel cell; CNG = compressed natural gas; FT = Fischer-Tropsch. SOURCE: Weiss et al. ( 2000) | ||||||||||
costs (license, registration, and insurance) and on 20 percent per year of the new vehicle cost. Running costs are based on 20,000 km per year of travel. Fees for license and registration of $0.02 (RMB0.17) per kilometer (scaled by new vehicle cost relative to the baseline to represent some excise tax and other costs) are incorporated into the calculations, as well as insurance costs of $0.05 (RMB0.4) per kilometer, with half of the cost scaled by the purchase price. These assumptions are consistent with current U.S. analysis (Davis, 1999).
The annual operating costs reflect the assumption that the new cars would be sold in the United States in 2020. As cars age, their capital value decreases, and fuel and maintenance costs become a larger fraction of the decreasing total annual operating cost. Likewise, in countries where certain fuels are heavily taxed, the ratio of capital to running costs would be less for vehicles using those more expensive fuels. All these costs are subject to uncertainties inherent in the assumptions made in this analysis. The cost difference between the baseline vehicle and the most expensive option is 22 percent.
Like today, the total annual cost for a new U.S. vehicle in 2020 is dominated by the capital cost, which is tied to the vehicle cost. Estimates indicate that the more efficient vehicles from an energy consumption standpoint are the more expensive ones, and the charges associated with increased price more than offset any fuel savings at current U.S. tax rates. For fuel cell vehicles, the total operating costs vary from the baseline of about 0.30 per kilometer to about $0.37 (RMB2.5–3.1) per kilometer. This difference reflects the roughly 30 percent higher estimated purchase price for the fuel cell vehicles. The $0.41 (RMB3.4) per kilometer cost of the electric vehicle is mostly attributable to the increased capital cost associated with the storage batteries. Overall, only large differences in fuel costs or fuel taxes are likely to have a significant influence on the annual operating costs of new cars. For example, at a UK tax rate of $3.53 per gallon of gasoline (8.8 times higher than the U.S. rate), the baseline vehicle fuel tax would increase to $0.044 (RMB0.36) per kilometer and the total new baseline vehicle operating cost would rise to $0.343 (RMB2.80), about 13 percent higher than in the United States.
Overall Life Cycle Comparisons
The following general comments are based on the cases evaluated:
Reducing vehicle weight improves life cycle efficiency. In the cases studied, a 10 percent weight reduction produced about a 10 percent reduction in energy but resulted in about a 10 percent increase in vehicle cost. A smaller, lighter “China car” could be considerably more efficient than the typical U.S.-size car studied.
Hybrid technologies offer significant energy savings, particularly in urban driving cycles. Typically, these cars are more expensive because of the more complex drive trains. A partial hybrid that shuts the engine on and off in stop-and-go traffic can achieve some of the emissions reductions and energy savings of a true hybrid, with only a modest impact on cost.
The diesel engine offers some improvements in efficiency at a somewhat higher cost, but challenges remain as to whether it can meet emerging emissions standards for nitrogen oxides and particulates.
A hydrogen fuel cell car does appear to offer some advantages. It eliminates harmful vehicle emissions (although it can produce other emissions, depending on how the fuel is produced), but because of the cost and uncertainty about the development of the technology, it is not clearly a winner in the near term. Major investments in research and development (R&D) and in infrastructure will be required to move this technology into a significant market share over the next decade or two.
The uncertainty bounds allow for the possibility of revolutionary improvements in any of the technologies. Where these happen, a predominant new technology may emerge. Because the vehicle system has so many components, breakthroughs are possible in many different areas— perhaps in control systems, batteries, engine or fuel cell technology, or fuels.
VEHICLE COMPONENT TECHNOLOGIES
Vehicle Weight and Body
The dependence of fuel economy on vehicle weight is shown schematically in Figure 4-5 (Horton and Compton, 1984). In the past, the main incentive for substituting lighter materials has been to meet requirements for decreasing emissions below critical levels while minimizing the economic impact. In the United States, where fuel costs are not of major concern to vehicle purchasers at present, average vehicle weights have been increasing as sport-utility vehicle (SUV) sales increase. However, this finding masks the fact that vehicles of a given size are becoming increasingly efficient. Lighter materials, including high-strength steels, aluminum, and plastics, are replacing heavier carbon steels. The potential for weight reduction is considerable, but the present barrier is the higher costs of many of the lighter materials. Automakers are working hard on ways to bring down these costs.
The high-strength steels now being used extensively in new vehicles can provide, with minimal additional cost, equivalent strength at less

FIGURE 4-5 Typical fuel economy improvements in new vehicle options resulting from vehicle weight reduction for a typical power train efficiency. NOTE: Improvements in power train efficiency also increase fuel economy. SOURCE: Horton and Compton (1984).
weight. About a 15 percent reduction in vehicle fuel use can be achieved by substituting high-strength steel for regular steel. Additional weight reduction can be achieved through the increased use of aluminum or fiber-reinforced plastic composites. Substitution of these two light materials for steel must not, however, compromise vehicle safety. The costs and availability of virgin materials, as well as the costs of disposing of scrapped vehicles, will influence decisions about the level of recycling that is appropriate. Significant energy savings and some cost savings are associated with the recycling of metals, especially aluminum. However, aluminum alloys vary in properties as a function of composition, and so a mixed recycled alloy is unlikely to match the desired physical properties for particular car components. The car market is therefore still largely dependent on virgin aluminum. Some research is under way on developing an all-purpose alloy that would meet structural needs and yet be suitable for recycling. Other approaches are to design for a few alloys that would separate easily on disassembly. This mixing problem occurs with other materials as well and should be considered in the design for recycling.
Several European countries and Japan are enacting strict requirements for recycling or for manufacturers to be responsible for vehicles at the end
of their useful life. A large vehicle fleet generates a considerable waste stream. In countries such as the United States where land is available for inexpensive disposal sites, this problem does not appear to be a priority one. But in congested countries where landfill disposal is not available and more expensive incineration is used for wastes, more aggressive measures seem appropriate. For metals, recycling is usually cost-effective, but other materials are more difficult to separate and are associated with only a marginal cost incentive (or a cost penalty) for recycling. Cars traditionally have not been designed for end-of-life waste minimization. However, some manufacturers are now modifying designs to facilitate disassembly, reuse of some components, and recycling of many materials. Mixed plastics and fiber materials can even be burned to generate process heat, for example. This new approach to design also has suggested ways in which repairs can be modularized for simpler servicing.
The Chinese government has examined domestic material resources for use in the manufacture of today’s vehicles; where new materials are needed for the next generation of vehicles, similar analyses should be undertaken. Furthermore, the government will have to provide for the waste streams generated by scrapped vehicles, which it may wish to begin doing now in the requirements it imposes on industry—whether domestic or foreign.
Vehicle design comprises a complex set of decisions about aerodynamics, stability, interior space, and safety. The characteristics of a vehicle’s propulsion system, transmission, and fuel storage systems are related to its weight and performance. Safety depends both on intrinsic performance capabilities and on crashworthiness. Today’s new collision warning systems and other devices also may increase the safety of smaller vehicles. Vehicle design that seeks to protect the passengers in an accident requires a sophisticated combination of understanding the crush behavior of structural elements and the performance of passenger restraint and protection systems, such as air bags. It is certainly possible to design a very safe small car, but it still will be less safe than a larger car of similar design if it crashes into an object larger in mass.
Air drag and tire resistance provide opportunities for designers to reduce energy losses. Vehicle drag coefficients have fallen from the typical level of 0.3 in the 1990s to about 0.25 today—and even below for some of the PNGV concept cars (but at significant cost and with the elimination of outside mirrors and other items). Drag reduction is most important during high-speed driving conditions. Improved tires also are providing some benefits, such as traction, reduced noise, and ride comfort. But benefits can be lost if drivers do not maintain properly inflated tires. Cost is a factor, although improvements in tire efficiency affect safety as well.
Propulsion Systems
Conventional Propulsion Systems
Today’s vehicles typically use gasoline or diesel engines as their primary power source. These engine configurations have been developed over the years to provide reliable and easy-to-operate sources of vehicular mechanical power. It is expected that these technologies will continue to evolve and improve over the next decade as well.
The gasoline engine serves most personal transportation vehicles worldwide. Gasoline internal combustion engines (ICEs) burn air-fuel mixtures using spark ignition (SI) to initiate combustion. They are capable of operating over a broad speed range, from several hundred revolutions per minute (rpm) to as high as 7,000 rpm, and of starting rapidly over ambient temperatures ranging from –35°C to well over 38°C.
Much of the improvement in engine efficiency over the last two decades in the United States has resulted indirectly from increasing the engine’s specific power, measured in kilowatts (kW) per liter (rated power per liter of engine displacement). This achievement has enabled engine downsizing of some 58 percent and a 26 percent reduction in the average 0–60 miles per hour (mph) acceleration time (An et al., 2001a; DeCicco et al., 2001). The prospects for further increases in specific power are excellent (Jost, 2002; NRC, 2002), which translates into further engine downsizing while maintaining vehicle performance. Engine downsizing implies reduced engine friction and weight. Specific power has been increased by the addition of valves, fuel injection, improved fuel/air controls, low-friction and lightweight materials, higher engine speed, turbo charging, application of numerical analysis techniques to optimize engine processes, precision manufacturing, and greatly improved quality control. Today, most production gasoline engines rely on a homogeneous stoichiometric fuel/air mixture for the internal combustion process. The choice of this combustion process for production engines stems from its flexibility for operation over broad speed ranges, combined with catalyst exhaust aftertreatment technology to control effectively vehicle exhaust emissions. Although there is little room to improve thermal efficiency significantly for this type of engine, some potential exists to improve part-load engine efficiency by reducing engine friction and pumping losses, resulting in an enlarged high-efficiency area on the engine performance map. This improvement can be achieved by reducing throttling losses through various valve train control technologies. Examples of such technologies include variable valve timing, variable valve lift, and throttleless “valvetronic” engine technology introduced by BMW in its 7-series sedan. Other technologies, such as cylinder deactivation and the ability to vary the com-
pression ratio (see Flynn et al., 1999; Jost, 2002), also improve engine efficiency significantly.
Recently, many engine manufacturers have initiated efforts to develop gasoline direct-injection (GDI) stratified lean combustion processes to improve both engine thermal and part-load efficiency. Japanese manufacturers have introduced this technology to Asian markets. The GDI stratified lean-burn technology presents several new problems for engine designers. Similar to diesel direct-injection engines, the process is initiated with the injection of liquid fuel directly into the combustion chamber, forming regions of stratified rich and lean fuel/air ratios in the combustion space. The rich zones yield carbon-based particulates, which must be trapped with particulate filters. The lean zones yield nitrogen oxide (NOx) emissions combined with available oxygen in the exhaust stream. This combination of NOx emissions and available oxygen render three-way catalyst processes ineffective in removing nitrogen oxides; such systems require the use of new catalyst processes that effectively remove nitrogen oxides from an environment that includes free oxygen.
Diesel engines that have been developed for broad use in passenger and commercial vehicles operate over a somewhat narrower speed range than gasoline engines (Flynn et al., 1999). Today’s diesel engines with high-quality fuel systems operate at speeds of between 500 and 4,000 rpm. In these engines, which operate at higher pressures than spark ignition engines, cylinder combustion is initiated by injecting fuel into high-temperature compressed air, causing compression ignition (CI) (Naber and Siebers, 1996; Dec, 1997; Siebers, 1999). Compared with gasoline engines, diesel engines are more difficult to start rapidly under cold ambient conditions. The minimum starting temperature for diesel engines without special starting aids is typically 0°C. Although diesel engines were once prone to produce more noise and vibration than gasoline engines similar in size, recent design developments have produced smooth running, quiet diesel engine configurations that are barely distinguishable from gasoline engines (Flynn, 2000).
New diesel engines incorporate a wide variety of technologies that improve performance and fuel economy and reduce emissions. Most new diesel engines apply high-injection pressure, which is enabled by a common-rail unit injection system with advanced injection timing management, turbocharging, aftercooling, and an integrated exhaust gas recirculation (EGR) manifold system.
Diesel cars have significantly penetrated markets in Europe and elsewhere, but future emissions standards are likely to challenge the ability of diesels to meet NOx requirements (this is discussed more specifically later in the section Diesel Engine Emissions). At a somewhat higher cost than spark ignition engines, diesels offer improved efficiency and are the technology of choice for hauling heavy loads in freight transport where the fuel savings outweighs the initial capital cost investment.
Figure 4-6 illustrates the performance differences between the three types of propulsion technologies (fuel cell, diesel, and spark ignition) for a vehicle similar to the Volkswagen Golf, using the European driving cycle and based on the present state of technology (Wengel and Schirrmeister, 2000). The potential for improvement exists in each of the technologies. The figure is based on a prototype fuel cell design utilizing hydrogen. Fuel cell propulsion offers advantages in efficiency, especially for low-speed operation and for idling conditions in which the fuel cell output goes to charge batteries or in which the system is shut off (hybrid vehicles also offer similar advantages that are described later in this chapter).
The efficiency curves shown in Figure 4-6 are for a particular vehicle configuration and driving cycle. The relationship between performance and efficiency under different driving conditions is much more complex. Vehicle designers use “performance maps,” a plot of normalized torque— expressed as brake mean effective pressure (BMEP)—from the engine as a
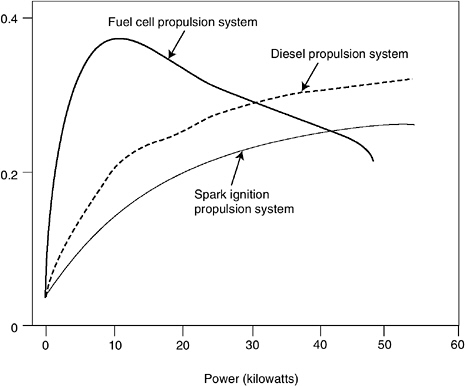
FIGURE 4-6 Comparisons of power train efficiency of combustion engine and fuel cell systems. NOTE: Information based on car similar to a Volkwagen Golf. SOURCE: Wengel and Schirrmeister (2000).
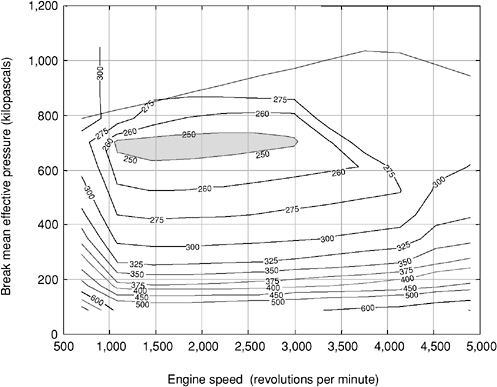
FIGURE 4-7 Typical performance map for a spark ignition engine. NOTE: Brake-specific fuel consumption (BSFC) contours are shown in grams per kilowatt-hour. Performance map based on a 3-liter, 155-brake horsepower (bhp) engine. SOURCE: An et al. (2001a).
function of engine speed in revolutions per minute. Figure 4-7 shows a typical performance map for a spark ignition engine.
Performance maps depict how efficiency varies throughout the range of operation associated with particular driving cycles, with various patterns of requirements for power and acceleration. A shaded region of “maximum efficiency” is indicated in Figure 4-7 (contours are indicated in grams of fuel per kilowatt-hour). As engine torque and speed combinations move outside this region, fuel efficiency drops.
The characteristics of the combustion engine are closely linked to the design of the transmission system to provide the desired performance characteristics for the vehicle. Trade-offs between performance and efficiency occur throughout the driving cycles. For U.S. cars, where fuel economy has been of less concern to the consumer than performance, the trade-off usually favors performance. European and Asian car manufacturers, who are seeking sales where fuel efficiency is valued more than high-speed acceleration and other performance factors, make a different
trade-off in their designs. In the future, however, it appears the stronger emphasis will be on fuel economy because of concerns about foreign oil dependence and GHG emissions.
Emerging Propulsion Technologies
The homogeneous charge compression ignition (HCCI) diesel engine differs from both the typical gasoline and diesel combustion processes in that the energy release does not take place in a flame front. Fuel oxidation is accomplished by inducting a lean premixed charge of fuel and air into the engine cylinder. The lean premixed charge is subsequently compressed to higher temperatures and pressures until reactions similar to those encountered in gasoline engine knock phenomena occur (Westbrook et al., 1991). These reactions take place at temperatures considerably lower than those occurring in flame propagation, but still can be completed in the time allowed for piston engine combustion. If the combination of fuel/ air ratio and starting temperatures and pressures are controlled so that peak combustion temperatures do not exceed 1850 K, the combustion process can proceed to completion without the formation of any particulate or NOx emissions. The temperatures and pressures at which such processes take place are determined by the ignition characteristics of the fuel used. If high-octane fuels such as natural gas are used as the primary fuel for HCCI systems, the indicated efficiency of the process can approach that of the diesel engine. If low-octane fuels such as diesel are used, the pressures and temperatures at which these knock-like reactions take place are too low to allow compression and expansion ratios of above 8:1. Because these expansion ratios are similar to those in gasoline engines, the fuel economy of the cycle using diesel as its main fuel would be similar to that in gasoline engine operation, but without the output of the usual pollutants. Power output also would be low because of the very lean fuel/ air ratio.
Researchers are exploring the HCCI ignition process for use in both light-duty vehicular applications and heavy-duty engine applications. Research presently in the feasibility study phase indicates that significant improvements in light-load efficiency can be achieved when using this process in light-duty gasoline engines. The process is very difficult to control, however, because it depends on reaching specific combinations of pressure and temperature for its initiation. The lack of a spark or injection event to control the initiation of combustion makes it more difficult to coordinate variables such as intake temperature, fuel octane number, or intake pressure, which must be controlled on a cycle-by-cycle basis to manage the process. Because small variations in temperature cause large differences in the times of combustion within the cylinder, it is unclear
whether intake processes can be managed closely enough to control HCCI combustion. Presently, funding of research on the HCCI combustion process is quite large. But it remains to be seen whether viable systems can be developed to incorporate such an approach into the production engine.
Electric propulsion for cars has generated great interest because of its potential for “zero emissions” during use. Emissions may be generated in the production of the electricity, but when the generating plant is located outside of the urban air shed, such emissions may be of less concern to those residing in polluted urban areas, and yet they may be transported hundred of miles to affect the air quality of others. Electric power generation from fossil fuels does produce GHG emissions, however.
The main barrier to the use of electric energy in transportation vehicles is the difficulty in storing electricity. At present, batteries are heavy, cumbersome, and expensive. And charging times are long relative to liquid fueling times for a vehicle. Researchers are seeking a more efficient battery storage system, but a major breakthrough is needed if electric cars are to compete in price, convenience, and range with today’s liquid fuel vehicles. Although applications for electric vehicles do exist, especially for short travel distances, they are unlikely to be a major competitor with conventional vehicle technologies in the next decade or two.
Fuel cell propulsion systems offer an alternative way to produce electricity for propulsion from onboard fuels. Most fuel cells, especially those for transportation applications, operate with hydrogen fuel that can be either stored on board or chemically reformed from gasoline or other liquid hydrocarbon fuels. Liquid methanol can be used as a direct fuel for a fuel cell, but the technology is still far behind the hydrogen fuel cell technology. A fuel cell is an electrochemical device that produces electricity by separating the hydrogen fuel into electrons and protons (hydrogen ions) via a catalyst. Because the fuel is converted directly to electricity, a fuel cell can operate at higher efficiencies than internal combustion engines, extracting more electricity from the same amount of fuel. The fuel cell itself has no moving parts, making it a quiet, reliable source of power.
Fuel cell technologies are presently being developed for a variety of applications (see the appendix to this chapter for a brief description of the alternatives). The most promising fuel cell technology choice for transportation applications is the proton exchange membrane (PEM) fuel cell. These cells operate at relatively low temperatures (about 200°F or 95°C) and have high power density. They can vary their output quickly to meet shifts in power demand and are suited for applications—such as in automobiles—where quick start-up is required. PEM fuel cells are the primary candidates for light-duty vehicles, for buildings, and potentially for much smaller applications such as replacements for rechargeable batteries. The proton exchange membrane is a thin plastic sheet that allows passage of
hydrogen ions. The membrane is coated on both sides with highly dispersed metal alloy particles (mostly platinum) that are active catalysts. Hydrogen is fed to the anode side of the fuel cell where the catalyst encourages the hydrogen atoms to release electrons and become hydrogen ions (protons). The electrons travel in the form of an electric current that can be utilized before it returns to the cathode side of the fuel cell where oxygen has been fed. At the same time, the protons diffuse through the membrane to the cathode, where the hydrogen atom is recombined and reacted with oxygen from the air to produce water, thus completing the overall process.
Comparing Fuel Cell Systems with Gasoline and Diesel Engine Systems
Figure 4-6 compared the typical system efficiencies of a gasoline internal combustion engine, a diesel engine, and a fuel cell for current technologies. Although both gasoline and diesel engines have very low partload efficiencies, the efficiency of a fuel cell system peaks around 20 percent of full load. Figure 4-8 shows how typical gasoline engine efficiency varies with percentage of maximum engine power, along with the operating modes of a U.S. car in an urban driving environment. For U.S. driving behaviors, average engine power demands occur at about 10 percent of maximum engine power. This level is well below peak efficiency for the gasoline and diesel engines, but it is where the fuel cell is most efficient. Thus potentially a fuel cell vehicle can be much more efficient than its internal combustion engine counterparts.
Fuel cell vehicle developers must overcome many technological and economic challenges if they hope to match the performance and cost of today’s conventional technology vehicles. Fundamental problems with fuel cell technology are fuel selection, generation, distribution, and storage. The only truly zero emissions vehicle fuel cell is the direct hydrogen fuel cell. However, hydrogen infrastructure and onboard storage pose a huge challenge. Gasoline infrastructure and onboard storage to provide fuel for fuel cells already exist, but unfortunately a reformer that can convert gasoline to hydrogen adds more weight and technical complexity to a car, and in situ reforming technology is still far off for lower-temperature automotive fuel cell technologies. Furthermore, “reforming” liquid fuels to make hydrogen still generates GHG emissions and deteriorates vehicle start-up and transient performance.
For direct hydrogen fuel cell vehicles, one critical technological issue is onboard hydrogen storage. Hydrogen can be stored on board vehicles in many forms, including as compressed gas, as liquid, or within metal hydride alloys. Table 4-3 compares some competing hydrogen storage technologies and compares those technologies with gasoline and other

FIGURE 4-8 Typical engine efficiency and average driving cycle operating modes for U.S. cars. Basis: Approximate efficiency versus horsepower (hp) curve for a 155 hp engine. SOURCE: Calculations by Feng An.
energy storage media. Both the volume and weight of the hydrogen storage are based on the equivalent performance of 15 gal of gasoline fuel used in a typical U.S. car giving a 400-mile range. It is estimated that about 6 kg of hydrogen are needed to drive a fuel cell vehicle (that is smaller and more efficient) for 400 miles (Ashley, 2001). The comparison in Table 4-3 assumes that the hydrogen fuel cell vehicles are about twice as efficient as diesel vehicles.
The last four columns of Table 4-3 show simply that, compared with gasoline technology, today’s hydrogen storage technology faces challenges in both volumetric efficiency and weight penalties. Furthermore, a hydrogen infrastructure would have to be developed and its costs would be affected by the low density of hydrogen, which would require high-pressure transmission and distribution lines. Because hydrogen also has very wide flammability limits, safety will be a concern, especially during fueling because consumers are accustomed to fueling cars with liquid fuels. Overall, the infrastructure costs will likely run into the billions of dollars.
Beyond technological challenges, the costs associated with fuel cell
TABLE 4-3 Typical Energy Content and Storage Requirements for Automotive Energy Sources
Energy Type | MJ/kg(LHV) | MJ/liter(LHV) | Percent of Gasoline Energy Density | Fuel Storage Quantities Equivalent to 15 Gal Gasoline or 1,800 MJ (ex tank) | |||
Volume, Liters | Volume, Gallons | Weight, Kilograms | Weight, Pounds | ||||
Gasoline | 32.0 | 43.7 | 100 | 56.4 | 15.0 | 40.9 | 90 |
Diesel | 36.0 | 41.8 | 112 | 50.1 | 13.3 | 42.8 | 94 |
Methanol | 16.0 | 20.1 | 50 | 112.8 | 30.0 | 88.9 | 195 |
Methane (STP) | 0.036 | 50.0 | 0.11 | 50,133 | 13,300 | 35.7 | 78.6 |
systems, including fuel cell stacks, system accessories, and the onboard reformer, remain a major barrier to the commercialization of fuel cell technology. Today, gasoline power trains cost around $25 (RMB207) per kilowatt, diesel power trains about $50 (RMB415) per kilowatt, and limited production PEM fuel cells (e.g., the Ballard Model Mark 900), about $500 (RMB4,100) per kilowatt (Ashley, 2001). Fuel cell costs are expected to decrease in the future as technology advances and production grows. The U.S. Department of Energy (2001) estimates that if PEM fuel cells had been mass-produced (500,000 units per year), the cost would have been about $200 (RMB1,700) per kilowatt in 2001 and could be reduced to $125 (RMB1,000) per kilowatt by 2005—the technical target for the proposed U.S. FreedomCAR (Cooperative Automotive Research).
Emissions Control Systems
Gasoline Spark Ignition Emissions
For gasoline internal combustion engines, three-way catalyst systems are highly effective (99+ percent) in achieving Euro II emissions standards. Figure 4-9 portrays the engine out and tailpipe out emissions of a typical three-way catalyst-equipped spark ignition engine. The catalysts, which are composed of mixtures of noble metals supported on a ceramic substrate, are used to eliminate carbon monoxide, nitrogen oxides, and hydrocarbons from gasoline engine exhaust. But they are expensive and can be poisoned by impurities in the fuel—notably lead, which is now being phased out of gasoline in China. The effective operation of these catalyst systems depends on maintaining a stoichiometric fuel/air ratio in the engine’s combustion chamber. This stoichiometric operation provides the catalyst with an oxygen-depleted exhaust stream containing an appropriate level of hydrocarbon emissions so that, in the presence of the catalyst, the reducing atmosphere liberates oxygen from the nitrogen oxides and supplies them to the unburned hydrocarbons for oxidation.
The catalyst combinations required to complete the joint reduction and oxidation processes have been developed after many years of empirical work by engine manufacturers and catalyst suppliers. Because a three-way catalyst is not efficient under cold operating conditions, recent work has focused on reducing tailpipe emissions during a vehicle cold-start, which contributes more than 75 percent of the emissions of modern U.S. cars. Solving the problem requires development of quick “light-off” systems. Cooperation between the various suppliers of the three-way catalysts and the manufacturers of their associated electronic control systems is needed to manage performance during start-up and other transient conditions. Although Chinese industry can supply these components, it has

FIGURE 4-9 Three-way catalyst system behavior versus fuel/air ratio. NOTE: UHC = unburned hydrocarbons; NOx = nitrogen oxides; CO = carbon monoxide; ppm = parts per million. SOURCES: Data replotted from Sher (1998: Figure 6.4); catalyst effectiveness: Kummer (1981).
not yet developed an independent capability for designing and optimizing overall emissions control systems.
Meanwhile, a promising new catalyst technology under development offers much the same efficiency at a substantially lower cost by replacing some of the noble metals currently used with rare earth elements. Use of these less expensive catalysts depends on reducing the sulfur in the fuel to levels significantly below those currently being planned (Zhan et al., 2001).
Diesel Engine Emissions
The diesel combustion process yields emissions of particulates and nitrogen oxides. Just as for the gasoline engine, meeting the most rigorous of the emissions standards proposed today will require applying exhaust aftertreatment devices to diesel engines to bring their emissions of nitrogen oxides, unburned hydrocarbons, and particulates to the desired low levels. Because the exhaust of a diesel engine is cooler and contains more oxygen than that of a gasoline engine operating under stoichiometric conditions, removing the pollutants from the exhaust of a diesel requires a somewhat different technology. The particulates in the diesel exhaust pose an additional problem.
The NOx emissions from diesel engines can be controlled by cooling the diffusion flames within the engine in one of a variety of ways (De Witt and Wan, 2000). The most common is to add diluents, in the form of water-fuel emulsions, inert gases, or recirculated cooled exhaust gas, to the combustion process. All these methods provide additional thermal mass near the diffusion flame and thus limit the overall rise in the flame temperature. The addition of diluents (exhaust gas recirculation or EGR) is the most effective way to control in-cylinder diesel NOx emissions.
As shown in Figure 4-10, the lowest NOx emissions level from diesel engine combustion is 5.5 g per kilogram of fuel burned for engines operating at 1,500 rpm (Flynn et al., 2000). These results at 1,500 rpm translate to lower numbers at higher engine speeds, because NOx conversion is directly proportional to combustion residence times. These levels of NOx production are significantly above the minimum NOx levels produced by gasoline engines operating with effective three-way catalyst systems. Therefore meeting newly legislated NOx emissions targets will require additional aftertreatment of the exhaust gas stream with selective catalytic reduction (SCR) or other techniques to remove nitrogen oxides.
Diesel engines also have particulate emissions. The rich combustion process converts a significant portion of the carbon mass in the fuel to particulate precursors. Those particulate precursors that avoid going through the vigorous diffusion flame are left as tailpipe emissions. The California Air Resources Board (CARB) has labeled diesel particulates as toxic emissions, and such emissions have been associated with degradation in lung function by a variety of epidemiological studies. Particulates also degrade visibility as they accumulate in the atmosphere. As such, to satisfy future particulate emission legislation in the United States the manufacturers of diesel engines probably will have to add exhaust particulate filters to their products. These filters must trap the particulates and then, by managing temperatures, provide an opportunity for the oxidation of the particulates on the trap. Under favorable operational and ambient conditions, this combination of trapping and oxidation can be completed without additional management or manipulation of trap temperatures. If ambient conditions or operational constraints prevent exhaust temperatures (and thus trap temperatures) from rising to the level needed to oxidize the particulates, trap temperatures may require active management through the injection of additional fuel or the modification of engine operation to raise exhaust temperatures.
Fuel Cell Emissions
A fuel cell operating on hydrogen emits only water as a waste stream. However, when fuel cells operate through reforming a fuel such as gaso-

FIGURE 4-10 Limits of diesel combustion at 1,500 revolutions per minute (rpm). NOTE: GISFC is the fuel consumption per net power produced in the compression and expansion strokes of engine operation and thus disregards the gas exchange strokes of engine operation; fsNOx is the NOx emissions on a fuel-specific basis. EGR = exhaust gas recirculation; UHC = unburned hydrocarbons; NOx = nitrogen oxides; g/kg = grams per kilogram; lbm/hp-hr = pounds mass per horsepower-hour. SOURCE: Flynn et al. (2000).
line to produce hydrogen, GHG emissions may be produced by the reformer. Because the reformer operates at a lower temperature than a combustion engine, NOx emissions are negligible. A clean fuel (low sulfur) is required to maintain satisfactory performance of the system. This higher-efficiency propulsion system also provides a benefit in reducing emissions per kilometer.
Meeting Future Emissions Standards
For diesel engines, both the particulate and NOx aftertreatment systems are likely to require active management of the exhaust system temperature and the fuel/air ratio. Presently, such systems are in their earliest demonstration phases, and much work remains to determine whether they can be produced for a wide range of operating requirements and environments. Figure 4-11 presents the European, Japanese, and U.S. emissions standards, along with the demonstrated capabilities of typical
diesel and spark ignition systems. NOx emission levels are depicted in grams per kilogram of fuel burned, a unit that serves to represent the level of technology required for the removal of nitrogen oxides. Because emissions standards are set on a grams-per-mile or grams-per-kilometer basis, as fuel mileage improves, more stringent emissions standards can be achieved. Thus, as shown in Figure 4-11, a car achieving 20 miles per gallon (mpg) might have difficulty meeting the Euro III diesel standard, but if the mileage for that diesel engine were improved to 40 mpg, it could clearly meet the proposed Euro III diesel standard. Figure 4-11 indicates that some level of exhaust aftertreatment would be required to remove nitrogen oxides for diesel engines as the emissions limits are lowered. With three-way catalyst technology, the gasoline engine can achieve or further reduce emissions as required by the U.S. 2007 light-duty standard.
The diesel engine will benefit from many of the possible improvements described earlier for the spark ignition engine—for example, vehicle weight reduction, improved component efficiencies, recovery of kinetic energy during braking, and engine turn-off when stopped. Vehicle hybridization is one way in which to realize the latter two improvements (see the section Hybrid Vehicle Technologies).
The advantages of the diesel engine for hauling heavy loads will continue to make it the leading option for trucks. Now that the pollution produced by trucking is gaining more attention, new emissions standards are being applied to heavy-duty vehicles. The technologies developed for improving the emissions performance of heavy-duty vehicles also may become available for lighter vehicles in the future.
Transmissions
Matching the torque and speed requirements of a vehicle’s drive wheels with that of the engine’s capability requires a transmission that permits a variety of operational gear ratios. Such transmissions can be shifted manually, electromechanically, or automatically from one gear ratio to the next. Mechanical transmissions usually have the highest overall transmission efficiencies, typically between 90 and 97 percent. In recent years, hydrodynamic transmission drives have been augmented with torque converter lockup mechanisms so that the hydrodynamic losses can be minimized when the overall transmission gear ratio is 1:1. Most vehicles in the United States use hydrodynamic automatic transmissions.
Substantial improvements in transmission performance are under way (DeCicco et al., 2001). The main developments are the addition of extra gear ratios to conventional transmissions (five- and six-speed automatics), motor-driven gear ratio shifting (which allows smart electronic control and eliminates the torque converter—a source of friction losses, especially in urban driving), and continuously variable transmissions.

FIGURE 4-11 Fuel-specific nitrogen oxide (NOx) emissions standards versus capability. NOTE: SI = spark ignition; EGR = exhaust gas recirculation. Fuel-specific gravity gasoline = 0.75; diesel fuel = 0.85. SOURCES: Standards: Table 4-1; capabilities: Flynn (2001).
Added gear ratios allow the engine to turn at modest speeds (near the maximum efficiency zone shown in Figure 4-7) over a range of vehicle speed and acceleration conditions. The continuously variable transmission uses more complex technology to approach an infinite number of gear ratios in order to optimize engine speed over variable driving conditions and to permit the engine to always operate in the maximum efficiency zones. The cost implications of these advanced transmission systems are uncertain, but there appear to be enough potential improvement possibilities so that the costs of evolved transmission systems will not have a major impact on vehicle costs.
Some European and Asian vehicle manufacturers have offered production versions of continuously variable transmissions. Such devices typically use tapered belts and pulleys to change effective gear ratios so that the engine is always operating at maximum efficiency. Torque is transmitted through frictional forces at the belt pulley interface, and speed is varied by changing the relative diameter of the input and output pulleys. Today such devices are being offered only on very small vehicles because of the limited torque-carrying capability of such frictional drives.
Electrical Systems
In the early days of automobiles, batteries were used first for lights and then, after the invention of the electric starter in 1912, to start the engine automatically. The generator was developed concurrently. The 6-volt (V) dry cell or lead acid battery was the standard in the first half of the twentieth century. As cars evolved, the 6 V systems proved inadequate, and in the 1950s the industry changed to a 12 V lead acid battery. Since then, the addition of control systems and more electrical amenities in vehicles has steadily increased the electrical power requirement for cars, but large current draws cause voltage drops and significant parasitic power losses in today’s electrical systems. It is estimated that a 12 V system can support only up to 3.5 kW electrical loads. The present average power demand in an automobile is about 1.2 kW. Emerging technologies that will require even greater electrification are discussed later in this chapter.
The industry is considering a transitional dual voltage system, though the car of the future is likely to use a single 36 V (42 V output generator rating) power distribution bus with provision for hybrid operations (direct current and alternating current) and intelligent controls with multivoltage power distribution and load management. Some current production vehicles already are using 42 V machines for the starter-generator. Although these new systems are likely to be introduced first in luxury vehicles because of cost, they also have significant performance advantages for smaller cars. Transition to the higher voltage could reduce both power losses and the weight of wiring harnesses. However, advanced power control and distribution systems will be needed to operate the more complex vehicles of the future.
For vehicles that use electric motors for propulsion, such motors could, in addition to powering accessories, serve as the starter-generator and support regenerative braking, producing higher efficiencies over a wider speed range. The traction motors, however, are still in the developmental stage. Permanent magnet motors require costly materials and are limited in operational speed at 42 V by back emf (back voltage) problems.
Induction motors tend to overheat and thus lose efficiency at 42 V (it is hard to cool a moving rotor). Both induction and permanent magnet motors could benefit from an even higher voltage system, but that creates other problems, including ones of safety. Switched reluctance motors are under development to avoid the problems of back emf and overheating, but the present generation of motors has noise and vibration problems. Further research and development, however, will likely uncover solutions to all these challenges, opening the possibility that over the next decade the rate of introduction of 42 V automotive technologies into passenger cars will increase substantially (Ehsani et al., 2001).
Electronic Controls
Because they provide the increased sophistication needed to meet higher emissions standards while providing good fuel economy and good vehicle drivability, electronic controls have become ubiquitous in modern automobile technology. In fact, in recent years these controls have evolved to digital systems that are fully programmable. At the current level of technology, a programmable digital computer is coupled to advanced sensors that provide real-time data to allow the inference of various engine operating parameters such as specific engine pollutants, fuel consumption, engine horsepower, and engine torque. Using these inputs, the computer instantaneously controls spark, fuel delivery, quantity of exhaust gas recirculated to the engine, and, in some cases, the transmission. Ambient parameters such as temperature and atmospheric pressure also may be measured.
The computer industry can easily provide the hardware to accomplish these tasks, but the bigger challenge is developing the control strategy that will optimize vehicle performance under a wide variety of ambient and driving conditions. Doing so will involve utilizing complex analytical models that relate emissions, fuel economy, and vehicle drivability to detailed operating parameters of the vehicle power train— for example, its engine, transmission, and driveline. These parameters depend on the specific driving conditions and vary over wide ranges between engine idle and full power.
Usually, a limited amount of hardware-specific information is collected in the laboratory on various operating parameters, such as fuel consumption and emissions under specific operating conditions. These data are then fed into analytical models to provide the final control algorithms for each specific engine/vehicle combination. Because of the extraordinary effort devoted to creating the individual algorithms and because the control algorithms are of critical importance to the satisfactory operation of the vehicle, manufacturers consider both the details of the procedure
and the algorithms to be highly proprietary. Algorithms for hybrid designs are significantly more complex and require additional levels of design skills and sophistication.
Emerging Capabilities
The growth in instrumentation and control capabilities in vehicles is leading to new possibilities for diagnosing vehicle problems and expediting repair—perhaps even while the vehicle is in use. Global positioning system (GPS) capabilities already are available to help drivers identify their location and navigate. In the future, these capabilities may extend to automated driving on specially equipped highways and other advanced technologies. Research is under way on automated highways, magnetically levitated vehicles, “drive-by-wire” systems, and other long-term technologies. However, most of these systems are at least a decade or more from realization and probably will require rethinking the traditional ways of delivering mobility to a diversity of consumers.
Fuels and Onboard Fuel Storage
Present Fuel Technologies
China’s present road transportation sector is almost completely dependent on petroleum fuels, with some very limited use of electricity and compressed natural gas. Gasoline and diesel fuels are used widely in motorized vehicles because of their high energy storage density, compact and lightweight storage systems, and low cost relative to other fuels. Table 4-3 shows the energy storage volume and density values for various automotive fuels. Energy equivalent to fifteen gallons of gasoline (1800 MJ) is used as the basis for comparing alternative liquid fuels. For hydrogen, it is assumed that 6 kg of fuel is used (735 MJ) in a smaller, more efficient hydrogen fuel cell vehicle (Westbrook and Chase, 1988; Stodolsky et al., 1999; Wang, 1999; also see Chapter 5). The last four columns indicate the volume and weight of the fuel stored onboard. The last two rows in Table 4.3 show some battery data for comparison.
A liquid fuel storage tank in an automobile weighs less than the fuel it contains, whereas metal hydride storage systems, the heavy-walled pressure tanks required to store compressed gas, and the insulation systems needed for liquid hydrogen storage at very low temperatures can add significant weight penalties. Researchers are aiming for hydrogen storage systems that store about 5–10 percent hydrogen by weight and volume. Much research is under way on the storage possibilities of carbon fibers and other novel media, but significant progress is still needed to make a
hydrogen storage system that does not impose too high a cost, volume, and weight penalty on a car.
The present petroleum fuels (domestic and imported) also will continue to change. To meet the Euro II emissions standards and the even more stringent ones to come, the gasoline (from petroleum) of the future will move toward very low sulfur content, with possible changes in volatility, aromatics, or other specifications driven by the increasingly stringent environmental emissions standards. Diesel fuel (from petroleum) will evolve from its current properties toward very low sulfur content, with possible changes in volatility, polynuclear aromatics, cetane, and other specifications
Some of the near-term alternative fuels might be feasible in China.
Natural gas is being used now as compressed natural gas in limited quantities for bus and taxi fleets in specific locations such as Beijing. CNG (primarily methane) is typically stored in vehicles as a pressurized gas (at about 200 atm pressure).
Methanol from coal or coal bed gas could be used as an additive to gasoline in an M15 (85 percent gasoline–15 percent methanol) mixture or as a pure fuel. Because methanol has a lower energy density than gasoline, it requires a larger fuel tank. Moreover, it is corrosive and so requires special metallurgy, and it is a contact poison and so must be handled with care. Finally, methanol from coal or other sources (such as natural gas) is generally more expensive than gasoline. Methanol fuel can be reformed on board to make hydrogen for a fuel cell. Overall, methanol from coal bed gas does not save net energy or reduce GHG emissions, but it could serve as a domestic fuel alternative for China.
Dimethyl ether (DME) from coal or coal bed gas offers a good alternative to gasoline and diesel. Wang (1999) estimates that DME, even if manufactured from remote gas, would be quite expensive, with a delivered (to the vehicle tank) cost (in 1995 U.S. dollars) ex tax of $1.89 per gallon (RMB4.14 per liter) of gasoline equivalent. For comparison, diesel (50 percent Fischer-Tropsch) would cost $0.65 per gallon (RMB1.42 per liter) and methanol $1.20 per gallon (RMB2.63 per liter) when made from remote natural gas valued at about $0.50 per gigajoule (GJ). Making DME from coal would cost considerably more than making it from remote natural gas. Moreover, manufacturing energy losses would be higher, and carbon dioxide (CO2) emissions would be much higher. DME also is a pressurized gas at normal temperatures (boiling point of –24°C) and thus would require an entirely new and expensive fuel distribution system and new and costly changes in all vehicle fuel tanks and fuel systems. Vehicle range would be lower because of fuel storage limitations, especially for heavyduty trucks.
Biofuels such as ethanol and methanol can be made from agricultural
or other combustible wastes or from farmed energy crops such as corn, grain, or fast-growing cellulosic materials. Basically, biomass energy content is the result of a solar energy conversion process that operates at about 1–2 percent efficiency, so the energy content is relatively low per unit of planted area. Fossil fuels today are the result of eons of biomass conversion. Moreover, account must be taken of the costs and benefits of using land to produce fuel instead of food and of the pollution problems associated with producing biofuels.
Liquefied petroleum gas (LPG), mostly a mixture of propane and butane, has been used for years as a convenient “bottled gas” for remote locations, for camping, and for vehicle fuel. At 5–10 atmospheres (atm) pressure, saturated liquid can be stored at typical ambient temperatures. LPG is usually produced along with oil or natural gas, but it is not as plentiful.
If over the next two decades hydrogen achieves widespread use as a transportation fuel, it will likely be manufactured most economically by reforming natural gas at “service stations” located on a gas pipeline network. It probably will be stored and dispensed as a gas at about 350–400 atm pressure. Other, more expensive options include generating hydrogen from coal (Williams, 1998), electrolysis of water, or reforming natural gas in large, centralized facilities and piping compressed hydrogen or trucking liquid hydrogen to service stations. Any of these methods, however, will require large investments in infrastructure.
Although cars that utilize electric power are considered “zero emissions vehicles,” emissions may still be associated with the original production of the electricity.
Although other technologies are being developed, nickel metal hydride (NiMH) batteries are the technology of choice for automotive applications today, both for hybrids and electric vehicles. Advanced lead acid batteries are less expensive than the NiMH batteries, but have a much shorter operational life.
Electric vehicle batteries currently have specific energy of about 70 watt-hours per kilogram (Wh/kg) and specific power of about 150 W/kg (U.S. Department of Energy, 1999; GMC, 2001). It is assumed that by the year 2020 electric vehicle battery performance will improve, especially the specific energy, and battery performance will be close to meeting the Advanced Battery Consortium’s commercial goals of 150 Wh/kg and 300 W/kg (U.S. Council for Automotive Research, 2000). These commercial goals are judged to be the battery performance required to produce acceptable electric vehicle performance. Although the NiMH battery probably cannot reach this potential, another technology, such as the lithiumion battery, may. Its specific energy is significantly higher than that of the NiMH battery technology. Batteries are not intended to be fully dis-
charged, because such a step shortens their lifetime and decreases their capacity. Also, topping off a battery at a high state of charge is inefficient because of its internal resistance. Thus cycled battery applications tend to operate within a state of charge range of 20–80 percent.
For the entirely electric vehicle, both battery performance and charge density constraints (specific power and specific energy) are important. In addition to providing the power needed for peak motor power, the battery energy storage capacity must be sufficient to give adequate vehicle range. When a battery’s specific energy is too low, the extra battery weight needed adds to the vehicle mass and thus requires additional structural support and increased motor power, generating an undesirable compounding effect. Given this constraint, the battery pack is selected based on its power capacity, and no effort is made to augment vehicle range beyond what the available electric vehicle battery technology can provide. The physical size of the battery also must be considered because of its possible intrusion into the vehicle’s interior space.2
Although some of the fuel alternatives just described may have niche uses in China, a practical view suggests that petroleum fuels will be the main choice for the automobile fleet as it develops over the next few decades. Even for this choice, China will have to make significant investments in new fuel transportation and distribution infrastructure, including cleaning or replacing old facilities that are incompatible with the new, cleaner fuels.
HYBRID VEHICLE TECHNOLOGIES
Hybrid Power Trains
A typical combustion engine delivers peak efficiency only at a particular power level. Today’s cars are designed with oversized engines that are able to provide peak power for acceleration in passing or climbing hills at highway speeds. The engines, therefore, operate inefficiently at low urban speeds with low part-load efficiency (Figure 4-8) and burn fuel while idling in traffic. Table 4-4 lists the time and fuel use shares during
vehicle stops and braking decelerations for a typical U.S. car for urban driving cycles in the United States, Japan, and Europe. The table reveals that a vehicle spends a significant amount of time and fuel during both stops and braking decelerations and that the fuel saving potential for engine idle-off is very large. If engine start-stop is designed to recover energy losses during vehicle stops only, about 12–19 percent of fuel could be saved for a vehicle operating in these cycles. The fuel savings would be even higher if engine start-stop were designed to recover all engine idling losses. This savings can be facilitated through hybridization.
Many different types of hybrid vehicles have been developed (Rovera and Mesaiti, 1999). In general, a hybrid is designed with an engine that is smaller than that needed for a similar nonhybrid car. The hybrid’s smaller combustion engine (spark ignition or diesel) operates closer to its peak efficiency, which occurs near its maximum power output (a larger engine would be operating at lower efficiency at the same power output). The engine can be shut off during vehicle stops, braking decelerations, and even low-power driving, depending on the specific design of the hybrid system. A rechargeable battery system is used to provide extra power on demand. At low speeds or while the vehicle is stopped, unless the engine is shut off, the combustion engine uses excess power to recharge the battery system. The most efficient hybrid vehicle configuration also captures the regenerative energy from braking the car and uses it to recharge the battery. This type of hybrid offers major improvements in efficiency in urban driving cycles and results in lower total emissions because of the smaller engine—which is switched off at idle if the battery system is fully charged.
The disadvantages of hybrids are the extra materials and weight asso-
TABLE 4-4 Percentage of Time Spent and Fuel Consumed by a Typical U.S. Car during Vehicle Stops and Braking in Different Urban Driving Cycles
ciated with a parallel electric drive system and with the battery system. Costs and some vehicle efficiency penalties are associated with the added components, and the larger the battery system, the higher the added costs and the greater the weight. For urban driving, a relatively small battery system matches the stop-and-go driving that allows frequent draw-down and recharging of the battery. In highway driving, the battery may not recharge at all, and there is the danger that it may be discharged, at which point the car loses power because it is operating on an underpowered combustion engine. For this reason, the Toyota Prius sold in the United States has both a larger engine and a larger battery system than the Japanese model.
Today’s hybrid electric vehicles (HEVs) have three basic configurations:
The series HEV configuration, in which the engine drives a generator that produces electricity, which in turn powers a motor to drive the wheels and, during periods of low power demand, charges the battery. Braking energy also can be used to charge the battery. This configuration is called a series hybrid because the power flows along a single path.
The parallel HEV configuration, in which both the engine and motor drive the vehicle wheels. Because the power flows along two paths, this configuration is called a parallel system. This system also allows the engine to charge the battery on board and recover braking energy.
The power-split HEV configuration, which is closer to the parallel configuration. It differs in that a planetary gear system combined with a starter-generator can transfer power between the internal combustion engine and electric motor, both of which are coupled to the drive shaft. In this configuration, the internal combustion engine provides the primary power, with a power-split device (planetary gear with starter-generator) sending power to both the drive shaft and the electric motor. This system is sometimes called an electrically variable transmission system (Toyota, 1997).
A series HEV is technically the simplest; however, it usually requires large electrical components, and thus it is heavier and more expensive. Most hybrid city buses and heavy-duty urban trucks use series configurations. The most popular choice for today’s commercial and prototype light-duty HEVs is the parallel configuration. It requires more complicated system integration, but it is lighter, more efficient, and less costly than the series system (yet more expensive than the nonhybrid technologies). The power-split system is technically more complicated, but potentially can achieve the highest efficiency.
Categories of Hybrid Vehicles
In principle, hybrid propulsion can take many forms, from slight degrees of hybridization (e.g., using an integrated starter-generator with engine start-stop capability) to designs that drive the wheels only electrically. HEVs can be classified according to the portion of their maximum propulsion power provided by an electric drive:
Minimal (or mini) hybrid—fraction of onboard electric power less than about 10 percent. It can provide engine idle-off capability, but no regenerative braking and electric-only driving. The minimal hybrid usually uses a low-voltage integrated starter-generator, and its fuel economy benefit under U.S. driving conditions is about 10 percent.3
Mild and medium hybrid—fraction of electric power ranges from 10 to 25 percent; idle-off and some regenerative braking, but no significant electric-only driving (example: Honda Insight). The fuel economy benefit of such HEVs under U.S. driving conditions is about 10–30 percent.
Full hybrid—fraction of electric power ranges from 25 to 50 percent; some electric-only driving but no real trip range, and battery not designed for plug-in recharging (example: Toyota Prius). Full HEVs are sometimes called “power” hybrids. The fuel economy benefit of such HEVs under U.S. driving conditions is about 30–50 percent.
Energy HEVs (also called “charge depletion hybrids”) have a useful all-electric driving range (50 miles or more) and plug-in recharging ability. But they require a large battery pack and are considerably more expensive than the other hybrids. No energy hybrids have been announced for mass production. Another reason may be that battery technologies remain too limited to provide adequate combinations of efficiency and performance even when supplemented by an engine-powered generator. Batteries are certainly a major cost factor for all hybrids, and so like pure electric vehicles energy hybrids will carry a very substantial cost premium for the foreseeable future.
A full hybrid is considered a more radical change than the other hybrids from the conventional internal combustion engine vehicle, whereas a mini or mild hybrid is considered a more natural evolution from a conventional vehicle, resulting from a historical trend of increasing vehicle onboard electric power. The vehicle electric power growth rate was about
6 percent from 1920 to 1940, 2 percent from 1940 to 1970, and again 6 percent from 1970 to 1990 (An et al., 1999; Moore, 1999). Industry projections indicate this electrification trend will continue and probably grow. Typical U.S. cars have an onboard electric power requirement of about 1.2 kW. This electric power requirement will increase to 3–5 kW over the next few years because of the addition of features such as heated seats and windows, multimedia, water/oil pumps, power steering, HVAC (heating, ventilating, air-conditioning) fans, electromagnetic valves, and heated catalysts.
Currently, most major auto manufacturers and suppliers are working on the so-called “integrated starter-generator” system, which will increase onboard electric power to about 10–15 kW and support features such as fast crank, torque smoothing, engine idle-off, and launch assist, and a certain degree of regenerative braking. The Honda Insight hybrid vehicle falls into this category. When electric power increases to 20 kW, the vehicle’s internal combustion engine can be further downsized, with such added features as electric HVAC, power assist, fast heating, and limphome capability (if out of fuel for the engine). DaimlerChrysler’s ECX2 is in this category. Vehicles with onboard electric power capability of 10–20 kW are often called mild hybrid vehicles. All major U.S. and European manufacturers are pushing for this concept of hybrid vehicle, along with standardization of a 42 V electrical system. Toyota recently released a mild hybrid option for its luxury Crown model.
When onboard electric power increases beyond 20 kW, as in the Toyota Prius and in proposed fuel cell hybrid vehicles, it finally reaches the so-called full hybrid vehicle territory. A full hybrid vehicle with a significantly downsized engine and large electric motor, combined with electrically variable transmission technologies like those developed by Toyota and Nissan (Toyota, 1997), will achieve the maximum benefit from vehicle hybridization. But consumers may find full hybrid technology too costly, placing the technology at high risk of weak customer acceptance without government or manufacturer subsidies.
Comparing Commercial and Concept HEVs
In recent years vehicle manufacturers have made great progress in developing and demonstrating commercially available and concept hybrid electric vehicles. These vehicles include commercially available gasoline hybrid cars (Toyota Prius and Honda Insight) and the diesel hybrid concept cars (Ford Prodigy, GM Precept, and DaimlerChrysler ESX3) that emerged from the Partnership for a New Generation of Vehicles (see Chapter 8). Table 4-5 summarizes some basic characteristics of selected commercial and concept HEVs in the United States (An et al., 2001b). Data
sources are specified in the table because some reported figures are not always consistent among different sources, and some figures may not represent official or certified figures. For example, only Prius and Insight have fuel economy ratings certified by the U.S. Environmental Protection Agency. Other fuel economy figures are based on manufacturers’ claims.
In Figure 4-12, the fraction of electric power of selected HEVs is estimated by dividing peak motor power by total combined peak motor and internal combustion engine power. Note that this figure gives only an approximate measure because the power split during operation is variable.
Assessing the Benefits of Hybrid Vehicle Fuel Economy
Because PNGV and other hybrid vehicles have such expensive drive trains, they have employed unprecedented levels of conventional vehicle fuel economy technologies such as aggressive load reduction measures. These measures include reducing weight and improving air/tire resistance as well as using lightweight materials and diesel engines to reduce weight. The choice of diesel engines for PNGV vehicles is a result of setting high efficiency goals within a five-year time horizon. The Fraction of electric power (percent)
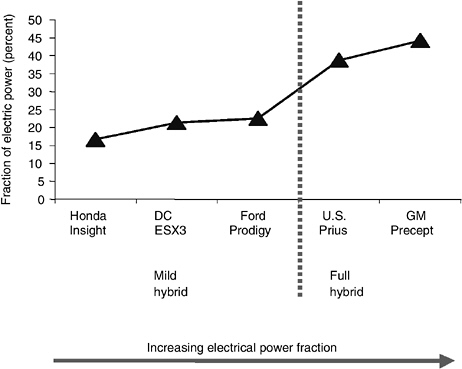
FIGURE 4-12 Fraction of electric power of selected hybrid electric vehicles. SOURCE: An et al. (2001b).
TABLE 4-5 Characteristics of Commercial and Prototype Hybrid Electric Vehicles
HEV | Type | Status | Curb Weight (lbs) | Power Plant Type | Engine Size (liters) | Engine Power (hp) | Battery Type | Motor Peak (kW) | Transmission Type | CAFE (mpga) | 0–60 Time (s) |
U.S. Prius | Gasoline hybrid | Commercial | 2,765 | SI I-4 | 1.5 | 70 | NiMH | 33 | CVT | 58 | 12.1 |
Honda Insight | Gasoline hybrid | Commercial | 1,856 | SI I-3 | 1.0 | 67 | NiMH | 10 | M5 | 76 | 10.6 |
Ford Prodigyb | Diesel hybrid | Concept car | 2,387 | CIDI I-4 | 1.2 | 74 | NiMH | 16 | A5 | 70 | 12.0 |
DC ESX3 | Diesel hybrid | Concept car | 2,250 | CIDI I-3 | 1.5 | 74 | Li-ion | 15 | EMAT-6 | 72 | 11.0 |
GM Preceptc | Diesel hybrid | Concept car | 2,590 | CIDI I-3 | 1.3 | 59 | NiMH | 35 | A4 | 80 | 11.5 |
a CAFE fuel economy rating represents combined 45/55 miles per gallon (mpg) highway/city fuel economy and is based on an unadjusted figure. b On the basis of the starter-generator rated 31 kilowatts (kW) for continuous, 8 kW for three minutes, and 35 kW for three seconds (s); 16 kW is assumed for a 12-second 0– 60 acceleration. c The front motor is 25 kW and rear motor 10 kW. Therefore, the total motor peak power is 35 kW. NOTE: HEV = hybrid electric vehicle; CAFE = Corporate Average Fuel Economy; SI = spark ignition; CIDI = compressed ignition direct injection; NiMH = nickel metal hydride; Li-ion = lithium-ion; CVT = continuously variable transmission; M5 = manual five gear; A5 = automatic five gaear; EMAT = electro- mechanical automatic transmission; hp = horsepower. SOURCES: U.S. Prius: EV News (2000); all HEVs except U.S. Prius: NRC ( 2000); Honda Insight: Automotive Engineering (1999); ESX3: Automotive Engineering (2000): GM Precept press release. | |||||||||||
associated emissions and cost impacts were considered secondary in this context.
It is important to understand to what extent the gains in fuel economy are actually achieved through the conventional technologies, on the one hand, and how much are obtained through “pure” hybrid technologies and systems, on the other. Four common elements that contribute to gains in fuel economy for these commercial and concept HEVs are:
choice of high-efficiency diesel engines for the three PNGV hybrid vehicles
aggressive load reduction measures that lower vehicle air and tire drag losses, as well as overall vehicle weight
engine downsizing to utilize a smaller, more advanced onboard combustion engine, as well as implementation of a more advanced transmission system
system electrification and hybridization to utilize electric power to optimize system efficiency, turning off the engine during idling, and provision of regenerative braking.
It is not easy to estimate the fuel economy benefits of “pure” hybrid technologies. First, hybrid benefits depend strongly on the driving cycle. The fuel economy benefits of hybrid electric vehicles are much higher under stop-and-go traffic conditions than under free-flow highway driving conditions. Thus the fuel economy benefits of HEVs in China’s large cities should be higher than those in the United States. Second, there is no doubt that conventional technologies include all the measures in items 1 and 2 and that hybrid technology includes all the measures in item 4. It is less clear, however, how item 3 should be categorized, because hybrid technologies usually require synergies from conventional technologies to deliver the best benefits. It would then seem that the hybrid benefits are more than item 4 alone, but somewhat less than the combination of items 3 and 4 (An et al., 2001b; DeCicco et al., 2001). Figure 4-13 presents the improvement in U.S. fuel economy by each technology element for the selected HEVs.
Issues Surrounding Fuel Cell Hybridization
Uncertainties are associated with whether hybridization would benefit fuel cell vehicles (Table 4-6). In terms of system efficiency, unlike in internal combustion engines where the engine efficiency increases with the power demand, the efficiency of fuel cell stacks peaks at a low power point and decreases as power demand approaches either the maximum or

FIGURE 4-13 U.S. fuel economy (gasoline equivalent) through elements of dieselization, load reduction, engine downsizing, and hybrid optimization. SOURCE: An et al. (2001b).
minimum level. For vehicles with onboard reformers, the efficiency of the reformer’s transient operation can differ dramatically from that of its steady-state operation. As for performance, the transient response time of fuel reformers is a critical issue and has a profound implication for the benefits of hybridization (the addition of batteries or other energy storage devices). In terms of system costs, the trade-off between the reduced cost associated with downsizing a fuel cell system and the added cost of batteries and other hybrid components should be assessed. The benefits and
TABLE 4-6 Trade-offs for Hybridizing Fuel Cell Vehicles
Trade-off | Fuel Cell Vehicles | Hybrid Fuel Cell/Battery |
Fuel cell stack efficiency | High | Reduced because of downsizing |
Regenerative braking | None | 10–20+ percent in urban driving |
Cold start | Slow | Rapid |
Specific weight (kilograms/kilowatt) | High | High to medium |
Price | Fuel cell price high, but dropping rapidly | Battery price relatively low, but not dropping as quickly as fuel cell |
Overall | Long term, favorable | Near to medium term, favorable |
SOURCE: Society of Automotive Engineers (2001, 2002). | ||
trade-offs of hybridizing fuel cell vehicles not only differ from those from hybridizing conventional internal combustion engine vehicles, but also differ among different kinds of fuel cell systems.
Hybridization Summary
In spite of the many advantages of the hybrid vehicle, hybrid technologies are still quite expensive and add up to 20 percent to the cost of a vehicle. Hybrid electric vehicles are many years from taking a significant market share from the conventional internal combustion engine vehicles. In turn, the economies of scale needed to reduce their cost disadvantage probably will not be realized for many years. In the meantime, some of the first steps toward hybrid technologies—the integrated starter-generator, for example—will begin to appear in commercial products. In the United States, expensive features such as hybridization are more likely to appear in higher-priced (or subsidized) vehicles before they make their way into the wider commercial markets.
SYSTEM INTEGRATION AND MANUFACTURING
The preceding sections have described the status of the major components of a modern automobile. In China, many car components are already being manufactured for assembly in local plants and for export. Moreover, local vendors are involved in technology transfer and improvement on the component level, although entry into the World Trade Organization (WTO) will create pressure on component manufacturers to be more cost-competitive. Yet car design requires sophisticated techniques for integrating all these components—and ultimately for satisfying customer requirements for performance, safety, comfort, and convenience— to produce a cost-competitive, reliable vehicle. The leading global automakers have had years of experience in producing and marketing cars, and they continue to refine their system design and integration skills in order to maintain or improve their competitive position in the marketplace. Consequently, these skills are considered highly proprietary and are carefully guarded.
At present, China’s automotive industry is well behind global automotive industry leaders in design and system integration capabilities. China has some world-class auto production plants, but these rely on the expertise of foreign partners who are reluctant to transfer this expertise to their Chinese partners. If China is to compete in the future as a worldclass auto manufacturer, it must build expertise in these critical areas. In future joint ventures and similar partnerships with foreign automakers, it
will be important for the Chinese partner to demand training and full inclusion in design and integration activities—at least for cars that will be developed for the Chinese market. Because Chinese automakers are likely to better understand Chinese consumers and their buying patterns, foreign partners may be willing to relax proprietary concerns in the code-velopment of models that meet the needs of Chinese consumers. Yet under WTO such partners also can compete directly in Chinese markets. Therefore, the Chinese should be prepared to bring some special capabilities into partnerships in exchange for training and knowledge transfer.
Manufacturing Implications
World-class producers of vehicles must not only design high-quality vehicles, but also produce them in efficient facilities. In any discussion of manufacturing, it is useful to separate the vehicle assembly operations from the manufacture of major components such as engines and transmissions. Major components are normally manufactured in high-capacity, highly automated plants. Because a large fraction of the tools found in these facilities are made by a few worldwide machine tool manufacturers, any facilities built in China can possess the latest technologies. Furthermore, because of the high cost of the facilities, several vehicle manufacturers may use the same components purchased from external suppliers, allowing an economy of scale in production that benefits all participants. As noted in Chapter 3, component suppliers Robert Bosch, Engelhard, and Corning already have subsidiaries in China that are following this pattern. Whether the Chinese industry chooses to compete with the large component suppliers or to allow foreign manufacturers to dominate this part of the market is largely an economic issue and not one of technical capability.
China has experience with vehicle assembly in modern plants, but these plants have been mostly ones transplanted from overseas through joint venture partners. Because the volumes for the Chinese car market will not at first be large for any single manufacturer, these facilities must be flexible enough to allow the assembly of more than one vehicle type. This flexible technology is just appearing in foreign facilities, but it is expected to find greater uses as the market continues to fracture into smaller niches. Besides, as just noted, the latest tools for an assembly plant can be purchased from the worldwide machine tool industry.
Unfortunately, even having the latest tools in the most modern facilities does not guarantee efficient operation. Japanese manufacturers, through their highly developed “lean” manufacturing processes and through the colocation of major component and assembly plants, are able to assemble a vehicle in about half the number of worker-hours
characteristic of American manufacturers (Dassbach, 1994). Through years of sustained effort, Japanese manufacturers also have developed a reputation for the highest quality products. To compete worldwide, the Chinese automotive industry will need to develop the management capability to operate its factories in the most efficient manner while paying close attention to quality. China has a major asset in its intelligent, hard-working people, who provide skilled labor at wages that are low relative to the average in the member countries of the Organisation for Economic Co-operation and Development (OECD), but it will need to examine carefully its capability to manage that workforce in the most efficient manner.
Choosing Competitive Technologies
As discussed in Chapter 3, a variety of cars are already being produced successfully in China. Most of these employ foreign technology, adapted to some extent to meet special Chinese needs, through a variety of partnerships and joint ventures with Chinese companies. If the Chinese automotive industry wishes to compete in open international markets or to compete with products coming to China from these markets, it must find technologies or market niches in which it is able to compete successfully. In Figure 4-14, the estimates by Weiss et al. (2000) are replotted to show life cycle energy as a function of life cycle cost for the technologies considered. If China is to compete successfully in the manufacture of lower-cost cars, it would seem prudent to select technologies that do not start out with a potentially significant cost penalty.
As shown in Figure 4-14, the overlap in the energy use and cost projections for technology alternatives is large, especially for the advanced technologies for which the uncertainty ranges are largest. These uncertainty ranges will be reduced over the next decade or so as advanced technologies mature from the present stage of development. Therefore, much more risk is associated with future competitiveness if major investments are made now by China to develop hydrogen fuel cell or electric cars, or even full hybrids, rather than in the future. A near-term focus on more conventional technologies still allows many opportunities for innovations that will enhance the competitiveness of a China car.
APPENDIX: OTHER TYPES OF FUEL CELLS
Of the many types of fuel cell, some are being developed for stationary power generation. These systems are more appropriate for steady-state operation because they require the maintenance of a special environ-

FIGURE 4-14 Estimated energy versus cost ranges for selected technologies per kilometer. NOTE: Shaded areas represented uncertainties in prediction; CNG = compressed natural gas. SOURCE: Weiss et al. (2002).
ment. Thus such systems may not yet meet the rapid start-up requirement of an automobile and are likely to perform inefficiently in a lightly loaded automotive duty cycle. Descriptions of some of the fuel cells likely to find commercial uses over the next several decades follow:
Phosphoric acid. This type of fuel cell, which is commercially available, is used mostly for stationary power sources. Phosphoric acid fuel cells generate electricity at more than 40 percent efficiency—and nearly 85 percent of the steam this fuel cell produces is used for cogeneration. Operating temperatures are in the vicinity of 400°F or 200°C.
Molten carbonate. Molten carbonate fuel cells, which promise high fuel-to-electricity efficiencies, operate at about 1,200°F or 650°C. To date, molten carbonate fuel cells have been operated using hydrogen, carbon monoxide, natural gas, propane, landfill gas, marine diesel, and simulated coal gasification products. Molten carbonate fuel cells of 10 kW to 2 megawatts (MW) have been tested on a variety of fuels. Carbonate fuel cells for stationary applications have been successfully demonstrated in Japan and Italy.
Solid oxide. Another highly promising fuel cell, the solid oxide fuel cell (SOFC), could be used in large, high-power applications, including
industrial and large-scale central electricity generating stations. Some researchers also foresee the use of solid oxide in motor vehicles and are developing fuel cell auxiliary power units with SOFCs. A solid oxide system usually uses a hard ceramic material instead of a liquid electrolyte, allowing operating temperatures to reach 1,800°F. Power-generating efficiencies could reach 60 percent. One type of SOFC uses an array of meter-long tubes, and other variations include a compressed disc that resembles the lid of a soup can. Tubular SOFC designs are closer to commercialization and are being produced by several companies. Demonstrations of tubular SOFC technology have produced as much as 220 kW.
Still other fuel cells are not likely to be commercialized in the next few decades:
Alkaline. Long used by the U.S. National Aeronautics and Space Administration (NASA) on space missions, these fuel cells can achieve power-generating efficiencies of up to 70 percent. They use alkaline potassium hydroxide as the electrolyte. Until recently, these fuel cells were too costly for commercial applications, but several companies are examining ways to reduce costs and improve operating flexibility.
Direct methanol fuel cells. These cells are similar to the proton exchange membrane fuel cell (see the section Emerging Propulsion Technologies) in that they use a polymer membrane as the electrolyte. However, in the direct methanol fuel cell, the anode catalyst itself draws the hydrogen from the liquid methanol, eliminating the need for a fuel reformer. Efficiencies of about 40 percent are expected with this type of fuel cell, which would typically operate at a temperature of between 120° and 190°F or 50° and 90°C. Higher efficiencies are achieved at higher temperatures.
Regenerative fuel cells. Still a very young member of the fuel cell family, regenerative fuel cells would be attractive as a closed-loop form of power generation, in conjunction with a solar power source. Solar power can be converted directly to electricity, but there may be applications where the energy losses associated with a regenerative fuel cell are justified. During solar collection, water is separated into hydrogen and oxygen by a solar-powered electrolyzer. The hydrogen and oxygen are then available to be fed into the fuel cell, which is able to generate electricity, heat, and water when direct solar power is not available. The water is then recirculated back to the solar-powered electrolyzer and the process begins again. NASA and others are currently conducting research on these types of fuel cells.
REFERENCES
An, F., F. Stodolsky, and D. Santini. 1999. Hybrid Options for Light-Duty Vehicles. SAE Technical Paper No. 1999-01-2929. Society of Automotive Engineers.
An, F., J. DeCicco, and M. Ross. 2001a. Assessing the Fuel Economy Potential of Light-Duty Vehicles . SAE Technical Paper No. 2001- 01FTT-31, SAE Special Publication (SP-1637) on New Energy Systems and Environmental Impacts. Society of Automotive Engineers.
An, F., A. Vyas, J. Anderson, and D. Santini. 2001b. Evaluating Commercial and Prototype HEVs. SAE Technical Paper No. 2001-01-0951. Society of Automotive Engineers.
An, F., D. Freidman, and M. Ross. 2002. Near-Term Fuel Economy Potential for Light-Duty Trucks. SAE Technical Paper No. 2002-01-1900. Society of Automotive Engineers.
Ashley, S. 2001. Fuel cells start to look real. Automotive Engineering (March).
Automotive Engineering. 1996. Life cycle analysis: Getting the total picture on vehicle engineering alternatives. (March):49–52.
———. 1999. ESX3. (October):55.
———. 2000. Dodge’s mild hybrid. (May):32.
Chinese State Environmental Protection Agency. 1999. Technical Policy on Prevention and Control of Motor Vehicle Pollution. Beijing.
Dassbach, C. 1994. Where is North American automobile production headed? Low-wage lean production. Electronic Journal of Sociology 1(1).
Davis, B. H. 1999. Transportation Energy Data Book: Ed. 19. ORNL-6958. Oak Ridge National Laboratory, September.
Dec, J. E. 1997. A Conceptual Model of DI Diesel Combustion Based on Laser-Sheet Imaging. SAE Technical Paper No. 970873. Society of Automotive Engineers.
DeCicco, J., F. An, and M. Ross. 2001. Technology Options for Improving the Fuel Economy of U.S. Cars and Light Trucks by 2010–2015. American Council for an Energy Efficient Economy, Washington, D.C., April.
De Witt, M. J., and C. Z. Wan. 2000. Establishing capabilities to evaluate reductants for NOx adsorber technologies. Paper presented at the 6th Diesel Engine Emissions Reduction Workshop, August.
Ehsani, M., A. Emade, and H. Gao. 2001. 42V Automotive Power Systems. SAE Technical Paper No. 2001-01-2465. Presented at the Future Transportation Technology Conference, Costa Mesa, Calif., August. EV News. 2000. June.
Flynn, P. F. 2000. Diesels—Promise and issues. Paper presented at the 6th Diesel Engine Emissions Reduction Workshop, August.
———. 2001. Diesels 2007—Promise and problems. Paper presented at the 7th Diesel Engine Emissions Reduction Workshop, August.
Flynn, P. F., R. P. Durrett, G. L. Hunter, L. A. Farrell, and O. C. Akinyemi. 2000. Minimum Engine Flame Temperature Impacts on Diesel and Spark-Ignition NOx Production. SAE Technical Paper No. 2000-01-1177. Society of Automotive Engineers.
Flynn, P. F., R. P. Durrett, G. L. Hunter, A. O. zur Loye, O. C. Akinyemi, J. E. Dec, and C. K. Westbrook. 1999. Diesel Combustion: An Integrated View Combining Laser Diagnostics, Chemical Kinetics, and Empirical Validation. SAE Technical Paper No. 1999-01-0509. Society of Automotive Engineers.
General Motors Corporation (GMC). 2001. Well-to-Wheels Energy Use and Greenhouse Gas Emissions of Advanced Fuel/Vehicle Systems: North American Analysis. Executive Summary Report, Detroit, April.
Höhlein, B., J. Nitsch, and U. Wagner. 1998. Brennstoffzellen-Studie (Fuel Cell Studies): Vorhaben Nr. 686, Ganzheitliche Systemuntersuchung zur Energiewandlung durch Brennstoffzellen. Forschungsvereinigung Verbrennungskraftmaschinen e.V., Frankfurt am Main.
Horton, E. J., and W. D. Compton. 1984. Technological trends in automobiles. Science 225:588.
Jost, K. 2002. Spark-ignition engine trends. Automotive Engineering International (January).
Kummer, J. T. 1981. Catalysts for automobile engine control. Progress in Energy and Combustion Science 6:177–199.
Moore, B. 1999. Advanced energy systems. Paper presented at the SAE Topical Technology Workshop on Hybrid Electric Vehicles: Here and Now (TOPTEC). SAE (Society of Automotive Engineers) International, Warrendale, Pa.
Naber, J. D., and D. L. Siebers. 1996. Effects of Gas Density and Vaporization on Penetration and Dispersion of Diesel Sprays. SAE Technical Paper No. 960034. Society of Automotive Engineers.
National Research Council (NRC). 2000. Review of the Research Program of the Partnership for a New Generation of Vehicles. Sixth Report. Washington, D.C.: National Academy Press.
———. 2002. Effectiveness and Impact of Corporate Average Fuel Economy (CAFE) Standards. Washington, D.C.: National Academies Press.
Office of Technology Assessment. 1995. Advanced Automotive Technologies: Visions of a Super-Efficient Family Car. OTA-ETI-638. Washington, D.C.: Government Printing Office.
Ogden, J. M., M. M. Steinbugler, and T. G. Kreutz. 1999. A comparison of hydrogen, methanol, and gasoline as fuels for fuel cell vehicles: Implications for vehicle design and infrastructure development. Journal of Power Sources 79:143–168.
Pembina Institute. 2000. Climate-Friendly Hydrogen Fuel: A Comparison of the Life-Cycle Greenhouse Gas Emissions for Selected Fuel Cell Vehicle Hydrogen Production Systems. Pembina Institute, Drayton Valley, Alberta, March.
Rovera, G., and D. Mesaiti. 1999. The general purpose hybrid vehicles. Paper presented at the SAE Topical Technology Workshop on Hybrid Electric Vehicles: Here and Now (TOPTEC). SAE (Society of Automotive Engineers) International, Warrendale, Pa.
Sher, E., ed. 1998. Handbook of Air Pollution from Internal Combustion Engines: Pollutant Formation and Control. Boston: Academic Press.
Siebers, D. L. 1999. Scaling liquid-phase fuel penetration in diesel sprays based on mixing limited vaporization. Paper presented at 1999 Congress of the Society of Automotive Engineers, Detroit, February.
Sierra Research. 1997. Automotive fuel economy potential using cost-effective design changes. Sierra Research, Buffalo, N.Y.
Singh, M., R. Cuenca, J. Formento, L. Gaines, B. Marr, D. Santini, M. Wang, S. Adelman, D. Kline, J. Mark, J. Ohi, N. Rau, S. Freeman, K. Humphreys, and M. Placet. 1998. Total Energy Cycle Assessment of Electric and Conventional Vehicles: An Energy and Environmental Analysis. ANL/ES/RP-96387, Argonne National Laboratory.
Society of Automotive Engineers. 2001. Fuel Cell Power for Transportation 2001. SAE SP-1589.
———. 2002. Fuel Cell Power for Transportation 2002. SAE SP-1691.
Stodolsky, F., L. Gaines, C. Marshall, and F. An. 1999. Total Fuel Cycle Impacts of Advanced Vehicles. SAE Technical Paper No. 1999-01-0322. Society of Automotive Engineers.
Toyota. 1997. Prius Product Information 2000. Toyota Hybrid System, Toyota Press Information 1997.
U.S. Council for Automotive Research. 2000. U.S. Advanced Battery Consortium Battery Criteria: Commercialization. Online. USCAR. Available at www.USCAR.org. Accessed May 2000.
U.S. Department of Energy. 1999. Hybrid electric vehicle component information. Online. Available at www.hev.doe.gov/components/batteries.html. Accessed June 13, 2002.
———. 2001. Fuel Cells for Transportation. 2001 Annual Progress Report, December.
Wang, M. Q. 1999. GREET 1.5—Transportation Fuel-Cycle Model, Volume I: Methodology, Development, Use, and Results . ANL/ESD-39. Argonne National Laboratory, August.
Wang, M. Q., and H.-S. Huang. 1999. A Full Fuel-Cycle Analysis of Energy and Emissions Impacts of Transportation Fuels Produced from Natural Gas. ANL/ESD-40. Argonne National Laboratory, December.
Weiss, M. A., J. B. Heywood, E. M. Drake, A. Schafer, and F. F. AuYeung. 2000. On the Road in 2020: A Life-Cycle Analysis of New Automobile Technologies. MIT Energy Laboratory Report #MIT-EL-00-003. Massachusetts Institute of Technology, Cambridge.
Wengel, J., and E. Schirrmeister, eds. 2000. The Innovation Process from the Internal Combustion Engine to Fuel Cells. Fraunhofer-Institute, Karlsruhe, Germany, February.
Westbrook, C. K., and L. K. Chase. 1988. Chemical Kinetics and Thermochemical Data for Combustion Applications. Lawrence Livermore National Laboratories Report UCID-17833.
Westbrook, C. K., W. J. Pitz, and W. R. Leppard. 1991.The Autoignition Chemistry of Paraffinic Fuels and Pro-Knock and Anti-Knock Additives: A Detailed Chemical Kinetic Study. SAE Technical Paper No. 912314. Society of Automotive Engineers.
Williams, R. 1998. Fuel cells, coal, and China. Paper presented at the Ninth Annual U.S. Hydrogen Meeting: Implementing a Global Solution, Washington, D.C.
Zhan R., R. Hurley, W. Han, J. A. Lymburner, D. Schuetzle, J. Li, G. Wu, L. Xu, H. S. Gandhi, R. Huang, and D. Deng. 2001. The Development of Low Precious-Metal, Rare-Earth Oxide (Reo) Catalysts for Vehicle Emission Control in Emerging Markets. SAE Technical Paper No. 2001-01-0225. Presented at the SAE 2001 World Congress, March, Detroit. Society of Automotive Engineers.