Personal Cars and China (2003)
Chapter: 2 Motorization from a Global Perspective
2
Motorization from a Global Perspective
China may benefit from the experience of other countries as it for mulates its own policies for motor vehicle ownership and use, for the economic role of the motor vehicle industry, and for the use of new motor vehicle technology. To explore the potential for such learning, this chapter summarizes how the recent growth in motorization and road infrastructure in China compares with that of other countries. It also reviews policy issues related to motorization that may deserve special attention. Finally, the chapter explores recent work that predicts how changes in international trade practices and China’s accession to the World Trade Organization (WTO) may affect the Chinese motor vehicle industry. Later chapters address motor vehicle technologies and the societal impacts of motorization.
GLOBAL COMPARISONS OF NATIONAL MOTORIZATION
Since the 1960s many studies have examined what determines the number of motor vehicles used in countries and cities over time.1 All studies find that income is a major determinant of the size of the motor vehicle fleet across countries and cities in developing and industrial countries. At the

FIGURE 2-1 Motor vehicle fleets in relation to income, selected countries, 1970 and 1996. NOTE: Per capita gross domestic product (GDP) is transformed to dollars using market exchange rates (see footnote 2). SOURCES: Motorization data: International Road Federation (2001 and earlier); other data: World Bank (2001 and earlier).
national level, income alone typically explains more than 90 percent of the variation in motorization levels, and at the urban level more than 80 percent. The growth of national motor vehicle fleets parallels that of income: a 1 percent increase in income is associated with a 1 percent increase in motor vehicles, and this relationship has been relatively stable for the past 30 years.
The relation between motorization and income between 1970 and 1996 is summarized in Figure 2-1, which shows data for a sample of 50 countries, with seven countries identified.2 Both per capita income and motorization levels vary over a nearly thousand-fold range, as shown by the logarithmic scales used. For each country in Figure 2-1 (and in Figures 2-2 and 2-3 later in this chapter) a line segment connects the country’s position in 1970 with its position in 1996—the most recent year with comparable data across countries. By means of darker lines and end points, Figure 2-1 specifically identifies China and six other countries. Motorization increased in all countries from 1970 to 1996, but incomes did not. Downward sloping lines denote sampled countries (such as Nigeria, Rwanda, and Côte d’Ivoire) where incomes declined. A mostly parallel
alignment of the line segments indicates stability in the relation over time. The relation between motorization and income in China has been very consistent with that of other countries, even though China started from a very low income level in 1970.
Although strongly related to income, motorization can vary greatly— by a factor of two or more—across countries. For example, in 1970 Korea and Brazil had similar per capita incomes, but Brazil had 31.2 vehicles per thousand persons and Korea 5.6 vehicles per thousand persons. The United States, at 765 vehicles per thousand persons in 1996, had half again as many as some member countries of the Organisation for Economic Cooperation and Development (OECD) such as Germany at 529, France at 526, Japan at 546. Therefore, other variables, including nonmarket factors, also affect motorization levels.
Two additional factors significantly associated with national levels of motorization are population density (negatively) and urbanization (positively). No study has systematically examined the effect of domestic vehicle production on national motorization levels, but Korea’s accelerated motorization may reflect a domestic industry effect. However, a look at two countries with similar income levels reveals that Thailand’s motorization level is above Brazil’s, yet Brazil has a much larger motor industry than Thailand (see Figure 2-1).
Vehicle and fuel prices are two policy instruments that often affect motor vehicle ownership and use. A comparison of current estimates shows that the elasticity of motorization with respect to income (about 1.0) is absolutely larger than the elasticity of motorization with respect to vehicle price (about –0.5). These magnitudes imply that if price increases were the only policy variable used to influence fleet size, vehicle prices would have to increase twice as fast as incomes to offset the effects of income growth on fleet size. Higher vehicle prices also increase the length of time the vehicle is retained (and thus the average age of the fleet). The effect of higher fuel prices on fleet size is uncertain.3 However, it is known that an increase in fuel prices reduces vehicle usage and encourages the purchase of more fuel-efficient vehicles. When adjusted for inflation and quality, neither fuel nor vehicle prices have increased much over time, whereas income has grown steadily in most countries. Differences in prices and other factors across countries produce different levels of motorization at similar income levels (as shown in Figure 2-1), but income growth is the major determinant of motorization growth. China’s experience is very consistent with this pattern.
Studies of motorization at the urban level produce results generally similar to those at the national level. Income is strongly associated with urban vehicle fleet size, but motorization increases more rapidly with income at the national level than at the urban level because urban areas have substitutes for motor vehicles, such as transit, that rural areas lack. In addition, growth in urban motorization worsens urban congestion, which may make owning a car in a city less attractive. After controlling for income, one finds that motorization levels vary across cities even more than across countries (see Ingram and Liu, 1999:335).
THE AUTOMOBILE SHARE OF THE FLEET
Because this study focuses on personal-use motor vehicles (automobiles), it is now appropriate to ask: How does the automobile share of the motor vehicle fleet change as incomes rise over time? At low-income levels (less than $800 [RMB6,600] per capita), trucks and buses predominate. As incomes increase, the automobile share increases very rapidly at low income levels, then at a decreasing rate trending toward a saturation level that varies across countries. The relation between the automobile share of the fleet and income is shown in Figure 2-2 for the same 50 countries and

FIGURE 2-2 Automobile share of motor vehicle fleet in relation to income, selected countries, 1970 and 1996. NOTE: Per capita gross domestic product (GDP) is transformed to dollars using market exchange rates (see footnote 2). SOURCES: Motorization data: International Road Federation (2001 and earlier); other data: World Bank (2001 and earlier).
years, 1970 and 1996, used in Figure 2-1. The automobile share of the fleet has increased dramatically in China, Brazil, and Korea, whereas in the United States the growing popularity of pickup trucks, vans, and sport-utility vehicles has reduced the automobile share of the fleet since 1970. Surprisingly, the automobile share of the fleet also has fallen dramatically in Thailand, where pickup trucks have become popular for use in rural areas. And in some countries motorcycles are a popular substitute for cars. Thailand had 10.2 million motorcycles in 1996 (when China had 9.8 million) compared with 1.6 million automobiles and 4.6 million other motor vehicles.
The number of automobiles increases more rapidly with income than does the total number of motor vehicles. Thus when income rises by 1 percent, the number of motor vehicles rises by 1 percent, but the number of automobiles increases by about 1.2 percent. Compared with other countries, the share of the motor vehicle fleet composed of automobiles was at a very low level in 1970 in China (10.2 percent) and was still relatively low (38.9 percent) in 1996 in comparison with countries with similar income levels. But policies to limit the sales of motorcycles may increase automobile numbers.
GLOBAL COMPARISONS OF ROAD AVAILABILITY
Any policy adopted to increase the number of motor vehicles also needs to consider the availability of roads. Across countries, the size of the road network (measured as the length of paved and unpaved roads) increases less rapidly than income. However, as incomes rise more roads are paved. A 1 percent increase in income is associated with a 0.5 percent increase in total road length and a 1 percent increase in paved road length (see Figure 2-3). Again, China’s recent experience is very consistent with that of other countries, and expansion of its network of paved roads has kept pace with its income growth. China’s motor vehicle population, its paved road length, and its number of motor vehicles per kilometer of paved road (8.3 in 1996) are close to the average for its income level. In OECD countries the number of vehicles per kilometer (km) of paved road is higher, ranging from 20 to 60, with the higher numbers observed in countries with high population densities.
MOTORIZATION IN URBAN AREAS: A CHALLENGE
As noted earlier, in cities vehicle ownership increases with income, much as it does at the national level. Moreover, in developing countries urban incomes are often much higher than the national average income. In China, for example, average incomes in Shanghai are three to five times

FIGURE 2-3 Paved road length in relation to income, selected countries, 1970 and 1996. NOTE: Per capita gross domestic product (GDP) is transformed to dollars using market exchange rates (see footnote 2). SOURCES: Motorization data: International Road Federation (2001 and earlier); other data: World Bank (2001 and earlier).
higher than the national average. Private car ownership would then be concentrated in Chinese cities. Unlike at the national level, the size of the road network at the urban level (measured as the length of roads within the urbanized area) increases very slowly with income. A recent analysis of 35 world cities found that a 1 percent increase in city per capita income was associated with only a 0.1 percent increase in urban road length—and most of that was from annexation of neighboring jurisdictions (Ingram and Liu, 1999). In China, road length has grown recently in major cities from both annexation and new road construction. But new urban roads are very costly. For example, in recent years Shanghai has invested 5 percent of its regional domestic product in roads. This share is high and is unlikely to be sustainable. Most countries invest about 1 percent of national income in roads per year (World Bank, 1994).
Road length per capita in large Chinese cities is similar to that observed in large cities in other developing countries. For example, Shanghai’s road length of 0.43 m per person in 1997 was similar to that of Bangkok, Jakarta, and Manila. Because the number of motor vehicles has been increasing faster than the length of paved roads in large Chinese cities, the number of vehicles per kilometer of paved road has been rising. In 1997 Shanghai had about 122 vehicles per kilometer of paved road, a number that is high for cities in developing countries.
Urban income growth is associated with rapid growth in the number of vehicles and much slower growth in urban road length, and thus it worsens urban congestion—a negative externality of motorization. Because reducing urban congestion depends more on specific attributes of city land use and transport systems than of vehicles, most countries assign responsibility for congestion management to local or metropolitan governments. Such management includes traffic enforcement, parking control, and local charges for registration and vehicle use that may affect vehicle ownership. Chinese policy in this area is evolving. The central government recently restricted local government powers, abolishing many local fees on vehicle registration and use (China Online News, 2000b) and supporting the elimination of bridge tolls in Shanghai.
Vehicle-related air pollution, another negative externality of motorization, is primarily an urban problem because the density of vehicle use and population density are both high in cities. Although it may seem sensible to vary vehicle emissions standards by city, the mobility of vehicles and the cost to producers of multiple standards have led most countries to place responsibility for setting vehicle emissions standards at the national level. China recently assigned this responsibility to the State Environmental Protection Administration. Similar arguments support having vehicle safety standards set nationally, a practice China is also following.
Motorization in urban areas also has an impact on land use patterns. The growth in the use of trucks and motorized freight encourages firms to move out from the center of urban areas. The decentralization of employment encourages the suburbanization of residential development as workers follow jobs (Ingram, 1998). These locational changes reduce central city population densities and produce dispersed travel patterns that are less easily served by public transit. In cities, motor vehicle use promotes motor vehicle dependence because the residential changes and the housing and infrastructure investments are difficult to reverse. Nascent tendencies in this direction are evident in several large Chinese cities that are experiencing falling central population densities, growth in suburban employment, and the emergence of auto-dependent households in metropolitan suburbs.
OTHER MOTORIZATION POLICY LESSONS FROM MARKET ECONOMIES
Vehicle users pay many—but not all—of the costs of vehicle use in most countries. To ensure that personal vehicle use is not excessive, it is important that the prices paid by vehicle users reflect the full economic and social costs of vehicle use. When the personal vehicle user does not
pay these appropriate costs, often some new regulation must be applied to, for example, vehicle attributes, safety, insurance, emissions, and vehicle use so that the owner is forced to pay the costs.
The vehicle owner normally pays the costs of personal vehicle ownership, operation, maintenance, and depreciation. Because vehicles use roads, it is important that vehicle users also pay an appropriate share of the cost of constructing and maintaining roads. Roads and related infrastructure are typically financed through taxes on fuel, taxes on use-related parts such as tires, and tolls. Road costs are usually about 5 percent of automobile operating costs.
Fuel costs, a quarter or more of operating costs, also are borne by the personal vehicle owner. Fuel prices affect both vehicle use and the fuel efficiency of the vehicle purchased. Taxes on fuels can be used to encourage car buyers to purchase more fuel-efficient vehicles. Such incentives may be desirable if vehicles use imported fuel and if the true cost to the economy of fuel imports is thought to be higher than the current market price. China, a net importer of petroleum since 1993, imported 70 million tons of oil in 2000, and oil imports are growing at 10 million tons per year. The Chinese government is considering auto fuel consumption policies that would incorporate a fuel tax and a tax on engine size to promote energy savings (China Online News, 2001b). Taxes on personal-use vehicles and vehicle fuel also may be an attractive source of general revenue for the government, because such taxes are normally progressive (revenue increases with the taxpayer’s income).
Vehicles are involved in accidents, which damage property and injure people. Where vehicle insurance is required and vehicle operators are held liable for damage they cause, vehicle owners pay much of the cost of accidents through insurance premiums. In China, accident and motor vehicle-related fatality rates are high, although they are consistent with China’s per capita income (Figure 2-4).4 In 1996 the annual motor vehicle fatality rate per million vehicles was about 6,000 in China, which was about 30 times higher than the U.S. rate of 200. Auto insurance in China is growing rapidly, but it is unclear what insurance is mandatory and how liability for accidents is assessed. China’s five-year plan for the development of the automotive industry describes the need for a road and motor vehicle law, but it does not mention insurance and liability for accidents. It is critical that users of personal vehicles be held responsible for the costs of the accidents they cause. A mandatory minimum level of
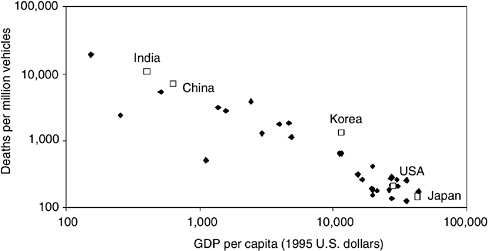
FIGURE 2-4 Motor vehicle death rates in relation to per capita income, selected countries, 1996. NOTE: Per capita gross domestic product (GDP) is transformed to dollars using market exchange rates (see footnote 2). SOURCES: Motorization data: Chinese sources (see footnote 4); other data: World Bank (2001 and earlier).
insurance is a sound way to ensure that vehicle users pay the costs of accidents and the damage associated with vehicle use.
Emissions from motor vehicles often harm urban air quality, but one vehicle’s emissions generally cause no costs to its operator. Nor do vehicle operators pay for the health care costs of those who suffer from the resulting poor air quality. This negative externality is generally handled by regulations and controls on engine technology and fuel use rather than by prices or taxes. China has moved to adopt international standards in regulating vehicular emissions. Fuels are regulated—for example, leaded gasoline has been banned—and new emissions standards promulgated by the State Environmental Protection Administration require light-duty vehicles in China to meet European Emission Standard II (Euro II) by the year 2004 (China Online News, 2001a). Some metropolitan areas have inspection and maintenance programs for vehicular emissions systems. But nationally mandated inspection standards for emissions and safety have been put in place and are being strengthened.
The use of motor vehicles in urban areas also imposes other costs that vehicle operators do not pay. Vehicle use on crowded streets increases the travel time of all other vehicles, but vehicle operators incur only the cost of the time they spend on their trip. Economists have long advocated congestion tolls for crowded roads, and Singapore has successfully implemented one. Implementing congestion tolls can be difficult, but intelligent transportation systems (ITS) could be used successfully to levy
congestion tolls.5 Traffic management remains the second-best solution to congestion and is better left in the hands of local officials.
PROJECTIONS OF CHINA’S MOTOR VEHICLE FLEET
The strong relation between income and motorization across countries provides a simple basis for projecting motor vehicle fleet sizes in China, because China’s motorization experience has been so consistent with international patterns.6 Cross-country analysis has indicated that motor vehicle fleets grow in proportion to income and that automobile fleets grow 1.2 times faster than income. Those relationships are used here, but projecting the growth rate of the Chinese economy is a challenge. China’s gross domestic product (GDP), an indicator of personal income, grew at an average annual rate of 10.1 percent from 1980 to 1990 and 10.7 percent from 1990 through 1998 (World Bank, 2001:194).7 However, in 1999 and 2000 it grew at 7.1 and 8.0 percent, respectively (World Bank, 2001:192). Decadal growth rates of 10 percent or more are rare in historical experience.
Three different assumptions about China’s GDP growth rate—a high rate of 10 percent, a medium rate of 8 percent, and a low rate of 6 percent—produce three different projections for the automobile and motor vehicle fleet size in China. (Note that very few countries have attained even the 6 percent rate over a decade.) The projections, starting from a base in 1996 of 10,020,000 motor vehicles (including 3,894,000 automobiles), are shown in Table 2-1. They cover a wide range, differing by a factor of two by 2015. The medium projection is close to the projections made recently by the Chinese Academy of Engineering.8
It is difficult to move from projections of fleet size to projections of annual new vehicle sales. Taxes on fuel mainly affect fuel efficiency rather than the number of vehicles sold. High prices or high taxes on new vehicles tend to increase the economic life of vehicles. Longer vehicle life mean a smaller share of the fleet is scrapped each year, and thus new
TABLE 2-1 National Vehicle Fleet Projections for Three GDP Growth Rates, China (millions of vehicles)
vehicle sales are a lower share of the fleet. Chinese policy makers recently have set rules calling for vehicles to be retired at a certain mileage and age, but these rules seem to reflect safety and emissions standard objectives rather than economic considerations (China Online News, 2000a).9
CHANGES IN INTERNATIONAL TRADE POLICIES
In 1999 China was the seventh largest national economy as measured by GDP valued at market exchange rates and the second largest (behind the United States) when GDP is measured using purchasing power parity
BOX 2-1Main Obligations of WTO Members Members of the World Trade Organization are obligated to:
SOURCE: World Trade Organization Secretariat (1999). |
exchange rates. In international trade flows, China ranked fourth behind the United States, the European Union, and Japan. China was accepted into the World Trade Organization in late 2001; it was not a member of the WTO’s predecessor, the General Agreement on Tariffs and Trade (GATT).10 China steadily liberalized its trade policies during the 1990s, but joining the WTO will involve many additional changes and obligations (see Box 2-1).
10 | The GATT is no longer a free-standing body; to join the GATT a country must join the WTO. |
The Automotive Industry and Trade Liberalization
China’s accession to the WTO will have a large impact on its automotive industry, an economic sector that is heavily involved in international trade. For example, in 1999 machinery and transport equipment constituted 49 percent of the value of exports (and 30 percent of the value of imports) of the OECD’s trade with low- and middle-income countries (World Bank, 2001:327–328). In 1999, of the new cars placed in service in China, 95 percent were produced domestically.
China’s automotive industry is relatively fragmented; as of 1999 it had 118 original equipment manufacturers of motor vehicles. Its overall production capacity for cars was 910,000 at the end of 1999, and annual production was 605,000. The three largest companies—First Auto Works (FAW), Dongfeng Motor Corporation (DMC), and Shanghai Automotive Industry Corporation (SAIC)—produced 44 percent of motor vehicles and 70 percent of the cars during this period. In 2000 the 13 largest automotive companies produced over 90 percent of the total motor vehicle output and sales.
The automotive industry is one of China’s most highly protected. Tariffs on motor vehicles and vehicle parts were well over 100 percent as recently as 1995. In 2000 import tariffs on sedans ranged from 80 to 100 percent, and import tariffs on vehicle parts ranged from 35 to 50 percent. After WTO accession, compliance with WTO standards must be phased in over a period of five years, and average motor vehicle tariff rates will fall below 15 percent—with tariffs on vehicles at 25 percent and on components around 10 percent.11 The import quotas and import licenses applied to all vehicles except cars will be removed in the second half of the five-year phase-in period and those for cars at its end. Although the tariff rates are high, eliminating quotas and licenses may have more of an impact. Indeed, the five-year plan for the automotive industry states that the elimination of import quotas will be much greater than that of reduced tariffs. It also notes that WTO accession will most severely affect cars, followed by heavy-duty trucks; it will have minimal effects on mini-vehicles, medium trucks, buses, and motorcycles (China State Economic and Trade Commission, 2001:6).
The automotive industry in China has many small producers, and even its largest companies have few plants that operate on a scale large enough to achieve least-cost output levels. High local content has then been achieved, but at a high cost. These challenges are well recognized by China’s economic policy makers and are addressed by current policy
statements. China’s objectives over the next five years are to restructure its automotive industry, to consolidate its many small-scale producers into three large companies with a joint domestic market share of over 70 percent, and to establish the capacity to develop vehicles domestically by increasing expenditures on research and development.
The Effects of WTO Accession on China’s Automotive Industry
A few scholars have attempted to develop quantitative estimates of the economic effects of China’s accession to the WTO (Development Research Centre, 1998; Fan and Zheng, 2000; Zhai and Li, 2000; Wang 2001). One recent paper developed estimates for 22 separate industries, including the automotive industry, using a computable general equilibrium model that includes China and other countries or regions of the world (Ianchovichina and Martin, 2001). Its results are briefly summarized here.
Ianchovichina and Martin conducted simulations for 1995–2005 that compared China’s accession to the WTO with a non-WTO base case. Their model incorporates the liberal duty exemptions already in place for imports used as inputs into export goods and for investment goods used in joint ventures with foreign enterprises. Ianchovichina and Martin report that, overall, WTO accession produces substantial benefits for China and the rest of the world. China’s overall share of world exports is projected to double, with labor-intensive industries growing the most—especially exports of apparel.
In the 1995 base year, of the 22 industries included in the simulation the Chinese automotive industry had the highest tariffs, at 129 percent, compared with the average weighted tariff across all industries in 1995 of 21 percent. With China’s accession to the WTO, import tariffs on automotive trade fall to 14 percent (an average of vehicle and component tariffs), compared with an industry-wide average weighted tariff of 7.85 percent. The model predicts for China a substantial increase in automotive exports and an even larger increase in automotive imports. The net result is a prediction that the total output of China’s automotive industry will decline slightly (the only industry to do so) by 2005 under WTO accession. The authors are careful to note that their model does not capture economies of scale in automobile production. If reduced protection forces consolidation and increased economies of scale, China’s automobile sector could become a stronger competitor and a larger exporter. Although conclusions from these simulations are subject to large uncertainties, they do indicate that WTO accession will place tremendous strains on the automotive industry in China, because it has been highly protected and has few producers with enough volume to benefit from scale economies.
Outside of China, the six large global auto companies that have
emerged from mergers during the 1990s each have the capacity to produce about 4 million units per year and are well poised to compete for a market share in China after WTO accession. In China, vehicle imports are likely to grow rapidly after WTO accession. Imported vehicles and auto parts will put competitive pressure on existing domestic producers and will likely lead to a reduction in the number of vehicle producers and the elimination of inefficient smaller firms. Exports of auto parts are likely to increase as both Chinese and international firms take advantage of China’s relatively low wage levels.
CONCLUSION
In contrast to the impressions of casual observers, China’s pattern of motorization is thus far very similar to that of other countries, and its overall motor vehicle fleet size is strongly associated with its growing income level. Current policies are likely to sustain this similarity. Likewise, the pattern of paved road length in China is similar to that of other countries.
One issue common to many other countries—and rapidly emerging in China—is that motorization is likely to produce its earliest and severest problems in cities. Urban residents have higher-than-average incomes and therefore buy automobiles earlier and at a higher rate than the general population. Because urban vehicle fleets grow more rapidly than urban road length, urban congestion increases quickly—promoting the decentralization of population and employment from central to peripheral locations. Such patterns have already been observed in China’s largest cities.
Overall, motorization produces negative externalities that must be regulated. In many areas, China has put in place regulations (on emissions, fuel quality, and crash-worthiness) that are quite advanced and draw on the experience of other countries. To date, China’s nationally mandated vehicle inspection programs seem to focus mainly on vehicle safety and to apply near the expected end of a vehicle’s useful life. China may well wish to ensure that motor vehicle users pay the costs of accidents through a mandatory insurance program or a financial responsibility requirement.
China’s accession to the World Trade Organization will result in lower tariffs by a factor of two to four from the present levels on vehicles and components. In addition, import quotas and import licenses will be eliminated. These changes, to be phased in over a five-year period, will bring competitive pressure to bear on China’s automotive industry, which is currently fragmented and enjoys few scale economies. Some detailed quantitative analyses suggest that the output of China’s automobile industry will be essentially unchanged by 2005, and that both imports and
exports of motor vehicle-related goods will grow. The implication is that much of the automobile growth over the five-year period will stem from imports. Although subject to considerable quantitative uncertainty, these analyses signal that China’s automotive industry may face a significant structural adjustment from WTO accession.
APPENDIX 1 NATIONAL DATA
National Data, 50 Countries, 1970 and 1996
Country | 1970 GDP per capita (1995 US$) | 1996 GDP per capita (1995 US$) | 1970 Land Are (km2) |
Algeria | 1,261 | 1,503 | 2,381,740 |
Argentina | 6,833 | 7,743 | 2,736,690 |
Australia | 13,636 | 21,347 | 7,682,300 |
Austria | 16,053 | 29,813 | 82,710 |
Belgium | 15,736 | 27,415 | 32,820 |
Bolivia | 856 | 920 | 1,084,380 |
Brazil | 2,393 | 4,476 | 8,456,510 |
Cameroon | 508 | 617 | 465,400 |
Canada | 12,460 | 19,820 | 9,220,970 |
Chile | 2,360 | 4,858 | 748,800 |
China | 120 | 630 | 9,327,450 |
Colombia | 1,377 | 2,403 | 1,038,00 |
Cote d1voire | 927 | 747 | 318,000 |
Denmark | 23,446 | 35,115 | 429370 |
Ecuador | 879 | 1,564 | 276,840 |
Egypt | 478 | 1,066 | 995,450 |
Finland | 15,200 | 26,239 | 304,590 |
France | 16,412 | 27,060 | 550,100 |
Gabon | 3,390 | 4,634 | 257,670 |
Germany | 17,988 | 30,237 | 349,270 |
Greece | 6,651 | 11,488 | 128,900 |
India | 212 | 400 | 2,973,190 |
Indonesia | 298 | 1,105 | 1,811,570 |
Ireland | 7,908 | 19,685 | 68,890 |
Italy | 10,801 | 19,331 | 2949090 |
Japan | 20,015 | 42,913 | 376,520 |
Kenya | 226 | 342 | 569,140 |
South Korea | 2,641 | 11,467 | 98,730 |
Malawi | 121 | 153 | 94,080 |
Malaysia | 1,371 | 4,625 | 328,955 |
Mauritius | 1,190 | 3,703 | 2,030 |
Mexico | 2,295 | 3,251 | 1,908,690 |
Morocco | 849 | 1,379 | 446,340 |
Netherlands | 17,321 | 27,544 | 33,780 |
New Zealand | 12,685 | 16,588 | 267,990 |
Nigeria | 264 | 256 | 910,770 |
Norway | 15,669 | 35,102 | 306,830 |
Pakistan | 277 | 512 | 770,880 |
Philippines | 845 | 1,122 | 298,260 |
Portugal | 5,016 | 11,203 | 91,500 |
1996 Land Area (km2) | 1970 Total Population | 1996 Total Population | 1996 Motor Vehicle-Related Deaths |
2,381,740 | 13,700,000 | 28,600,000 |
|
2,736,690 | 24,000,000 | 35,200,000 |
|
7,682,300 | 12,500,000 | 18,300,000 | 1,970 |
82,730 | 7,426,000 | 8,059,000 | 1,027 |
32,820 | 9,638,000 | 10,200,000 | 1,356 |
1,084,380 | 4,212,000 | 7,588,000 |
|
8,456,510 | 96,000,000 | 162,000,000 |
|
465,400 | 6,614,000 | 13,500,000 |
|
9,220,970 | 21,300,000 | 29,700,000 | 3,082 |
748,800 | 9,496,000 | 14,400,000 | 1,925 |
9,327,420 | 818,000,000 | 1,220,000,000 | 69,000 |
1,038,700 | 22,600,00 | 39,300,000 | 7,445 |
318,000 | 5,515,000 | 14,300,000 |
|
42,430 | 4,9299000 | 5,262,000 | 514 |
276,840 | 5,970,000 | 11,700,000 | 1,421 |
995,450 | 33,100,000 | 59,300,000 |
|
304,590 | 4,606,000 | 5,125,000 | 404 |
550,100 | 50,800,000 | 58,000,000 | 8,080 |
257,670 | 504,000 | 1,125,000 |
|
349,270 | 77,700,000 | 81,900,000 | 8,758 |
128,900 | 8,793,000 | 10,500,000 | 2,068 |
2,973,190 | 548,000,000 | 946,000,000 | 71,943 |
1,811,570 | 118,000,000 | 197,000,000 |
|
68,890 | 2,950,000 | 3,632,000 | 453 |
294,060 | 53,800,000 | 579400,000 | 6,193 |
376,520 | 104,000,000 | 126,000,000 | 9,942 |
569,140 | 11,500,000 | 279500,000 |
|
98,730 | 31,900,000 | 45,500,000 | 12,653 |
94,080 | 4,518,000 | 10,000,000 | 1,090 |
328,550 | 10,900,000 | 21,100,000 | 6,304 |
2,030 | 826,000 | 19134,000 |
|
1,908,690 | 50,600,000 | 92,600,000 |
|
446,300 | 15,300,000 | 26,800,000 | 2,807 |
33,920 | 13,000,000 | 15,500,000 | 1,334 |
267,990 | 2,820,000 | 3,714,100 | 514 |
910,770 | 53,200,000 | 114,000,000 | 6,364 |
306,830 | 3,877,000 | 4,381,000 | 255 |
770,880 | 60,600,000 | 125,000,000 | 5,280 |
298,170 | 37,500,000 | 69,900,000 | 19043 |
91,500 | 9,044,200 | 9,930,000 | 2,100 |
National Data, 50 Countries, 1970 and 1996
Country | 1970 GDP per capita (1995 US$) | 1996 GDP per capita (1995 US$) | 1970 Land Are (km2) |
Rwanda | 263 | 221 | 24,670 |
South Africa | 4,100 | 3,943 | 1,221,040 |
Spain | 8,507 | 15,224 | 499,780 |
Sweden | 19,598 | 27,454 | 411,620 |
Switzerland | 35,491 | 43,574 | 39,550 |
Thailand | 752 | 3,021 | 510,890 |
Tunisia | 1,004 | 2,119 | 155,360 |
Turkey | 1,626 | 2,943 | 769,630 |
United Kingdom | 11,827 | 19,651 | 241,770 |
United States | 17,052 | 28,341 | 9,159,120 |
Country | 1970 Total Motor Vehicles (′000) | 1996 Total Motor Vehicles (′000) | 1970 Passenger Cars (′000) |
Algeria | 251 | 1,505 | 143 |
Argentina | 2,318 | 6,071 | 1,440 |
Australia | 4,870 | 11,097 | 3,899 |
Austria | 1,575 | 3,994 | 1,197 |
Belgium | 2,302 | 4,768 | 2,060 |
Bolivia | 77 | 362 | 19 |
Brazil | 3,000 | 12,754 | 1,595 |
Cameroon | 35 | 162 | 20 |
Canada | 8,340 | 16,861 | 6,602 |
Chile | 328 | 1,720 | 176 |
China | 488 | 10,020 | 50 |
Colombia | 343 | 1,922 | 239 |
Cote d’lvoire | 89 | 456 | 56 |
Denmark | 1,471 | 2,026 | 1,079 |
Ecuador | 180 | 518 | 27 |
Egypt | 270 | 1,787 | 131 |
Finland | 997 | 2,210 | 712 |
France | 14,370 | 30,558 | 12,900 |
Gabon | 13 | 41 | 6 |
Germany | 15,663 | 43,351 | 14,673 |
Greece | 344 | 3,246 | 227 |
India | 1,092 | 6,684 | 627 |
Indonesia | 359 | 4,439 | 239 |
1996 Land Area (km2) | 1970 Total Population | 1996 Total Population | 1996 Motor Vehicle-Related Deaths |
24,670 | 3,728,000 | 6,727,000 |
|
1,221,040 | 22,100,000 | 39,900,000 | 9,848 |
499,40 | 33,800,000 | 39,300,000 | 5,483 |
411,620 | 8,043,000 | 8,843,000 | 537 |
39,550 | 6,267,000 | 7,074,000 | 616 |
510,890 | 35,700,000 | 59,000,000 |
|
155,360 | 5,127,000 | 9,089,300 |
|
769,630 | 35,300,000 | 61,400,000 | 5,428 |
241,600 | 55,600,000 | 58,800,000 | 3,598 |
9,159,120 | 205,000,000 | 268,000,000 | 42,065 |
1996 Passanger Cars (′000) | 1970 Road Length (′000 km) | 1996 Road Length (′000 km) | 1970 Paved Roads (′000 km) | 1996 Paved Roads (′000 km) |
725 | 76.0 | 104.0 | 33.0 | 71.6 |
4,784 | 201.1 | 218.2 | 33.4 | 63.5 |
9,022 | 884.7 | 913.0 | 185.8 | 353.0 |
3,691 | 94.8 | 129.1 | 94.8 | 129.1 |
4,308 | 92.1 | 144.1 | 75.1 | 116.1 |
224 | 25.6 | 41.6 | 0.9 | 1.8 |
10,500 | 1,130.0 | 1,670.1 | 38.9 | 139.7 |
98 | 46.6 | 70.1 | 0.9 | 4.3 |
13,217 | 830.3 | 901.9 | 186.9 | 318.4 |
1,121 | 64.5 | 79.1 | 7.4 | 13.2 |
3,894 | 636.7 | 1,210.0 | 47.0 | 271.0 |
1,624 | 49.5 | 129.1 | 6.0 | 15.4 |
293 | 35.0 | 50.4 | 1.3 | 4.9 |
1,737 | 61.5 | 71.3 | 57.6 | 71.3 |
465 | 20.6 | 43.2 | 2.9 | 5.7 |
1,354 | 23.6 | 64.0 | 10.1 | 50.0 |
1,943 | 72.4 | 77.8 | 23.2 | 49.8 |
25,500 | 785.2 | 892.5 | 691.0 | 892.5 |
25 | 6.0 | 8.3 | 0.2 | 0.6 |
40,988 | 440.9 | 656.1 | 317.4 | 650.0 |
2,339 | 35.1 | 38.1 | 17.4 | 34.3 |
4,189 | 972.3 | 2,367.0 | 324.8 | 1,295.0 |
2,409 | 84.3 | 336.4 | 21.1 | 155.8 |
National Data, 50 Countries, 1970 and 1996
Country | 1970 GDP per capita (1995 US$) | 1996 GDP per capita (1995 US$) | 1970 Land Are (km2) |
Ireland | 440 | 1,109 | 394 |
Italy | 11,115 | 33,316 | 10,181 |
Japan | 17,826 | 68,805 | 8,832 |
Kenya | 114 | 359 | 96 |
South Korea | 180 | 9,553 | 61 |
Malawi | 18 | 56 | 9 |
Malaysia | 312 | 3,497 | 238 |
Mauritius | 11 | 94 | 6 |
Mexico | 1,825 | 12,818 | 1,234 |
Morocco | 306 | 897 | 223 |
Netherlands | 2,913 | 6,260 | 2,258 |
New Zealand | 1,080 | 1,987 | 891 |
Nigeria | 98 | 2,701 | 57 |
Norway | 835 | 2,053 | 694 |
Pakistan | 146 | 977 | 93 |
Philippines | 510 | 2,053 | 279 |
Portugal | 553 | 3,263 | 510 |
Rwanda | 6 | 30 | 3 |
South Africa | 1,973 | 5,657 | 1,545 |
Spain | 3,125 | 17,860 | 2,378 |
Sweden | 2,690 | 3,981 | 2,289 |
Switzerland | 1,524 | 3,546 | 1,383 |
Thailand | 376 | 6,234 | 185 |
Tunisia | 104 | 494 | 66 |
Turkey | 298 | 4,328 | 138 |
United Kingdom | 13,330 | 23,392 | 11,666 |
United States | 109,305 | 205,146 | 88,840 |
SOURCES: Per capita gross domestic product (GDP), land area (square kilometers), and population: World Bank’s World Development Indicators Database. Motor vehicle data, including deaths: International Road Federation (IRF, various years). (Motor vehicle fatality rates are not available for many countries in the IRF database.) Length of total roads and paved roads: IRF (various years); World Bank (1994); Canning (1998). | |||
1996 Passanger Cars (′000) | 1970 Road Length (′000 km) | 1996 Road Length (′000 km) | 1970 Paved Roads (′000 km) | 1996 Paved Roads (′000 km) |
987 | 86.7 | 92.5 | 71.6 | 86.9 |
30,600 | 285.0 | 303.9 | 262.2 | 303.9 |
46,869 | 1,013.6 | 1,147.5 | 152.0 | 825.6 |
278 | 41.5 | 67.2 | 4.8 | 12.5 |
6,894 | 40.2 | 82.3 | 3.6 | 59.8 |
27 | 10.7 | 14.6 | 1.1 | 2.9 |
2,946 | 22.6 | 63.4 | 14.8 | 47.2 |
70 | 1.8 | 1.9 | 1.6 | 1.8 |
8,707 | 72.3 | 312.3 | 42.7 | 99.3 |
670 | 45.9 | 60.7 | 21.1 | 30.5 |
5,664 | 79.9 | 124.1 | 78.6 | 112.0 |
1,636 | 93.8 | 91.9 | 41.9 | 55.9 |
885 | 89.0 | 112.9 | 15.2 | 36.3 |
19661 | 72.3 | 91.3 | 21.7 | 65.7 |
578 | 31.7 | 224.9 | 17.5 | 98.9 |
703 | 75.7 | 161.3 | 13.5 | 28.1 |
2,671 | 41.8 | 68.7 | 32.4 | 59.1 |
13 | 6.5 | 14.9 | 0.1 | 1.4 |
4,004 | 185.5 | 331.3 | 33.1 | 137.5 |
14,754 | 139.4 | 344.8 | 94.7 | 341.0 |
3,655 | 98.0 | 210.0 | 38.6 | 162.0 |
3,268 | 59.2 | 71.1 | 59.2 | 71.1 |
1,661 | 16.3 | 200.3 | 10.0 | 62.9 |
320 | 17.9 | 29.2 | 9.1 | 18.2 |
3,457 | 59.5 | 381.6 | 19.0 | 95.4 |
21,172 | 334.1 | 368.8 | 324.2 | 368.8 |
129,728 | 6,003.0 | 6,308.1 | 2,668.9 | 3,816.4 |
REFERENCES
China Online News. 2000a. Standards for retiring vehicles published. August 29. Online. Available at www.chinaonline.com. Accessed October 21, 2002.
———. 2000b. Taking the freer way: China eliminates 238 vehicle fees to encourage automobile ownership. June 6. Online. Available at www.chinaonline.com. Accessed October 21, 2002.
———. 2001a. China unifies auto-emission standards. April 23. Online. Available at www.chinaonline.com. Accessed October 21, 2002.
———. 2001b. New policies encourage purchase of small engine sedans. January 23. Online. Available at www.chinaonline.com. Accessed October 21, 2002.
China State Economic and Trade Commission. 2001. China’s 10th Five-Year Plan for the Development of the Automotive Industry (2001–2005). June 26. (Translation made available by Volkswagen Corporation.)
China State Statistical Bureau. 2002. China Statistical Abstract. May.
Development Research Centre. 1998. The Global and Domestic Impact of China Joining the World Trade Organization. Development Research Centre of State Council, Beijing.
Eglin, R. 2000. Challenges and Implications of China Joining the WTO. June 19. World Trade Organization Secretariat, Geneva, Switzerland.
Fan M. and Zheng Y. 2000. China’s trade liberalization for WTO accession and its effects on China: A computable general equilibrium analysis. Paper presented at Third Annual Conference on Global Economic Analysis, Monash University, June 28–30.
Ianchovichina, E., and W. Martin. 2001. Trade liberalization in China’s accession to the World Trade Organization. Journal of Economic Integration 16(December):421–445.
Ingram, G. K. 1998. Patterns of metropolitan development: What have we learned? Urban Studies 35(7):1019–1035.
Ingram, G. K., and Liu Z. 1999. Determinants of motorization and road provision. Pp. 325– 356 in Essays in Transportation Economics and Policy, J. Gómez-Ibánez, W. B. Tye, and C. Winston, eds. Washington, D.C.: Brookings Institution Press.
International Road Federation. 2001. World Road Statistics. Geneva.
Johansson, O., and Schipper, L. 1997. Measuring the long-run fuel demand of cars: Separate estimations of vehicle stock, mean fuel intensity, and mean annual driving distance. Journal of Transport Economics and Policy 31(September):277–292.
Wang Z. 2001. The impact of China’s WTO accession on patterns of world trade. Paper presented at International Agricultural Trade Research Consortium, May 18–20.
Wheaton, W. C. 1982. The long run structure of transportation and gasoline demand. Bell Journal of Economics 13(autumn):439–454.
World Bank. 1994. World Development Report, 1994: Infrastructure for Development. Washington, D.C.
———. 2001. World Development Indicators. Washington, D.C.
World Trade Organization Secretariat. 1999. Guide to the Uruguay Round Agreements. London: Kluwer Law International.
Zhai F. and Li S. 2000. The implications of accession to WTO on China’s economy. Paper presented at Third Annual Conference on Global Economic Analysis, Monash University, June 28–30.


