Statistical Analysis of Massive Data Streams: Proceedings of a Workshop (2004)
Chapter: 9.4 USER INTERACTION WITH STREAMING MODELS

Figure 8. Capture Models can be configured for real-time queries, which enable interactive snap-shot views of the statistical data captured in memory. The above screen-shot reveals the lognormal distribution of subscriber usage.
9.4 USER INTERACTION WITH STREAMING MODELS
The collection and processing of these streams forms the foundation, but users need graphical and visual tools for exploring this space. Wilkinson (1999) has done some extraordinary work in this area. This is a challenging area in its own right and where we will be investing more R&D going forward. The DNA technology suite includes both a browser-based client and a Java application client for more sophisticated viewing and analysis.
Figure 8 is a real data example of the analysis screen examining a subscriber usage distribution. This kind of data can be pulled up from a DNA server using the real-time query mechanism mentioned earlier.
What is interesting is that this usage distribution follows a lognormal distribution over five orders of magnitude (90KB/mo to 22GB/mo) with a shape factor of ~0.67.
Transforming this into a CDF is trivial (Figure 9, top), which gives marketing folks information on how to segment their subscribers based on usage. The graph on the bottom is a percentile-percentile plot of percent subscribers using what percent of the overall traffic. This graph shows that this distribution follows the 80:20 rule, the top 20% of subscribers generate 80% of the traffic. The top 5% generate 50% of all traffic!
To demonstrate how capturing statistics from a stream can generate valuable business
insight, Figure 10 is from the DNA financial modeling tool that uses empirical distribution data collected from the DNA server to compute the estimated dollar value of subscriber traffic modeling different pricing scheme scenarios.
Given
|
b |
= |
bytes of usage per month |
|
s(b) |
= |
density function: # subscribers at b |
|
$(b) |
= |
pricing function: $ paid by a subscriber with total usage b for the month. |
The revenue in dollars for all subscribers with monthly usage between b0 and b1 is
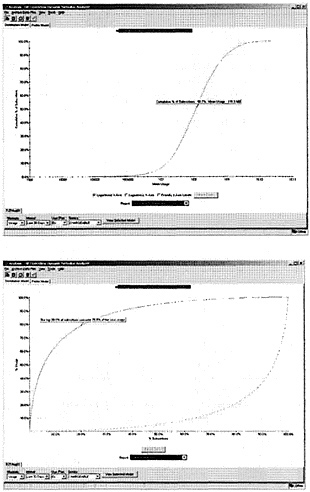
Figure 9. From the empirical distribution, multiple parameters can be derived and various transforms applied.

