Gender Differences at Critical Transitions in the Careers of Science, Engineering, and Mathematics Faculty (2010)
Chapter: Appendix 2-1: Review of Literature and Relevant Research
Appendix 2-1
Review of Literature and Relevant Research
PROFILE OF WOMEN IN ACADEMIC SCIENCE AND ENGINEERING: 1995-2003
The 2001 National Academies’ study, From Scarcity to Visibility: Gender Differences in the Careers of Doctoral Scientists and Engineers (NRC, 2001a), examined the careers of men and women scientists and engineers using data from the Survey of Doctorate Recipients (SDR) for four selected years: 1973, 1979, 1989, and 1995. The first part of this appendix provides descriptive data from the SDR for 1995 to 2003, the time period when the surveys of faculty and departments were initiated.1 This overview presents data on basic trends in female participation and standing among science and engineering (S&E) faculty for 1995 to 2003, including the number of employed doctorates, the fields in which scientists and engineers worked, and the proportions who worked in academia. Academics are further disaggregated by the types of institutions in which they worked, their fields of study, their tenure status, and their professorial rank. It is important to remember that the SDR covers doctoral recipients in all fields of science and engineering and working in all sectors of the economy. This appendix focuses only on those doctoral scientists and engineers who were employed full-time and whose doctorate was in the natural sciences and engineering, excluding the social sciences.2
THE DOCTORAL POOL
The number and percentage of women receiving doctorates in S&E grew from 8,648 (31.7 percent) in 1996 to 10,533 (37.7 percent) in 2005, as shown in Figure A2-1.
Increases in women’s participation differed by field. Growth was particularly evident, as noted in Table A2-1, in civil engineering, the agricultural sciences, and the earth, atmospheric, and oceanic sciences. But every field, other than industrial/manufacturing engineering, saw increases in the proportion of doctorates awarded to women over the 10-year period.3
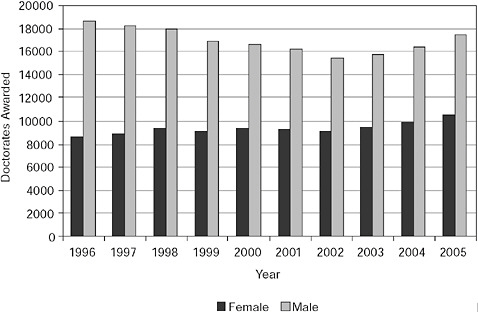
FIGURE A2-1 Number of doctorates awarded annually in science and engineering by gender, 1996-2005.
NOTE: These data are for all science and engineering fields, including the social and behavioral sciences.
SOURCE: Hill (2006). Adapted from Tables 2 and 3.
EMPLOYMENT STATUS
In 2003, the National Science Foundation (NSF) identified 492,440 doctoral scientists and engineers (or 685,300 if the social sciences and psychology are included) (NSF, 2006). Most of these doctoral scientists and engineers worked full-time. However, women were slightly less likely to be employed full-time.
In a previous analysis of SDR data, the National Research Council (NRC) (2001a:64) found “after completion of the doctorate, a greater proportion of women than men do not attain full-time careers in science and engineering.” For example, in 1973, 91 percent of male scientists and engineers were working full-time, compared to 71 percent of females. By 1995, this 20 percent gap had been reduced to around 10 percent—partly because the percentage of men working full-time dropped.4 For all years surveyed, women were more likely than men to be not working and not seeking work, or working part-time. For most years examined, women were more likely than men to be not working, but seeking work. About
TABLE A2-1 Percentage of Women Among Science And Engineering Doctorates, 1996 and 2005
|
Field |
1996 |
2005 |
2005–1996 |
|
Science and engineering |
31.7 |
37.7 |
6.0 |
|
Science |
37.6 |
43.4 |
5.8 |
|
Agricultural sciences |
27.2 |
36.2 |
9.0 |
|
Biological sciences |
42.2 |
48.8 |
6.6 |
|
Computer sciences |
15.1 |
19.8 |
4.7 |
|
Earth, atmospheric, and oceanic sciences |
21.0 |
34.1 |
13.1 |
|
Mathematics |
20.6 |
27.1 |
6.5 |
|
Physical sciences |
21.9 |
26.7 |
4.8 |
|
Astronomy |
21.4 |
26.3 |
4.9 |
|
Chemistry |
28.2 |
34.0 |
5.8 |
|
Physics |
13.0 |
15.0 |
2.0 |
|
Psychology |
66.7 |
68.0 |
1.3 |
|
Social sciences |
36.5 |
44.7 |
8.2 |
|
Engineering |
12.3 |
18.3 |
6.0 |
|
Aeronautical/astronautical engineering |
8.4 |
13.2 |
4.8 |
|
Chemical engineering |
17.9 |
24.0 |
6.1 |
|
Civil engineering |
11.3 |
23.2 |
11.9 |
|
Electrical engineering |
9.7 |
13.4 |
3.7 |
|
Industrial/manufacturing engineering |
19.7 |
18.5 |
–1.2 |
|
Materials/metallurgical engineering |
14.6 |
22.2 |
7.6 |
|
Mechanical engineering |
7.4 |
12.3 |
4.9 |
|
Other engineering |
16.6 |
23.8 |
7.2 |
|
SOURCE: Hill (2006). Adapted from Table 3. |
|||
4 percent of female S&E doctorates were not working and not seeking work. These were fully trained doctorates who were not working in S&E.5
“Employment status” consisted of four mutually exclusive categories: employed full-time, employed part-time, unemployed but seeking work, and unemployed and not seeking work. Figure A2-2 examines full-time employment and compares the percentages of full-time employed doctoral scientists and engineers6 to the total number of doctoral scientists and engineers. As this figure shows, women were less likely to be employed full-time than men, although the rate for both men and women was dropping slightly over time, and the gap was closing.

FIGURE A2-2 Percentage of all doctoral scientists and engineers who were employed full-time by gender, 1995-2003.
SOURCE: National Science Foundation, Survey of Doctorate Recipients, 1995-2003. Tabulated by the NRC.
This finding was consistent with the earlier work of NRC (2001a) and others, who employed different analyses. For example, the NSF (WMPDSE, 2002) noted “women with either an S&E degree or in an S&E occupation are less likely than men to be in the labor force (that is, either employed or seeking employment). Among those in the labor force, women were more likely than men to be unemployed.” The NSF also noted:
A higher percentage of women than men with either an S&E degree or in an S&E occupation are employed part time. Of those who were employed in 1999, 19 percent of women and 6 percent of men were employed part-time. Women who are employed part-time are less likely than men to prefer full-time employment. Also, women who are employed part-time are far more likely than men to cite family responsibilities as the reason for their employment status: 48 percent of the women working part-time and 12 percent of the men cited family
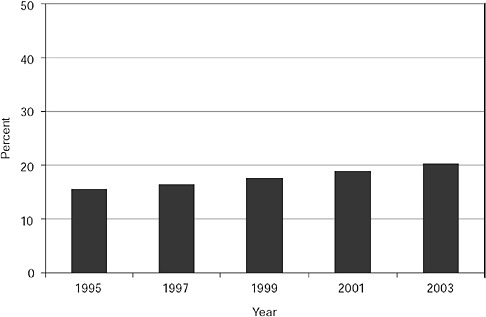
FIGURE A2-3 Percentage of women among doctoral scientists and engineers employed full-time, 1995-2003.
SOURCE: National Science Foundation, Survey of Doctorate Recipients, 1995-2003. Tabulated by the NRC.
responsibilities as the reason for their work status in 1999. On the other hand, 41 percent of men and 8 percent of women cited retirement as the reason for part-time employment. Thus, as with unemployment, variations in male/female age distribution, as well as varying family responsibilities, are factors in part-time employment choices.7
Figure A2-3 examines the proportion of women among full-time employed doctoral scientists and engineers between 1995 and 2003. The proportion of women among those employed full-time, while still small, was rising slowly. Increases “in the number of women among new Ph.D.s do not translate directly into increases in the proportion of women in the science and engineering labor force. Each new cohort of Ph.D.s represents only a small fraction of the total number of scientists and engineers. The proportion of women in the S&E labor force must increase slowly as older, predominantly male cohorts retire and are replaced by new cohorts that have a greater proportion of women” (NRC, 2001a:63).
EMPLOYMENT DISCIPLINE
This section briefly examines the distribution of doctoral scientists and engineers employed full-time by field and gender. As shown in Figure A2-4, women employed in the biological, physical, and health sciences were the most likely to be working full-time. In the case of men, those who were employed in engineering and the physical sciences were more likely to be working full-time.
Figure A2-5 examines the percentage of women among doctorates employed full-time in six different disciplines. Although the percentage of women among scientists and engineers was rising, women still made up a small fraction of those employed in the agricultural sciences, engineering, mathematics and computer sciences, and the physical sciences.
EMPLOYMENT SECTOR
This section considers the employment sector of those who were employed full-time. NRC (2001a:102) noted that “sector of employment is a fundamental dimension of the scientific career that affects work experience, opportunities,
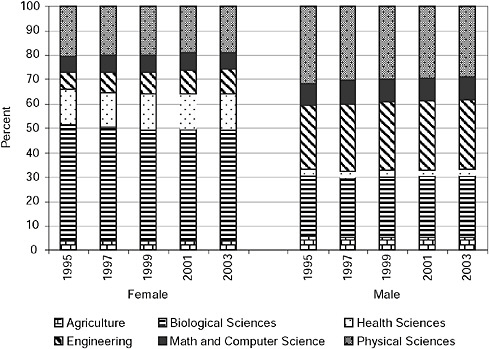
FIGURE A2-4 Distribution of full-time employed S&E doctorates by discipline and gender, 1995-2003.
SOURCE: National Science Foundation, Survey of Doctorate Recipients, 1995-2003. Tabulated by the NRC.

FIGURE A2-5 Percentage of females among doctorates employed full-time by discipline, 1995-2003.
SOURCE: National Science Foundation, Survey of Doctorate Recipients, 1995-2003. Tabulated by the NRC.
employment security, and prestige.” An often-used distinction among employment sectors for doctorate holders in S&E is industry, government, and education. Often, education is narrowly defined to encompass doctoral scientists and engineers working at colleges and universities that award at least a two-year degree (NRC, 2001a). In this section, however, education includes K-12. Outside of education, the other employment sectors include industry not-for-profit organizations; self-employed persons; local, state, or federal government; or the U.S. military.
According to previous literature, employed women with doctorates in S&E were more likely to be in academia and less likely to be in industry (NRC, 2001a). This finding was echoed by the NSF, which noted that women were more likely than men to be at 4-year academic institutions and less likely to be in business or industry (NSF, 2007). The authors argued that these differences “primarily stem from differences in occupation. Women are less likely than men to be engineers or physical scientists, which are occupations that tend to be in business or industry” (p. 66). The NSF’s final point, as well as findings from NRC (2001a), suggested that differences in employment sector vary by discipline; that is, men and women in different areas of S&E distribute themselves differently across possible employment sectors.
Table A2-2 and Figure A2-6 examine the distribution of male and female S&E doctorates employed full-time across two employment sectors: Education
TABLE A2-2 Doctoral Scientists and Engineers Employed Full-Time by Sector and Gender, 1995-2003
|
Gender/Sector |
Years |
||||
|
1995 |
1997 |
1999 |
2001 |
2003 |
|
|
Men |
|
|
|
|
|
|
Education |
124,770 |
125,252 |
128,335 |
128,170 |
131,628 |
|
Other |
151,115 |
163,076 |
179,519 |
184,260 |
179,588 |
|
Percent Education |
.45 |
.43 |
.42 |
.41 |
.42 |
|
Women |
|
|
|
|
|
|
Education |
29,759 |
32,659 |
35,726 |
39,621 |
43,828 |
|
Other |
21,195 |
24,126 |
29,880 |
33,585 |
36,117 |
|
Percent Education |
.58 |
.58 |
.54 |
.54 |
.55 |
|
SOURCE: National Science Foundation, Survey of Doctorate Recipients, 1995-2003. Tabulated by the NRC. |
|||||
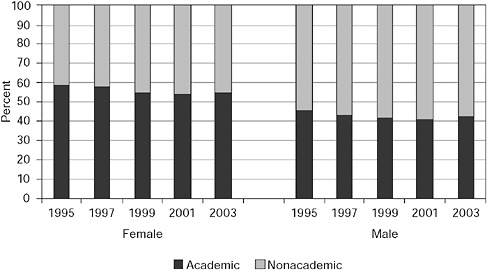
FIGURE A2-6 Percentage of doctorates employed full-time in education and other sectors by gender, 1995-2003.
NOTE: The percentage of women employed full-time in the education sector appeared to be increasing (see Figure A2-7).
SOURCE: National Science Foundation, Survey of Doctorate Recipients, 1995-2003. Tabulated by the NRC.
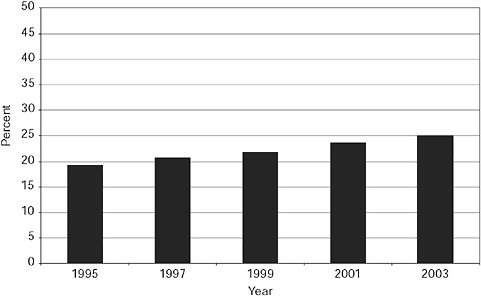
FIGURE A2-7 Percentage of women among the full-time education workforce, including K-12 education, 1995-2003.
SOURCE: National Science Foundation, Survey of Doctorate Recipients, 1995-2003. Tabulated by the NRC.
and Other.8 As Figure A2-6 shows, women were more likely to be in the education sector than men.
ACADEMICS
Male and female academics can be categorized along several dimensions. The first section examines academics by field and by the type of higher education institution in which they worked, followed by the distribution of male and female faculty across tenure status and rank. The term “academic” is used here to denote faculty, which are personnel with teaching or research duties, who are employed at a higher education institution (college or university), and who are further identified as being tenured or on tenure track or as holding the rank of assistant, associate, or full professor.
Distribution by Discipline
As Figure A2-8 shows, more than half of the faculty in the health sciences in 1995-2003 were women. The biological sciences also had relatively large proportions of female faculty (20-30 percent). In the other four disciplines, and especially in engineering, women made up a small fraction of the faculty. In every field, however, the proportion of women among faculty was smaller than the corresponding proportion of women among those earning a doctorate in the discipline.
Distribution by Institution Type
In this section, we focus on doctoral scientists and engineers who were employed at Research I institutions, consisting of institutions that “offer a full range of baccalaureate programs, are committed to graduate education through the doctorate degree, and give high priority to research. They award 50 or more doctoral degrees each year. In addition, they receive annually at least $40 million or more in federal support.” Using the 1994 Carnegie classification, there are 89 Research I institutions in the United States.9 The following tables group employed doctoral scientists and engineers by the institutional category they reported in the SDR. There are seven possible institutional categories: Research I, Research II, doctoral-granting, master’s-granting, medical colleges, baccalaureate (4-year institutions), and other (including 2-year institutions). None of the categories overlaps.
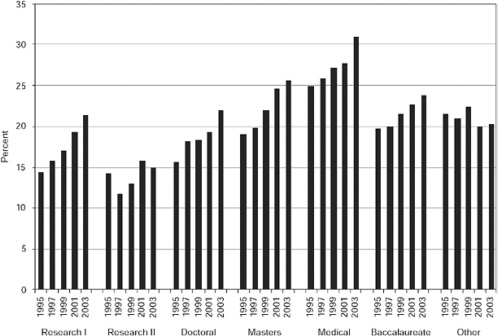
As Figure A2-9 shows, the highest percentage of female faculty was found in medical colleges, and the lowest percentage of women was found at Research II institutions. Among the other types of institutions, women tended to make up between 20 and 25 percent of S&E faculty. The percentage of female faculty employed at Research I institutions was growing steadily in 1995-2003.
Tenure Status
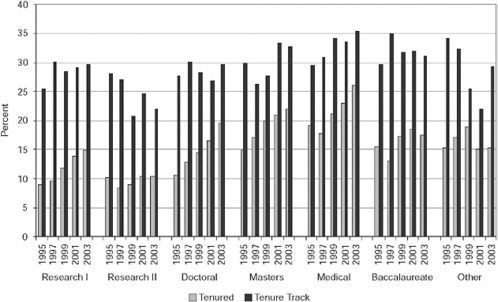
How likely were women to be granted tenure? Using the SDR, we examined tenure status by gender by comparing faculty with tenure to faculty who were untenured but on the tenure-track, considering each academic discipline separately. As Figure A2-10 shows, the percentage of women among tenured faculty appeared to be growing in 1995-2003 in all fields, while the percentage of women among tenure-track faculty was growing in some fields, including engineering.
|
9 |
See Alexander C. McCormick, “The 2000 Carnegie Classification: Background and Description (excerpt),” available at http://www.carnegiefoundation.org/dynamic/downloads/file_1_341.pdf [accessed on November 4, 2008]. The Carnegie Foundation updated its classification system in 2005 and is available at http://www.carnegiefoundation.org/classifications/. |


The highest proportions of women among the tenure-track faculty were found in health sciences.
Among both tenure-track and tenured faculty, women were proportionately more likely to be in medical colleges. About 15 percent of tenured faculty were women in Research I institutions; female tenured faculty were rarer at Research II institutions, but more prevalent at master’s, doctoral, and baccalaureate institutions. The percentage of women among tenured faculty was growing at Research I institutions (see Figure A2-11).
Rank
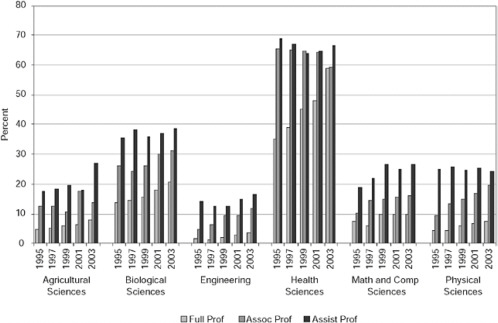
Women were less likely to occupy senior positions in academia than men. Using the SDR, the committee examined rank by comparing the gender of faculty who were assistant, associate, and full professors, by academic discipline separately. Figure A2-12 shows the following results:
-
Women comprised over 50 percent of all full professors in health sciences, 20 percent in biological sciences, and 10 percent or less in other fields, with engineering having the lowest proportion of female full professors.
-
The percentage of women among full professors appeared to be rising or remaining level in each field.
-
Women comprised almost 60 percent of all associate professors in health sciences, approximately 30 percent in biological sciences, and less than 20 percent in other fields, with engineering having the lowest proportion of female associate professors.
-
The percentage of women among associate professors appeared to be rising or remaining level in many fields, but not in agricultural sciences and not in the health sciences.
-
Women comprised 65 percent of all assistant professors in health sciences, 39 percent in biological sciences, between 25 to 27 percent in mathematics, computer, and physical sciences, with engineering having the lowest proportion of female assistant professors (less than 20 percent).
-
The percentage of women among assistant professors appeared to be roughly steady in each field.
This analysis was then repeated, focusing on institution types. Figure A2-13 shows the following results:
-
Women comprised about 25 percent of full professors at medical colleges and about 12 percent at Research I institutions.
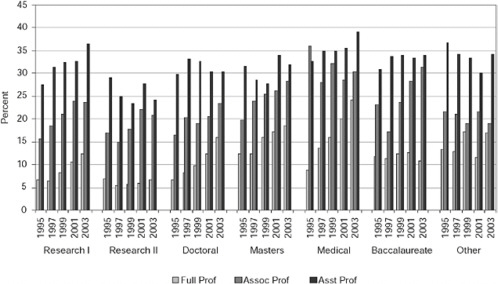
-
The percentage of women among full professors appeared to be rising or remaining level in each field.
-
Women comprised approximately 30 percent of associate professors at medical colleges and at baccalaureate institutions and approximately 24 percent at Research I institutions.
-
The percentage of women among associate professors appeared to be rising or remaining level at each type of institution, except at medical colleges, where the trend was less clear.
-
Women comprised between 35 and 40 percent of assistant professors at medical colleges. For assistant professors, there were more similarities across institution type. At each institution type, the proportion of women among assistant professors tended to be around 30 to 35 percent, excepting Research II institutions, which were lower.
-
The percentage of women among assistant professors was rising at Research I institutions and at medical colleges but was less clear at other types of institutions.