Gender Differences at Critical Transitions in the Careers of Science, Engineering, and Mathematics Faculty (2010)
Chapter: 5 Gender Differences in Tenure and Promotion
5
Gender Differences in Tenure and Promotion
National faculty data show that women continue to be underrepresented at the higher ranks of academia. While a partial explanation for the lower number of women at higher ranks (associate and full professor levels) has to do with the fact that women are newer entrants to academia—as noted in Chapter 3—a concern is that women faculty spend more time in lower ranks and are less likely to be tenured or promoted. In this chapter, we investigate whether women are, in fact, tenured or promoted at lower rates than men and find that national faculty data indicate otherwise. Controlling for the policies at their institutions, women who come up for tenure are tenured at greater rates than men, and women are promoted from associate to full professor at rates similar to those for men. The data, however, do not permit exploration of whether attrition prior to these career milestones occurs differentially by gender.
This chapter considers the advancement of women through the professorial ranks. It focuses on two critical junctures in most tenure-track faculty’s careers: the awarding of tenure and promotion from assistant to associate professor, and promotion to full professor.1 We do not discuss the transition of women from faculty positions to higher leadership positions (e.g., deans, provosts, or presidents) in academia.2 To assess whether gender disparities might exist in the tenure and promotion process, the chapter examines three research questions:
-
Are similar male and female faculty equally likely to receive tenure?
-
Are similar male and female faculty equally likely to receive a promotion?
-
Do male and female faculty spend equal amounts of time in professorial ranks?
Tenure and promotion decisions are designed to be based on merit. Although there may be some subjectivity in the determination of merit, the committee wished to compare rates of tenure and promotion for men and women who were similar along as many dimensions, such as experience and productivity, as could be observed. Assuming (1) men and women have similar talent, (2) are given similar amounts of time to demonstrate their teaching excellence, research potential, and commitment to service, and (3) are held to the same standard, then men and women should achieve similar tenure and promotion results. Different results would occur if one or more of these assumptions are false.
This chapter draws on evidence from the study’s surveys of research-intensive (Research I or RI) institution departments in the sciences and engineering,3 which the committee compared with data from other national surveys (primarily the National Science Foundation’s Survey of Doctorate Recipients [SDR] or the National Survey of Postsecondary Faculty [NSOPF] of the National Center for Education Statistics at the U.S. Department of Education), as well as information drawn from gender equity studies carried out by individual institutions.
An important limitation of most analyses of tenure and promotion decisions is that they examine selected samples of those who succeeded in gaining tenure or promotion, and those who are eligible for these advances but have not yet been considered. Many studies examine the representation of women among tenured versus untenured faculty or among full versus associate professors. Generally, there are no data on the decision-making process itself.4 One methodological approach is to make the argument that one would expect faculty who are 10 years beyond being hired as assistant professors to be tenured. It is then possible to compare the percentage of men and women who have in fact received tenure. This comparison, however, omits the faculty who left prior to being considered for tenure (possibly because they had been informed that they were unlikely to receive it), as well as those who were considered, but not awarded tenure. A second approach is to examine time spent in the assistant professor rank by those who were promoted to associate professor and time spent as associate professor by those who were promoted to full professor.
Longitudinal data tracking individual academic career trajectories from first hire through tenure or departure are generally lacking, even in university-specific analyses. This is an important gap that can be readily remedied through the efforts of institutional researchers, with appropriate resources. This report’s analysis of departmental data does, however, allow a direct examination of the tenure and promotion decisions since we asked departments to report on every tenure and promotion case they considered in the prior 2 years, independent of the outcome of the case. This allows us to obtain data on both successful and unsuccessful tenure cases. However, it will not overcome any bias due to attrition prior to these milestones.
The chapter first describes the nature of tenure and promotion processes in RI institutions. Second, it describes the outcomes of tenure and promotion decisions. Finally, the chapter uses multivariate methods to examine how tenure and promotion for men and women are affected by university programs and policies, such as changes to the tenure clock.
TENURE AND PROMOTION PROCESSES
Both tenure and promotion decisions are evaluations or reviews conducted by peers of a faculty member’s professional activities, which lead to significant status changes. Tenure can be considered as a change from a probationary or fixed length appointment to an indefinite appointment. Such a change provides the faculty member with greater freedom in his or her professional activities or greater economic security, or both, although further promotions depend on continued research productivity and contributions to teaching and service.
Promotions are changes in status, such as from assistant to associate or from associate to full professor. The tenure decision and first promotion mark the transition between tenure-track assistant professor to associate professor. Most often tenure and promotion to associate professor occur at the same time, although some universities make these decisions separately. In the committee’s survey, of 407 departments in RI institutions that responded, 318 (78 percent) granted tenure and promotion to associate professor together in a single decision. Disaggregated by discipline, Table 5-1 shows that 72 to 79 percent of departments decide tenure and promotion together, with the exception of chemistry, where 85 percent of 74 responding departments make one decision.
These decisions typically take place in the sixth year. Among the 407 responding departments, the modal response was 6 years elapsing between hiring and the tenure decision, with a range of 2 to 12 years. Fully 83 percent of departments indicated the tenure decision was made in the fifth or sixth year. As shown in Table 5-2, similar results were found within each discipline, with the exception of mathematics, where about one-quarter of departments responded that untenured faculty come up for tenure in 2 to 4 years.
TABLE 5-1 Percentage of Responding Departments That Decide Tenure and Promotion Together by Discipline
|
Discipline |
Percent of Departments |
|
Biology |
75 |
|
Chemistry |
85 |
|
Civil engineering |
77 |
|
Electrical engineering |
79 |
|
Mathematics |
79 |
|
Physics |
72 |
|
SOURCE: Survey of departments carried out by the Committee on Gender Differences in the Careers of Science, Engineering, and Mathematics Faculty. |
|
From the vantage point of most tenure-track assistant professors, tenure may be the seminal event in their professional lives. Certainly, the first several years of academic life are spent building a dossier that will establish the case for granting tenure. The tenure decision grants substantial job security, validation of quality of work, possible monetary rewards (via salary adjustments), and increased institutional resources and authority. Universities typically have an “up or out” policy after a given number of years as a tenure-track assistant professor. If not granted tenure, the faculty member must leave his or her position for another position not on the tenure track or for employment outside the university. Faculty who believe they will not be granted tenure may choose to leave before facing the decision.
A second promotion marks the transition between associate professor and full professor; it is optional because some faculty may simply stay at the associate professor rank—although this was truer in the past than for current faculty. This decision also occurs several years after the first promotion.
These decisions are made, first, by a tenure or promotion committee comprised of departmental colleagues, typically followed by evaluation at successively higher administrative levels, such as a college- or school-wide committee, a dean, a provost or vice president for academic affairs, and the president of the institution. Exactly who is involved differs depending on the university, but such oversight is typical. The first decision would be made by the tenured departmental faculty, and administrators can support or reverse lower level decisions. Candidates generally provide a full curriculum vitae (C.V.); a statement describing their research accomplishments and goals, teaching history, teaching evaluations, and service to their department, university and profession; and copies of selected publications. Outside evaluations of research contributions of the applicant are generally solicited by the department from leading researchers located at other universities in the applicant’s field. Sometimes internal evaluations are solicited from the same or other departments as the candidate’s department.
TABLE 5-2 Number of Years Between Hiring and Tenure Decision
Service on Tenure and Promotion Committees
Women are likely to serve on tenure committees but unlikely to chair them. As shown in Table 5-3, in 57 percent of tenure cases, there was at least one woman present on the tenure committee. In 690 cases for which the gender of the committee chair was known, it was a man in 90 percent of the cases. It was similar for promotion cases: in 51 percent of the promotion cases there was at least one woman present on the promotion committee. In 459 cases for which the gender of the committee chair was known, it was a woman in 13 percent of these cases.
EQUITY IN TENURE AND PROMOTION DECISIONS
The reason to ask whether there is equity in tenure and promotion decisions today is that there is a body of evidence suggesting that there is inequity. Specifically, the literature suggests that women as a group are less likely to receive tenure or a promotion (and it may take longer for women to reach those milestones). This section reviews several key studies on gender and tenure and promotion and identifies two reasons why there might be differences regarding rates of and time to tenure and promotion.
Several quantitative studies found that women were less likely than men to be tenured or promoted, or that women took longer to advance.5 Examples include the National Research Council (NRC) (2001), Perna (2001a), Ginther (2001), and the National Science Foundation (NSF) (2004d). The NRC (2001) examined gender patterns in academic careers using data from selected years of the SDR: 1973, 1979, 1989, and 1995. Using a broad definition of Science and Engineering (S&E), which included the social sciences, and examining a wide range of higher education institutions, the NRC compared the percentage of men and women who had tenure among all tenure-track faculty. In 1995, 60 percent of women had tenure and 40 percent were tenure-track, while 79 percent of men had tenure and 21 percent were tenure-track. Second, the NRC examined men and women at different points in time in their careers, grouping men and women by the number of years that had elapsed since they received their Ph.D.6 In examining men 1 year out, 2 years out, 3 years out, etc., the 2001 NRC report found a greater percentage of men were tenured than women (with the exception that a greater percentage of women were tenured among very recent Ph.D.s). Finally, using logit analysis, the NRC found that the difference between the percentage of men with tenure
TABLE 5-3 Female Participation in Tenure and Promotion Committees
and the percentage of women with tenure favored men, even when controlling for factors such as field, career age, and institution type. The 2001 NRC report also included individual factors such as citizenship, marital status, and family status, in addition to whether the institution was public or private. A parallel analysis for male and female full professors found similar results.
Perna (2001a) sought, among other questions, to assess whether the probability of being tenured or holding the rank of full professor was related to gender, after controlling for other factors that might affect the tenure and promotion decision. Perna used logit analysis on a different national data set, the 1993 NSOPF. Two findings are of interest: “Women and men who are participating in the tenure process appear to be equally likely to be tenured after taking into account other differences” (p. 561). On the other hand, the study notes, “Tenured women faculty at 4-year institutions are less likely than tenured men faculty to hold the highest rank of full professor even after controlling for differences in human capital, research productivity, and structural characteristics” (p. 561).
Ginther’s analysis (2001) pooled cross-sectional samples of tenured or tenure-track faculty from the 1973 to 1997 SDR. She created a second analysis file by linking data on individuals who received a Ph.D. between 1972 and 1989 and who were sampled across several SDR waves. Ginther used probit models and duration models to assess whether there are gender disparities in the probability of “promotion to tenure.” Her principal finding was “women are less likely to be promoted than men” (p. 20). Hazard analysis also suggested that women are about 12 percent less likely to be tenured.
Like the Ginther study, a recent study conducted by the NSF (2004d) used linked SDR data on individuals over time to examine whether gender was related to either particular outcomes on the career path or how long it takes “doctorate recipients to achieve career milestones” (p. 1). This study found that “women with eight or nine years of postdoctoral experience are about 5.9 percentage points less likely than men to be tenured. The comparable estimate for women with 14 or 15 years of experience is about 4.1 percentage points” (p. 3). Similarly, women were less likely to be full professors: “After accounting for controls, women with 14 or 15 years of postdoctoral experience who are employed full-time in academia are almost 14 percentage points less likely than men to be employed at the rank of full professor. The comparable estimate for women with 20 or 21 years of postdoctoral experience is similar” (p. 3).
Two competing hypotheses could underlie these findings. First, it could be that women present weaker cases for tenure due to lower productivity. Alternatively, women’s lower rates of promotion could result from bias that causes women with equivalent qualifications to be judged less positively than similar male colleagues. With regard to the first hypothesis, the SDR provides some support for the case that female faculty produced less scholarly output in terms of numbers of publications. It has been proposed that women have fewer publications either because they receive fewer resources from their universities to support research, or
because women spend less time on research. Although it is plausible that women could spend less time on professional activities if they are the primary caregivers at home and have more responsibilities outside of work, our data, presented in Chapter 4, show that in four of the six disciplines considered, women and men spend comparable percentages of their time in research-related activities.
The second rationale to explain why women might have a lower likelihood of receiving tenure or a promotion is evaluative bias on the part of their peers during tenure or promotion decisions. Bias may occur in several ways. First, women’s research may be undervalued by colleagues. Second, women’s teaching evaluations may not be as positive as those for men because of student bias. Third, women’s external letters of recommendation may not be as positive.7 However, determination of which two competing hypotheses provides the better explanation for why women take longer to achieve career milestones can only be addressed through the collection of longitudinal data tracking candidates as they go from degree through the various career stages.
A newer study on probability of faculty receiving tenure and promotions has found a much more equitable situation. Ginther and Kahn (2006) recently examined three issues with respect to gender differences: (1) the probability of holding a tenure-track job within 5 years of receiving a Ph.D.; (2) for those who hold a tenure track job, the probability of having tenure 11 years after receiving a Ph.D.; and (3) for those who received tenure by 15 years past receipt of a Ph.D., the probability of being a full professor 15 years after receipt of a Ph.D. The study drew on the entire SDR from 1973 through 2001. As summarized in their abstract, the authors found “that in science overall, there is no gender difference in promotion to tenure or full professor after controlling for demographic, family, employer and productivity covariates and that in many cases, there is no gender difference in promotion to tenure or full professor even without controlling for covariates.”
The next section presents descriptive data on tenure and promotion, based on data collected in the committee’s departmental survey. By examining data on all tenure cases evaluated in the prior 2 years, this analysis avoids the pitfall of studying only men and women who currently hold faculty positions. The following section uses multivariate methods to explore the effect of structural factors on promotion decisions for male and female faculty.
TENURE AND PROMOTION AWARDS
Tenure Descriptive Data
In the case of tenure, the survey first asked whether departments engaged in any tenure decisions during the past 2 academic years (2002-2003 and 2003-2004). Most of the 417 responding departments (78 percent) indicated that
they did. Very similar results were obtained by disaggregating the departmental responses by discipline. In all fields, the percentage of departments indicating that they had such tenure cases was between 75 and 84 percent.
Responding departments noted a total of 768 tenure decisions. Most decisions were reported by public institutions (587), rather than private institutions (181). For individual departments that reported any tenure decisions, the median response was two tenure decisions (mean = 2.2), with a range from 1 to 15 decisions. By gender, 125 cases involved female faculty; 642 cases involved male faculty. In 1 case, the gender was not reported. In addition, for 9 cases, the tenure outcome was not reported by departments.
Across all the departments sampled, 15 percent of the tenure candidates were female, compared to 20 percent of the pool of assistant professors, a difference significant at better than .01. There are a number of possible explanations for the smaller percentage of women among tenure candidates compared to the percentage in the tenure pool. If women are more likely than men to resign their position before being proposed for tenure, then we would expect to see fewer women among the tenure candidates. On the other hand, if departments have substantially increased their efforts to hire more women on tenure-track appointments, the disparity may be due to the lag between the time at which a faculty member is hired and the time at which he or she is put up for tenure. Most institutions impose an upper bound on the number of years in which a faculty can serve in a tenure-track position. Early tenure decisions—while not truly rare—are not commonplace either. However, many universities allow for extending the allotted time by up to 2 years to accommodate new parental responsibilities.
The findings on percentages of women among tenure candidates were not uniform across disciplines. Women were most likely to be underrepresented in the fields where they accounted for the largest share of the faculty. Female faculty were considered for tenure in 27 percent of the cases in biology and 15 percent of the cases in chemistry. In both fields, their representation among the assistant professor pool was greater—36 percent of the pool in biology and 22 percent of the pool in chemistry. In the remaining four fields, the differences in representation were less pronounced, although in every case the percentage of women among tenure candidates was less than in the tenure pool. The percentage of women among tenure candidates was 16 percent in civil engineering, 11 percent in electrical engineering, 16 percent in mathematics, and 12 percent in physics. During the same period, the percentage of women among tenure-track assistant professors was 23 percent in civil engineering, 13 percent in electrical engineering, 22 percent in mathematics, and 16 percent in physics.
Contrary to the implication from previous research that the lower percentage of women among tenured relative to untenured faculty results from a lower probability of a positive tenure decision for women, the committee’s data showed the opposite. Controlling only for field and gender of the candidate, we found that a woman was marginally more likely than a man to receive tenure (p = 0.0567).
TABLE 5-4 Tenure Award Rates by Gender and Discipline
As shown in Table 5-4, men received tenure in 548 out of 633 cases (87 percent); women received tenure in 115 out of 125 cases (92 percent). (See p. 120 for an explanation of the use of summary survey data.).8 Disaggregated by field, women had a significantly higher percentage of being granted tenure only in chemistry, where each female faculty member up for tenure was successful. In the other fields, the differences were not significantly different for men and women.
Promotion Descriptive Data
We investigated next whether gender differences exist at the juncture of promotion from associate professor to full professor. Of 411 departments responding to the survey, 70 percent indicated that they had considered a case of promotions to full professor during 2 academic years (2002-2003 and 2003-2004). Over all the fields, 90 percent of men and 88 percent of women proposed for full professor were promoted (see p. 120 for an explanation of the use of summary survey data.). The difference between rates for men and women was not statistically significant, nor were any of the discipline-specific differences shown in Table 5-5.
Most of the 504 cases reported involved public institutions (402), rather than private institutions (106). For individual departments that reported some decisions, the median response was one promotion decision (mean = 2), with a range from 1 to 16 decisions. Disaggregated by gender, 74 cases involved female faculty and 433 cases involved male faculty. In 1 case, the gender was not reported. In addition, among the 508 total cases, the outcome was not reported in 3 cases.
Disaggregated by discipline, female faculty were considered for promotion to full professor in 24 percent of the cases in biology, 14 percent in chemistry, 18 percent in civil engineering, 17 percent in electrical engineering, 9 percent in mathematics, and 7 percent in physics. During the period covered by the faculty survey, the percentage of women among associate professors in the different disciplines was 28 percent in biology, 18 percent in chemistry, 15 percent in civil engineering, 13 percent in electrical engineering, 15 percent in mathematics, and 8 percent in physics. It appears that women are proposed for promotion to the highest academic rank at approximately the same rates at which they are represented among associate professors.
Factors Influencing Tenure and Promotion Decisions
The outcome of a tenure or promotion decision is the product of individual and departmental characteristics. Individual characteristics focus on evaluations of the faculty member’s knowledge, skills, and abilities. In the area of research, evaluation may focus on a professor’s productivity, measured in terms of publications (i.e., journal articles, books, and chapters), presentations to conferences, or
TABLE 5-5 Promotion to Full Professor by Gender and Discipline
|
Discipline |
Male |
Female |
Total |
||||
|
Promoted |
Not Promoted |
Percentage Not Promoted |
Promoted |
Not Promoted |
Percentage Not Promoted |
||
|
All fields |
387 |
43 |
10.0 |
65 |
9 |
12.2 |
504 |
|
Biology |
50 |
11 |
18.0 |
17 |
2 |
10.5 |
80 |
|
Chemistry |
65 |
4 |
5.8 |
10 |
1 |
9.1 |
80 |
|
Civil engineering |
53 |
6 |
10.2 |
10 |
3 |
23.1 |
72 |
|
Electrical engineering |
69 |
10 |
12.7 |
14 |
2 |
12.5 |
95 |
|
Mathematics |
68 |
9 |
11.7 |
7 |
1 |
12.5 |
85 |
|
Physics |
82 |
3 |
3.5 |
7 |
0 |
0.0 |
92 |
|
SOURCE: Survey of departments conducted by the Committee on Gender Differences in Careers of Science, Engineering, and Mathematics Faculty. |
|||||||
ability to obtain grants. Teaching evaluations are used as a metric of instructional performance, as is the amount and quality of graduate student supervision. Counts of how many and what kind of university committees and outside professional activities in which a faculty member is involved, and in what capacity, are used to measure service.
Factors affecting these research, teaching, and service performance measures can also have an indirect effect on tenure decisions. Faculty with children, for example, may have less time to pursue research or service activities, and this may reduce a faculty member’s chances of being granted tenure. Departments with policies that aid faculty who would otherwise be more negatively affected by family issues—for example, institutions that provide child care or family leave—might mitigate the negative effects of these indirect factors and thereby aid the tenure chances of those faculty members particularly affected by family issues.
Departmental and institutional characteristics also directly affect tenure outcomes. In the most obvious case, both male and female faculty will have lower probabilities of gaining tenure in departments that rarely grant tenure to assistant professors, preferring instead to hire tenured associate or full professors. Different institutions—measured in terms of prestige or type (public versus private)—may grant tenure or promotion at different thresholds. For example, “nationally, about 60 percent of scholars competing for university and college tenure slots gain permanent appointments. At MIT, it is estimated almost 50 percent of the men and women on the tenure track will be invited to make their permanent intellectual home at the Institute.”9
The committee’s survey asked for departments to report institutional characteristics related to individual tenure decisions, but did not ask department respondents to provide information on the individual faculty member beyond their gender and the outcome of the case. Therefore, the model developed here is intentionally underspecified. It does not include likely salient individual factors that influence tenure outcomes. It focuses instead on examining departmental characteristics and policies that might help or hinder female as opposed to male faculty. Factors of particular interest include:
Department size. Larger departments may have more slots available and may therefore provide more opportunities for an assistant professor to advance.
Stopping the tenure clock. Many universities allow faculty to stop or extend the tenure clock if they have a qualifying event, such as the need to care for a family member. Generally, universities limit the number of years that can be added to the period before an assistant professor must be considered for promotion. Either male or female faculty can qualify for delaying the tenure clock. However, use of
|
9 |
Anonymous, March 1, 1999, Women and Tenure at the Institute, MIT News Office, available at http://web.mit.edu/newsoffice/1999/trwomen.html. See also Hopkins (2006). |
stop-the-tenure-clock policies does extend the period of uncertainty for faculty. In our faculty survey, 78 percent of assistant professors reported that their department or university had a formal family or personal leave policy that allows stopping or extending the tenure clock.
Transparency of tenure and promotion policies. It has been argued that unclear tenure or promotion policies would be particularly detrimental to women if women faculty are less likely to have mentors and obtain information through informal channels. However, evidence collected in the faculty survey indicated that women were at least as well connected to information sources as men. As shown previously, female faculty were more likely than male faculty to have a mentor, and women appear to be as well informed as men about the tenure process (see Appendix 5-1). When asked, 88 percent of both men and women responded that they knew their institution’s policy on tenure. However, 81 percent of male faculty but only 75 percent of female faculty responded that they knew their institution’s policy on promotion (or knew there was no institutional policy)—which was a significant difference (p = 0.02). Most departments use multiple means of informing faculty about tenure policies and procedures: 78 percent of departments reported that the university has written tenure and promotion policies, and 49 percent reported that the department has written procedures.
Departmental culture. Inclusive departments are more likely to pay greater attention to equity. We examined whether departments with more representation of women among the faculty were more or less likely to tenure assistant professors, and whether this varied by gender of the candidate. We also examined whether the percentage of women among untenured assistant professors affected the probability of success of male or female tenure candidates.
Public institutions. Private universities tend to have longer probationary periods than public institutions (NRC, 2001a). Some private institutions prefer to hire junior faculty without tenure and senior faculty with tenure, making it difficult to cross from one status to the other within the institution. Ginther (2001) found that being at a private institution decreased the probability of promotion to tenure. It is less clear whether women’s chances of promotion differ relative to those of men at public versus private institutions.
Prestige. Ginther (2001) found evidence that being at a top-ranked university, as defined by rankings provided by the Carnegie Foundation, increased the probability of a promotion to tenure. Note, however, that Ginther’s study involved a broader set of institutions than is employed in this study. If top-ranked universities strive to hire only people they expect to tenure, it may be harder to get hired, but easier to gain tenure at such institutions. Conversely, though, some top institutions are less inclined to tenure their own assistant professors.
Multivariate Analysis
Tenure
To explore whether the observed differences between men and women in their success at receiving tenure were statistically significant, and whether some of the variables described above explained those differences, we fitted a generalized linear model to the binary outcome indicating whether a tenure decision was positive or negative. We included various institutional and departmental attributes as explanatory variables in the model, and used the method of generalized estimating equations (GEE) to account for a potential correlation among tenure decisions in the same departments within the same institutions. The explanatory variables included in the model were the following: discipline, gender of the tenure candidate (the variable of interest), prestige of the department, whether the institution was public or private, whether the department allowed faculty to extend the tenure clock for reasons including the arrival of a child, the percentage of tenure-track assistant professors in the department who were female, the percentage of females among the entire faculty of the department, and various two-way interactions between the gender of the tenure candidate and other variables. We did not include in this model any variables that might reflect the productivity of individual faculty members. The reason for this was that the subset of cases with complete information for all variables was relatively small.10
Results from this analysis are difficult to interpret, at least with regard to gender. While women appeared to be slightly more likely to be promoted and tenured than men, the effect of gender on tenure decision must be interpreted cautiously. This is because the interaction between the gender of the candidate and the percentage of females in the tenure-track pool was also evident. Women appeared to be more likely to be promoted when there was a smaller percentage of females among tenure-track faculty. Therefore, the difference between women and men in their tenure success was more pronounced in departments with fewer women assistant professors. After accounting for all the avenues through which gender affects tenure, across all fields, 93 percent of women and 83 percent of men who were considered for tenure were successful.
Assistant professors (both male and female) were significantly more likely to receive tenure at public institutions, where 92 percent of those considered became tenured, than at private institutions, where 85 percent gained tenure (p = 0.029). The probability of gaining tenure was greater in departments of lower (p = 0.017) or medium (p = 0.073) prestige compared to those in the highest prestige category.
Because the presence of the interaction between the gender of the candidate and the percentage of women among tenure-eligible faculty prevented us from
interpreting the impact of either gender or percentage of females among assistant professors on tenure decisions, we did not attempt to untangle other associations. Figures 5-1 and 5-2 show the estimated probability of a positive tenure decision for men and women as a function of the percentage of tenure-eligible faculty who are female and as the proportion of female faculty in the department. To compute the probabilities in Figure 5-1, we held all other factors constant. Similarly, to compute the probabilities in Figure 5-2, we held the percentage of women among tenure-eligible faculty constant at 10 percent (two outer curves) or at 50 percent (two inner curves) for men and women.
Discipline, stop-the-clock policies, and overall departmental size were not associated with the probability of a positive tenure decision for either male or female faculty.
As a final comment, we note that when an interaction between a discrete covariate and other covariates in the model is present and the outcome variable is discrete (as is the case in our logistic regression model for tenure decision), unequal residual variances in each of the levels of the discrete covariate can have a profound effect on inference. Unequal group variances inflate the size of the estimated regression coefficients, thus introducing a bias in predictions relevant to differential outcomes for men and women. Therefore, trying to determine the effect of a covariate on, for example, male and female faculty cannot be done in
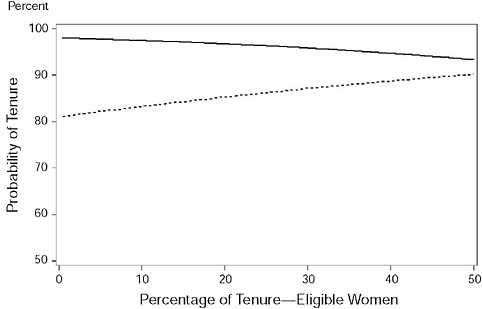
FIGURE 5-1 Probability of tenure for male and female candidates as a function of the percentage of tenure-eligible women in the department. Solid line corresponds to women and dotted line to men.
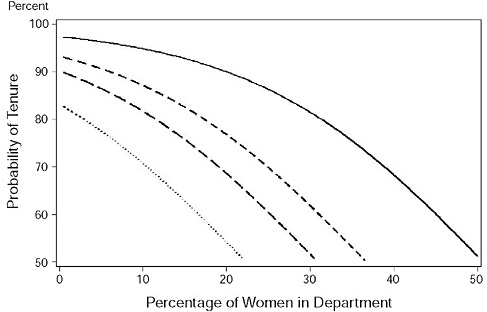
FIGURE 5-2 Probability of tenure for male and female candidates as a function of the percentage of women in the department. The solid line corresponds to female candidates when the percentage of tenure-eligible faculty who are women is 10 percent. The dotted line corresponds to men. The two inner curves correspond to women (upper) and men (lower) when the percentage of tenure-eligible faculty who are women is 50 percent.
the usual manner. The class of models known as heterogeneous discrete choice models (e.g., Alvarez and Brehm, 199511) has been proposed for analysis of this type of data.
Promotion
We again fitted a generalized linear model to the binary outcome indicating the promotion decision and accounted for possible correlation between cases in the same department within the same institution by implementing the method of GEE to obtain improved standard errors for all model parameters. Most of the explanatory variables in the promotion decision model were the same as those used earlier in the tenure decision model. Here, however, we considered the percentage of women among tenured associate professors to be the “promotion pool.”
None of the variables included in the model appeared to be associated with the probability that a candidate was promoted to full professor. In particular, there were no significant differences (p = 0.607) in the probability of promotion to full professor due to gender of the candidate, after accounting for the other potentially important factors. Therefore, it appears that once proposed for promotion to full professor, women and men fare about the same across all types of institutions and departments.
There are several reasons our analyses may produce different results than those reported previously in the literature. First, the studies use different samples; for example, faculty at different types of institutions or in different fields. A more interesting difference is conceptual. While the committee’s survey focused on the tenure and promotion decision, most prior studies focus on whether or not an individual is tenured or promoted by a particular point in time. To better illustrate this distinction, one can compare the results of a 2006 Pennsylvania State University study of faculty cohorts entering the tenure track between 1990 and 1998 As Table 5-6 shows, 7 years after entering the tenure track, the percentage of men who were tenured professors at Penn State was higher than the percentage of women who were tenured.
However, in a second analysis, Dooris, Guidos, and Miley (2006) examined the outcome of reviews of faculty who were evaluated 6 years after being hired. As seen in Table 5-7, the rates for men and women were not significantly different at the sixth year review, with observed values of 90 percent for men and 87 percent for women (p = 0.69). The differences between these two ways of examining the data may be due to the departure from Penn State by some faculty, who never came up for review. Alternately, the results may reflect that some faculty took leave, delaying the tenure decision for them beyond the sixth year.
These two foci—tenure status after a specific time period and tenure decisions—correspond to different but partially overlapping groups of faculty. In the committee’s study, the denominator included any faculty who came up for a tenure or promotion decision. In the other studies briefly surveyed above, the denominator included both individual faculty who came up for a decision and tenure-track faculty who have not yet reached that point. A second reason is that men and women may spend different amounts of time at each rank. This topic is discussed below.
TIME IN RANK
Although women are as successful as men when they are considered for tenure, differences in gender distributions at different faculty ranks may relate to differences in how long men and women spend within ranks. In general, the literature suggests women take longer to get tenure or a promotion. According to one study, across all fields (S&E and non-S&E) except for engineering and mathematics/statistics, women wait longer to attain tenure. Significant differences
TABLE 5-6 Tracking Cohorts Entering the Tenure Track Through 7 Years: Pennsylvania State University
|
Cohort Year |
All Entrants |
Female |
Male |
||||||
|
Entrants |
Tenured |
Rate (%) |
Entrants |
Tenured |
Rate (%) |
Entrants |
Tenured |
Rate (%) |
|
|
1990 |
121 |
70 |
58 |
40 |
19 |
48 |
81 |
51 |
63 |
|
1991 |
93 |
55 |
59 |
30 |
15 |
50 |
63 |
40 |
63 |
|
1992 |
151 |
89 |
59 |
55 |
28 |
51 |
96 |
61 |
64 |
|
1993 |
103 |
55 |
53 |
31 |
12 |
39 |
72 |
43 |
60 |
|
1994 |
134 |
63 |
47 |
50 |
17 |
34 |
84 |
46 |
55 |
|
1995 |
127 |
70 |
55 |
53 |
30 |
57 |
74 |
40 |
54 |
|
1996 |
91 |
45 |
49 |
29 |
12 |
41 |
62 |
33 |
53 |
|
1997 |
160 |
87 |
54 |
52 |
25 |
48 |
108 |
62 |
57 |
|
1998 |
183 |
107 |
58 |
75 |
38 |
51 |
108 |
69 |
64 |
|
Totals |
1163 |
641 |
55 |
415 |
196 |
47 |
748 |
445 |
59 |
|
SOURCE: Dooris, Guidos, and Miley, 2006: Table 1. |
|||||||||
TABLE 5-7 Results of Faculty Reviews at 2, 4, and 6 Years Following Hire: Pennsylvania State University, 2004-2005
|
Year |
Total |
Men |
Women |
||||||
|
2nd |
4th |
6th |
2nd |
4th |
6th |
2nd |
4th |
6th |
|
|
No. of cases reviewed |
113 |
140 |
107 |
63 |
86 |
60 |
50 |
54 |
47 |
|
No. with continuation recommended |
109 |
121 |
95 |
61 |
75 |
54 |
48 |
46 |
41 |
|
No. forwarded for early tenure |
5 |
13 |
n/a |
3 |
9 |
n/a |
1 |
4 |
n/a |
|
Percent with positive recommendation |
96 |
86 |
89 |
97 |
87 |
90 |
96 |
85 |
87 |
|
SOURCE: Dooris, Guidos, and Miley, 2006: Table 3. |
|||||||||
in which men were favored were found in the biological sciences and psychology and the social sciences. In engineering, however, women were significantly more likely to receive tenure first (Astin and Cress, 2003). A separate study of physician faculty of U.S. medical schools found that women were “much less likely than men to have been promoted to associate professor or full professor rank after a median of 11 years of faculty service” (Tesch et al., 1995). Finally, Kahn (1993) found that for academic economists, the time between receipt of Ph.D. and tenure for men was 7 years, while for women it was 10 years. Data for individual universities also show this trend at such schools as the University of California, Berkeley, MIT, and Duke University (NAS, NAE, and IOM, 2007).
Data from the 2004 National Study of Postsecondary Faculty show that, among faculty who earned their doctorates in U.S. institutions and were employed full time in 1997 in academic institutions in biology, physical science, engineering, and mathematics, women averaged 9 years as assistant professors, compared to an average of 7.6 years spent by men, though this difference was not statistically significant at the 0.05 level (see Table 5-8, and Appendixes 5-4, 5-5). Female full professors were promoted to that rank an average of 13 years after first being hired, compared to an average of 10.1 years for men, which is statistically significant at the 0.05 level. Thus, the gap between men and women in years between first hire and most recent promotion grows between the associate and full professor ranks.
Consistent with the data on average time in rank, the NSOPF data showed a greater percentage of female associate professors (16.8 percent) spent 11 to 15 years as assistant professors, compared to 8.4 percent of male associate professors (Appendix 5-3), although this was not statistically significant at the 0.05 level. Twenty percent of male associate professors were promoted to that rank after 5 or fewer years as an assistant professor, compared to 13.1 percent of female associate
TABLE 5-8 Mean Number of Years Between Rank Achieved and First Faculty or Instructional Staff Job, by Gender, for Full-Time Faculty at Research I Institutions, Fall 2003
professors; although again, this was not statistically significant at the 0.05 level. The distribution of years spent in the associate professor rank shows 36.3 percent of men were promoted to full professor after 10 years or less, compared to 26.4 percent of women (see Appendix 5-5).12
The committee’s faculty survey differs in some respects from the NSOPF:04 data in that it includes only faculty at RI institutions and does not exclude faculty who earned their doctorates outside the United States. The sample size of 634 used to construct Table 5-9 reflects a loss of about 50 percent from the original sample of about 1,250 respondents, because information on time in rank could only be calculated for those faculty members who received at least one promotion at their current institution. Because neither sampling weights nor nonresponse weights were used, care should be taken in generalizing the results to the population of all faculty.
Despite the differences in samples, the committee’s survey found results similar to the NSOPF:04 study for time in rank. Table 5-9 presents data on the mean number of months that faculty who were promoted to associate professor in each of the six disciplines surveyed spent in the rank of assistant professor. Similar calculations were made for male and female full professors. Across the six comparisons for faculty who were currently associate professors, women averaged a significantly longer time in rank in all fields except civil engineering and electrical engineering, where women’s time in rank was not different from men’s. For current full professors, women spent significantly longer time in the rank of assistant professor in all disciplines, and in three disciplines, it was statistically significant.
It is interesting to note that the average number of months spent as an assistant professor has been rising over time, as indicated by the longer durations for both male and female associate professors, as compared to their counterparts who were promoted at an earlier time period and are now full professors.
The measure used in Table 5-9 does not include years spent as a postdoc, employed outside of academia, or unemployed. We also calculated the time that elapsed between the date of obtaining a Ph.D. and the date of promotion to associate professor with tenure, shown in Table 5-10. This second measure accounts for the time spent in one or more postdoctoral positions prior to the first tenure-track job. It shows the greater number of months to promotion to associate professor with tenure (an average of 95.0 [see Table 5-10] months compared to 68.6 months [see Table 5-9] spent as an assistant professor), with trends over time and contrasts by gender varying from those reported in Table 5-9. The number of months between receipt of Ph.D. and promotion to associate professor with tenure shows greater increases over time than the measure of time spent as an assistant professor, reflecting the increased prevalence and duration of postdoctoral appointments.
TABLE 5-9 Mean Number of Months Spent as an Assistant Professor
Although men in the full professor cohort generally experienced fewer months between receiving their Ph.D. and being promoted to associate professor with tenure than women, the results were very mixed for the sample of current associate professors.
Turning next to the promotion to full professor, Table 5-11 presents weighted means of time spent as an associate professor for the 311 full professors for whom data were available. In contrast to the NSOPF data, women who were currently full professors spent significantly more time as associate professors in chemistry, mathematics, and electrical engineering, where the differences between men and women were not significantly different at the 5 percent level. Overall, the data were not clear for both full and associate professors.
Multivariate Modeling of Time in Assistant Professor Rank
A Cox proportional hazards model13 was fit to the measure of time in rank as assistant professor. A nearly identical model was fit to the data on time elapsed
TABLE 5-10 Mean Number of Months Between Receipt of Ph.D. and Promotion to Associate Professor
|
Discipline |
Current Associate Professors |
Current Full Professors |
||
|
Men |
Women |
Men |
Women |
|
|
Biology |
158 (8) (13) |
135 (5) (27) |
102 (6) (13) |
122 (48) (20) |
|
Chemistry |
112 (4) (20) |
127 (9) (23) |
95 (3) (31) |
88 (5) (17) |
|
Civil engineering |
113 (6) (17) |
80 (4) (9) |
54 (4) (4) |
68 (5) (4) |
|
Electrical engineering |
110 (14) (4) |
77 (2) (11) |
78 (10) (11) |
85 (4) (10) |
|
Mathematics |
66 (9) (16) |
101 (10) (25) |
80 (3) (32) |
88 (4) (19) |
|
Physics |
134 (5) (20) |
113 (6) (20) |
105 (3) (34) |
104 (6) (14) |
|
NOTES: The first set of parentheses indicates standard error of the mean, and the second set of parentheses denotes number of observations used in the calculation. There were only 418 faculty with current rank as associate or full who were hired at their current institution as tenure-track assistant professors, who work full time, and who have a Ph.D. Only those faculty who were promoted to associate with tenure from assistant were used in the calculations. We omitted departments who did not provide information on gender of faculty, as well as one outlier who reported being unemployed for 27 years following graduation, three individuals with negative time to promotion (promotion happened before hire), and one person who spent 321 months as assistant professor. The numbers of cases used in Table 5-9 and here differ because we did not have reliable information about the time of graduation for some faculty. There were also several outliers. For example, a female math associate professor reported that 307 months (over 25 years) elapsed between obtaining her Ph.D. and her promotion to associate professor with tenure. A male math associate professor reported only 5 months elapsed between obtaining his Ph.D. and his promotion to associate professor with tenure. SOURCE: Faculty survey conducted by the Committee on Gender Differences in Careers of Science, Engineering, and Mathematics Faculty. |
||||
between receipt of Ph.D. and promotion to associate professor, except the second model could not include a measure of academic age, defined as time elapsed between Ph.D. and hire as tenure-track assistant professor. Other variables in both models included gender, discipline, current rank, an indicator for whether family leave was taken, type of institution (public or private), prestige, percentage of women among faculty in the department, and various two-way interactions with gender.
Results suggest that there is a complex interplay among the various factors in the model and time in rank as assistant professor. Only two of the factors—type of institution and the percentage of women among departmental faculty—appeared to have no significant association with time in rank as assistant professor. All other factors, including the interactions between gender and current rank, gender and academic age, and gender and prestige of the institution were significantly associated with time in rank as assistant professor.
Because of the presence of significant interactions, it is difficult to provide an interpretation of the effect of the main factors. In Table 5-12, we present some of
TABLE 5-11 Mean Number of Months Spent as an Associate Professor
the results obtained when fitting the Cox proportional hazards regression model and summarize findings via figures that show the probability of promotion to associate professor at each time point for men and women in different disciplines, who are of different current ranks and at universities of different prestige. Overall, it appears that women take significantly longer to achieve promotion to associate professor with tenure, but this gender effect is confounded with current rank, discipline, and various other factors.
TABLE 5-12 Results Obtained from a Cox Proportional Hazards Regression Analysis of 351 Cases That Had Complete Promotion and Covariate Information
|
Effect |
p-value |
Hazard Ratio |
|
Gender (1 = M, 2 = F) |
0.007 |
0.360 |
|
Current rank (1 = F, 2 = A) |
<0.0001 |
0.166 |
|
Academic age |
<0.0001 |
1.046 |
|
Academic age × gender |
<0.0001 |
0.981 |
|
Rank × gender |
0.001 |
2.282 |
|
Prestige |
0.007 |
0.483 |
|
Prestige × gender |
0.001 |
1.744 |
|
Family leave (0 = no) |
<0.0001 |
0.192 |
|
Biology vs. civil engineering |
0.307 |
0.709 |
|
Chemistry vs. civil engineering |
0.046 |
1.778 |
|
Mathematics vs. civil engineering |
<0.0001 |
4.126 |
|
Electrical engineering vs. civil engineering |
<0.0001 |
4.927 |
|
Physics vs. civil engineering |
0.154 |
1.511 |
A hazard ratio below 1 indicates individuals in the category with the higher value of the explanatory variable “survive” longer. In this case, a faculty member “survives” in the rank of assistant professor if, in the next month, he or she does not get promoted to associate professor with tenure. For example, in the absence of interactions between gender and other variables, we would have concluded the average “risk” a female faculty will be promoted to associate professor with tenure at a given time point (given that she had not been promoted up until that time) is about 36 percent of that of a male. However, the presence of significant interactions prevents us from drawing conclusions about the effects of gender, rank, prestige, academic age, and others individually.
Figures 5-3 (a-d) show the survival curves for men and women who are currently associate or full professors in biology at high-prestige institutions (Figure 5-3a) or at medium-prestige institutions (Figure 5-3b). Figures 5-3c and 5-3d show the corresponding survival curves for faculty in electrical engineering. Male full professors are represented by a gray solid curve and male associate professors are represented by a gray dotted curve. Female full professors are represented by a black solid curve and female associate professors are represented by a black dotted curve.
The plots shown in Figures 5-3 (a-d) reflect some of the complexities in the relationship between time in rank as assistant professor, current rank, gender, and prestige of the institution. For example, consider first biology. We note that at high-prestige institutions and at any time point t + 1, a male who was currently a full professor had a higher chance of getting promoted and tenured than a male
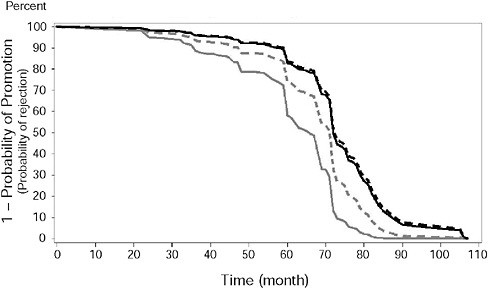
FIGURE 5-3(a) Survival curves in biology at highest prestige institutions.
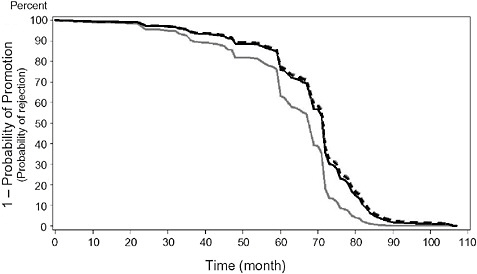
FIGURE 5-3(b) Survival curves in biology at medium-prestige institutions.
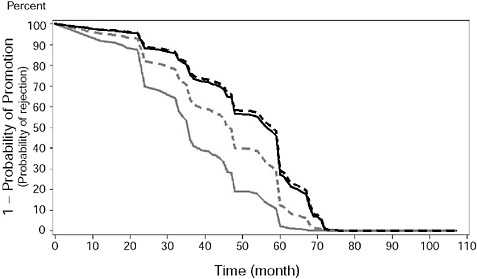
FIGURE 5-3(c) Survival curves in electrical engineering at highest prestige institutions.
who was currently an associate professor, and in turn, they both had a higher chance of promotion at month t + 1 (given that they had not been promoted until then) than a woman who was currently a full professor or a woman who was currently an associate professor. These differences vanish, however, if we consider institutions of medium prestige. In that case, while a man who was currently a full
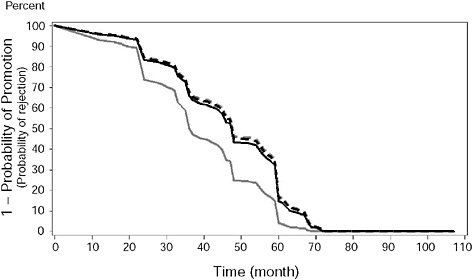
FIGURE 5-3(d) Survival curves in electrical engineering at medium-prestige institutions.
professor still had a higher chance of getting promoted at any time, given he has not been promoted earlier, there were no differences between faculty who were currently associate professors or women who were currently full professors. In the case of electrical engineering, we observed a similar pattern even though the probability of promotion increased to one at a faster rate.
Academic age (time between receipt of Ph.D. and hire as tenure-track assistant professor) was negatively and significantly associated with time as assistant professor: The longer the time elapsed between Ph.D. and hire, the shorter the time spent in rank as assistant. This finding is consistent with the greater publication record faculty who have spent time as postdocs can present at the time of a tenure review. Academic age may contribute to the gender differential seen in the simple means of time in rank by gender, since the effect of academic age is significantly stronger for men than for women (p < 0.0001). This greater impact may reflect that men may be more likely than women to spend time after receiving their doctorate and prior to taking their first academic job pursuing professional activities, such as postdoctoral research.
Another important factor affecting time in rank as assistant professor is the increasingly available option to take family leave and stop the tenure clock. Our results show a very significant effect of stopping the tenure clock (p-value < 0.0001; see Table 5-12). The “risk” of promotion of a faculty member who stopped the tenure clock is only about 80 percent of the “risk” of promotion of a faculty member who did not, given that neither had been already promoted at a given
time. Consider, as an example, two faculty members with similarly impressive academic credentials so that their “risk” of promotion becomes one if enough time has elapsed since hiring. If one of them takes a 1-year leave at the beginning of his or her probationary period, then he or she will lag behind the person who did not take the leave with respect to promotion status, but the difference in the “risk” of promotion will get smaller and smaller as the overall probabilities of promotion for both of them become larger. The effect of this factor was similar for both men and women. However, our data confirm that women were more likely to take family leave. Table 5-13 shows that 10.2 percent of female and 6.4 percent of male associate professors stopped the tenure clock. Also, stopping the clock is becoming more common over time. Virtually no faculty who are currently full professors stopped the clock, but among assistant professors, 19.7 percent of women and 7.4 percent of men have already stopped the clock. These percentages are likely to continue growing in the future.
One question our survey does not permit addressing is whether a faculty member who stopped the tenure clock has a decreased probability of promotion. To answer that question we would need a longitudinal study where faculty can be followed from the time they were hired until the time they were promoted. Our survey, which collected a snapshot cross-sectional set of data, is not appropriate for this type of question.
TABLE 5-13 Number of Faculty by Gender and Rank Who Reported Stopping or Not Stopping the Tenure Clock or Who Did Not Respond to the Survey Question
|
Gender and Rank |
Stopped Clock |
Did Not Stop Clock |
Nonrespondent |
Total |
|
Male full professor |
1 |
52 |
261 (83) |
314 |
|
Female full Professor |
2 |
46 |
18 (80) |
237 |
|
Male associate professor |
14 |
137 |
68 (31) |
219 |
|
Female associate professor |
29 |
184 |
71 (25) |
284 |
|
Male assistant professor |
17 |
211 |
2 (0.8) |
230 |
|
Female assistant professor |
56 |
226 |
2 (0.7) |
284 |
|
NOTES: Numbers in parentheses are percentage of nonrespondents in each group. Only full-time faculty with a Ph.D. and with the rank of assistant, associate, or full professor were used in the calculation. There were 1,568 such faculty. Note that many of these individuals are missing information on other variables, and thus this table includes many more persons than most of the other tables in Chapter 5. SOURCE: Faculty survey conducted by the Committee on Gender Differences in Careers of Science, Engineering, and Mathematics Faculty. |
||||
Men who are full professors today spent the least time in rank as assistant professors. This is true across all disciplines, prestige of institution, and other factors. Whether males who are currently associate professors have spent more or less time in rank as assistant than women who are currently full professors depends on the institution and discipline. It is probably fair to state that women who are currently associate professors have spent the longest time in rank as assistant professors in most cases.
Faculty in biology, physics, and civil engineering are similar in terms of time in rank as assistant professor. In chemistry, math, and electrical engineering, the time to promotion to associate professor was similar and significantly shorter. The difference between disciplines was similar for both genders. There were no significant differences between private and public institutions once all other effects were accounted for.
Results for the measure of time elapsed between award of Ph.D. and promotion to associate professor with tenure were different and easier to interpret from the results discussed above. Using this measure, the time in rank as assistant did not differ between men and women (although it took women slightly longer to be promoted to associate from the time of graduation with a Ph.D.), and it did not differ across institutions of different prestige. Time elapsed between Ph.D. and promotion to associate was highest for faculty who were currently associate professors (as before) and for faculty in biology relative to the other disciplines.
Multivariate Modeling of Time in Associate Professor Rank
To examine what institutional and individual characteristics influence the number of months full professors in our sample spent as associate professors before being promoted, we examined data on 265 respondents. It was necessary to limit the sample to those full professors who had remained at the same institution since they were hired as assistant professors in order to obtain relevant data on institutional characteristics and policies. The sample does not include 20 cases who reported first being promoted to associate professor without tenure and then to associate professor with tenure. The attrition in the analysis sample due to data constraints limits the generalizability of the results to faculty who progressed from assistant professor to associate professor with tenure and then to full professor at the same institution.
Time in rank as associate—computed as the difference in months between first promotion to associate with tenure and promotion to full professor—was modeled as a function of individual characteristics (including gender, discipline, and academic age) and institutional characteristics (including public/private university, prestige, tenure clock policy, and percent of female faculty in the department). All two-way interactions with gender were also estimated. We again used a Cox proportional hazards regression model to explore the association between time in rank as associate and institutional and individual attributes.
Overall, there was no significant difference between male and female faculty in the time spent as an associate professor. Faculty (both male and female) at the higher prestige institutions spent longest in rank as associate professors, while males at the lowest-prestige institutions received promotion earliest. For example, in biology, the probability of promotion after about 8.5 years in rank as associate professor was approximately 80 percent at institutions of highest prestige for both men and women. At institutions of lower prestige, about 80 percent of the men were promoted after 5 years in rank as associate, while 6.8 years elapsed before 80 percent of the women at the lowest prestige institutions received promotion to full professor. Women in universities ranked in the bottom two tertiles spent about the same amount of time in the associate rank. There were no statistically significant differences across disciplines or between public and private institutions. Academic age was positively associated with time in rank.
Figure 5-4 shows the (conditional) probability of promotion to full professor at month t + 1 given that no promotion had occurred until month t. The six curves correspond to prestige of the institution (highest = light gray, middle = dark gray, lowest = black) and to gender (solid = male, dotted = female). Figure 5-4a was drawn for biology at a private institution with 17 percent female faculty, and Figure 5-4b was drawn for electrical engineering.
Figures 5-4 (a-b) show the (conditional) probability of promotion to full professor at month t + 1 given that no promotion had occurred until month t. The six curves correspond to prestige of the institution (highest = light gray, middle = dark gray, lowest = black) and to gender (solid = male, dotted = female).
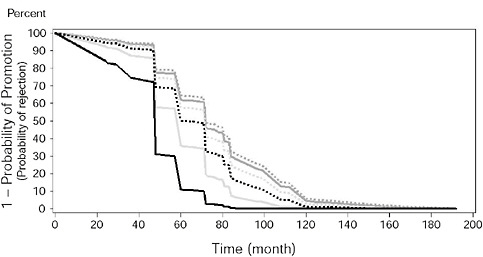
FIGURE 5-4(a) One minus the probability of promotion to full professor for men (solid curves) and women (dashed curves) in biology. Light gray denotes institutions of highest prestige, dark gray represents institutions of medium prestige and black represents institutions of lower prestige.
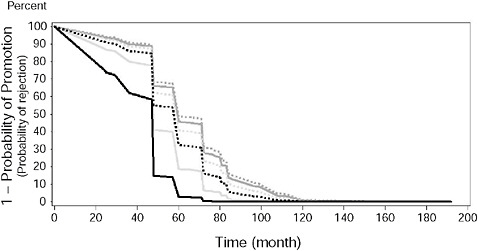
FIGURE 5-4(b) One minus the probability of promotion to full professor for males (solid curves) and females (dashed curves) in electrical engineering. Light gray denotes institutions of highest prestige, dark gray represents institutions of medium prestige and black represents institutions of lower prestige.
Figure 5-4a was drawn for biology at a private institution with 17 percent female faculty, and Figure 5-4b was drawn for electrical engineering.
SUMMARY OF FINDINGS
The survey results yielded some surprising findings about the award of tenure, promotion to full professor, and time and rank for female and male faculty members.
Award of Tenure
Finding 5-1: In every field, women were underrepresented among candidates for tenure relative to the number of female assistant professors. Most strikingly, women were most likely to be underrepresented in the fields in which they accounted for the largest share of the faculty—biology and chemistry. In biology and chemistry, the differences were statistically significant. In biology, 27 percent of the faculty considered for tenure were women, although women represented 36 percent of the assistant professor pool. In chemistry those numbers were 15 percent and 22 percent, respectively. This difference may suggest that female assistant professors were more likely to leave before being considered for tenure than were men. It might also reflect increased hiring of female assistant professors in recent years (compared with hiring 6 to 8 years ago). Note, however,
that the probability of representation in the tenure pool in a cross-sectional study such as this is completely confounded with time.
Finding 5-2: Given that the interaction between the gender of the candidate and the percentage of women in the tenure-track pool was statistically significant (p = 0.012), women appeared to be more likely to be promoted when there was a smaller percentage of women among the tenure-track faculty, resulting in a greater difference between men and women in their tenure success in departments with fewer female assistant professors. (Figures 5-1 and 5-2 and Appendix 5-3)
Finding 5-3: Women were more likely than men to receive tenure when they came up for tenure review. When controlling only for field and gender of the candidate, we found that women were marginally more likely than men to receive tenure (p =.0567). Women received tenure in 92 percent of the cases (115 out of 125) compared to 87 percent of the cases for men (548 out of 633). (Table 5-4)
Finding 5-4: Discipline, stop-the-tenure-clock policies, and departmental size were not associated with the probability of a positive tenure decision for either male or female faculty members who were considered for tenure. Both male and female assistant professors were significantly more likely to receive tenure at public institutions (92 percent) compared to private institutions (85 percent; p = 0.029). (Appendix 5-2)
Finding 5-5: Eighty-eight percent of both male and female survey respondents stated that they knew their institution’s policy on tenure. Eighty-one percent of male faculty knew their institution’s policies on promotion. However, only 75 percent of female faculty respondents knew their institution’s policy on promotion, which is statistically significant (p = 0.02). (Appendix 5-1)
Promotion to Full Professor
Finding 5-6: For the six disciplines surveyed, 90 percent of the men and 88 percent of the women proposed for full professor were promoted—a difference that was not statistically significant. There was no significant difference in the probability of promotion to full professor due to gender of the candidate, after accounting for other potentially important factors such as disciplinary differences, departmental size, and use of stop-the-tenure-clock policies. Once proposed for promotion to full professor, women and men appear to have fared about the same across all types of institutions and departments. (Table 5-5)
Finding 5-7: Women were proposed for promotion to full professor at approximately the same rates as they were represented among associate pro-
fessors. Female faculty in biology were considered for promotion in 24 percent of the cases (28 percent of the associate professor pool); 14 percent of the cases in chemistry (18 percent of the pool); 18 percent of the cases in civil engineering (14 percent of the pool); 17 percent of cases in electrical engineering (13 percent of the pool); 9 percent of cases in mathematics (15 percent of the pool); and 7 percent of the cases in physics (8 percent of the pool). (Table 5-5)
Time in Rank
Finding 5-8: Time in rank as an assistant professor has grown over time for both male and female faculty. Men who were full professors at the time of the survey had spent the least amount of time in rank as assistant professors. This was true across all disciplines.
Finding 5-9: Women who were associate professors at the time of the survey had averaged a significantly longer time in rank as assistant professors in all fields except electrical engineering, where women’s shorter time in rank was not significantly different (p = 0.999). It is difficult to determine whether these apparent differences persist once we control for individual and departmental characteristics such as length of postdoctoral experience and stopping the tenure clock for family leave. While women did appear to remain at the rank of assistant professor longer than men, the differences between genders depended upon factors such as the prestige of the institution, the time elapsed since the completion of the doctoral degree, and the current rank of the individual. Both male and female faculty spent longer time in the assistant professor ranks at institutions of higher prestige. (Table 5-9)
Finding 5-10: Male and female faculty who stopped the tenure clock spent significantly more time as assistant professors than those who did not (an average of 74 months compared to 57 months). They had a lower chance of promotion to associate professor (about 80 percent) at any time (given that they had not been promoted until then) than those who did not stop the clock. Everything else being equal, however, stopping the tenure clock did not affect the probability of promotion and tenure; it just delayed it by about a year and a half. It is unclear how that delay affected female faculty, who were more likely than men to avail themselves of this policy. Although the effect of stopping the tenure clock on the probability of promotion and tenure was similar for both male and female faculty, 19.7 percent of female assistant professors in the survey sample availed themselves of this policy compared to 7.4 percent of male assistant professors. At the associate professor level, 10.2 percent of female faculty compared to 6.4 percent of male faculty stopped the tenure clock. (Table 5-13)
Finding 5-11: There is no significant difference between male and female faculty in terms of the time spent as an associate professor. Time in rank as associate professor is significantly associated with the prestige of the institution. Faculty at lower prestige institutions tend to be promoted to full professor earlier than those at the highest prestige institutions. (See Figures 5-4a and 5-4b for examples in biology and electrical engineering.)
Time from Receipt of Ph.D.
Finding 5-12: Overall, it appears that women faculty took significantly longer from receipt of Ph.D. to promotion to associate professor with tenure, but this gender effect was confounded with current rank, discipline, and other factors. It is difficult to determine whether these apparent differences persist once we control for individual and departmental characteristics such as length of postdoctoral experience and stopping the tenure clock for family leave. While women did appear to remain at the rank of assistant professor longer than did men, the differences between gender depended on factors including the prestige of the institution, the time elapsed since completion of the doctoral degree, and the current rank of the individual. (Table 5-12)
Finding 5-13: The longer the time elapsed between receipt of the Ph.D. and hire as an assistant professor, the shorter the time spent in rank before gaining tenure. Academic age may contribute to the gender differential seen in the simple means of time in rank by gender, since the effect of academic age was significantly stronger for men than for women (p < 0.0001).
Our findings, which focus on the tenure and promotion decisions themselves rather than the proportions of tenured women or female full professors, differ from previous studies that indicated women fare worse than men, both in receiving tenure and in being granted a promotion. It does appear that women spend longer in assistant professor positions than men, but the complex interplay between different factors and the small number of cases for analysis limit the extent to which we can state that gender is associated (or not) with time in rank.
This study’s findings on the success of female faculty in obtaining tenure may relate to the particular focus on scientists and engineers at the most research-oriented universities. Alternatively, these results may reflect an improved climate for women scientists and engineers in RI institutions, given that our data examine a relatively recent period (2002-2003 and 2003-2004).
The findings on women’s relative success in the tenure decision process relate importantly to our findings on time in rank. The greater time in rank as assistant professor among female faculty who are currently associate professors compared to men can be partly attributed to women’s greater use of stop-the-tenure-clock policies.
The committee interprets these data as indicating that stop-the-tenure-clock policies allowed women who are currently associate professors sufficient flexibility to both assemble a strong tenure case and tend to family responsibilities. In contrast, the cohort who are currently full professors did not benefit from the recently enacted stop-the-tenure-clock policies, and thus these women would have had to meet the same timetable as men, despite their greater family caretaking responsibilities. If they had not met the same deadlines they would not have been granted tenure and promotion and would not now be found among the ranks of full professors.
The growth in time in rank for assistant professors may be attributable in part to increasing expectations about scholarly productivity, reinforcing the need for women to avail themselves of family leave if they are to successfully earn tenure. Stop-the-tenure-clock policies, which are taken advantage of by both male and female faculty, further increase the average length of time faculty spend as assistant professors and thereby extend the period of uncertainty for these faculty.
These findings suggest that there have been major changes over time in women’s opportunities to succeed in academic careers. If some of these changes can be attributed to changes in university policies such as the stop-the-tenure-clock policy for family care, this is good news. It suggests that universities can change long-established policies that might have prevented one group of scientists and engineers from advancing to permanent careers within the institution. It also opens the door to considering other established university policies that may hinder our country’s ability to profit from creativity of all trained scientists, both male and female. For example, one policy that might be opened for reexamination is the usual requirement that all assistant professor appointments be full time. Part-time appointments would allow both women and men the opportunity to better balance family and career over time.