Gender Differences at Critical Transitions in the Careers of Science, Engineering, and Mathematics Faculty (2010)
Chapter: 3 Gender Differences in Academic Hiring
3
Gender Differences in Academic Hiring
This chapter examines this critical entry point into an academic career—and its components—with a primary focus on differences in hiring outcomes for tenure-track assistant professor and tenured associate or full professor positions, and how these differences might be explained. The following research questions are addressed:
-
Is gender associated with the probability of individuals applying for S&E positions in research-intensive institutions?
-
Given that an individual applies for a position, does a woman have the same probability of being interviewed as a man?
-
Given that an individual is interviewed for a position, does a woman have the same probability of being offered a position as a man?
As the chapter explores the impact of institutional and departmental characteristics, rather than the individual characteristics of potential applicants and job candidates, another way to frame the research questions is, what are the characteristics of research-intensive (Research I or RI) institutions associated with proportionately more applications from women, interviews of women, and offers to women?
The chapter is divided into five sections. We outline the hiring process with a focus on three key parts of the hiring process—applications, interviews, and offers. The final two sections describe faculty perceptions of hiring and institutional policies based on data from our faculty survey. A review of the relevant literature and research and what it suggests we should expect to find in our survey data can be found in Appendix 2-1.
THE HIRING PROCESS
The hiring process consists of a series of decisions made sequentially by an academic department and job applicants. A department is authorized to search to fill a faculty position. The search may be for a senior faculty member who will be offered a tenured position; for a tenure-track position, which has the potential to become a tenured position, but does not provide tenure at the time of hire; or for both. This chapter separately considers tenure-track positions and tenured positions for which the six science and engineering departments in Research I institutions surveyed completed searches in the period 2002-2004. This report does not report on positions off the tenure track because no data were collected on these openings.
This section briefly outlines the steps in the hiring process as follows:
-
the department’s actions in advertising the availability of a position;
-
the individual’s decision on whether to apply for the position;
-
the department’s choice of individuals to interview and to make the first offer to; and
-
the individual’s choice of whether to accept the offer.
Each of these steps is described below.
Advertising the Position
As part of the process that authorizes a department to fill a faculty position at a tenured or tenure-track level, the department determines the subfield(s) that the individual will be expected to fill (both in a research and teaching capacity). Tenure-track positions at the assistant professor level are advertised nationally in journals and at national conferences. Letters may also be sent to department chairs or faculty in a particular subfield notifying them of open positions. Efforts are generally made to make the hiring process for tenure-track positions appear open and equitable. Advertisements note that the institutions follow Equal Employment Opportunity (EEO) rules, and many ads specifically encourage applications by women and minorities. At this point in the process, it is very likely male and female candidates are equally aware of most positions. That is, there is not likely to be a gender-based information gap.
In addition to national advertising, however, the hiring process for tenure-track positions also involves recruiting that could result in gender differences in application rates. For example, word-of-mouth recruiting practices by faculty may generate differences by gender, intentionally or not, in information about the position available to potential applicants. Search committees may try to overcome the limitations of established networks by making special efforts to increase the number of women applying for a given position.
The recruitment process for tenured positions may differ from the process for tenure-track positions in subtle ways. Although the advertising for tenured positions frequently mirrors the advertising for tenure-track positions, it is also common for a department to formulate a list of the leading candidates, based on its view of who is doing the most interesting and important research in that particular subfield, and to ask those on the list directly if they are interested in applying.
The Decision to Apply
Once a potential applicant is aware of a position, this individual may or may not choose to apply. In making this decision, a potential applicant may receive advice from many people, including the person’s mentor, department chair, peers, faculty at various institutions, family members, or spouse. A variety of factors may be taken into account in determining whether to apply. These include expectations about the desirability of the position (salary and benefits, prestige of the department, facilities, or workload); the location; and whether a spouse’s or other family member’s needs will be met. An important factor may also include the encouragement (or lack thereof) that potential applicants receive from the faculty members that they consult, particularly their dissertation or postdoctoral supervisors.
Requests for Campus Visits, Interviews, and Selection
Once applications arrive, decision making reverts to the institution, typically through an appointed search committee. At this point, the search committee ranks the applicants and determines whom to invite to campus for interviews or for preliminary interviews at professional society meetings. Search committees also consider a variety of factors in determining who they feel are the best candidates, including expectations of future productivity (e.g., research and grants received), ability to meet teaching needs, and perceptions of fit. “Fit” is perhaps the most subjective criterion. It is usually thought of as how well a particular candidate’s area of expertise or methodological approach works with the department’s current needs or vision for its future strengths and mission. However, it can also focus attention on a candidate’s demographic background or personality. Different search committees weigh these factors differently. Top candidates are invited to interview, which usually includes giving a talk about their research. This gives the search committee extra information on a few candidates. At the end of this process, often—but not always—an offer is made to a candidate.
The Decision to Accept or Reject the Offer
The final decision is made by the candidate whether or not to accept the offer. Again, the candidate weighs many factors in making this decision. These include the benefits of the position, other employment opportunities, and the
candidate’s preferences (possibly also including the preferences of a spouse or family members).
Data on Hiring
Data on the hiring process, as described above, are scant. Unfortunately, nationally representative information is not available. First, there is no national evidence on applicant behavior. It is not known if male and female S&E doctorates apply to positions in a similar manner. Second, evidence of how search committees select one candidate over another is lacking, perhaps because the selection process can be difficult to quantify. Third, there is little evidence describing the number of individuals who go through the hiring process. While departments collect information on the number of applicants who apply for a position and are interviewed, and while gender is often noted for these individuals, data are rarely made public for rather good reasons, including the right to privacy of job applicants.1 Further, comparable data on hiring activities at different universities are not generally available to allow an examination of how university and departmental search policies and practices affect hiring outcomes. National statistics such as the National Survey of Postsecondary Faculty or the Survey of Doctorate Recipients focus on individuals in their current positions. The SDR asks doctorates about their postgraduate plans and whether they are interested in a postdoctoral or academic position, but does not follow respondents any further. As a result, this chapter will draw primarily from this study’s departmental survey described in Chapter 1 and in Appendix 1-4.2
The survey asked chairs of the six targeted departments in each of the Research I institutions to report whether they had conducted any searches during the 2002-2003 or 2003-2004 academic years. Of the 492 surveyed, 417 responding departments reported a total of 1,218 searches, ranging between 1 and 15 searches per department. Responding departments were asked to identify whether the search was for a tenured or tenure-track position. In a few instances respondents wrote in “both” (17 out of 1,218), and to a lesser degree “target of opportunity” (5 out of 1,218). A few (40 out of 1,218) left this question unanswered. Respon-
|
1 |
However, some institutions do release their analyses of hiring. An excellent example is the 2003 gender equity report undertaken at the University of Pennsylvania, which presents important data for consideration and evaluation while maintaining anonymity. See http://www.upenn.edu/almanac/v50/n16/gender_equity.html. See also the report, University of California: Some Campuses and Academic Departments Need to Take Additional Steps to Resolve Gender Disparities among Professors, Report by the California State Auditor, 2001, available at http://www.bsa.ca.gov/pdfs/reports/2000-131.pdf. See also the report by the Commission on the Status of Women at Columbia University, Advancement of Women Through the Academic Ranks of the Columbia University Graduate School of Arts and Sciences: Where Are the Leaks in the Pipeline?, available at http://www.columbia.edu/cu/senate/annual_reports/01-02/Pipeline2a_as_dist.doc.pdf. |
|
2 |
The committee acknowledges that the p-values for all the data presented are unadjusted and that many of the data presented are interconnected. |
dents were then asked to provide data on the number of applicants and interviewees for each advertised position by gender. Finally, they were asked to identify the gender of the individual who was first offered the position and the gender of the person who was ultimately hired.3
In general, departments were much more knowledgeable about the later stages of the hiring process and thus provided more complete data on offers and hires than on interviews or applicants. The number of cases for which we had complete information on applicants, interviewees, first offers, and hires—all disaggregated by gender—varied between 534 cases (with complete hire information) and 758 cases (with complete applicant information). Thus, the number of cases considered in this chapter depends on the stage of the hiring process. Only tenured and tenure-track cases are considered in the analysis. For each stage in the hiring process (applications, interviews, offers), descriptive statistics based on the data collected from the departmental survey are first presented. Then, the appropriate statistical models are fit in order to understand the departmental characteristics associated with the percent of females at each stage of the hiring process.
APPLICATIONS FOR FACULTY POSITIONS
A necessary precondition for hiring a female faculty member is to have women who are interested in applying for the position. The survey data clearly show that some departments are more successful than others in attracting female applicants.4 Moreover, our data show that there are still a number of positions for which no women apply.
Throughout this report, we will present summary statistics, such as the following ones, that state current values for men and women across the six disciplines surveyed. These statistics do not reflect the survey weights5 and are not treated for the different degrees of nonresponse that depended on the characteristic examined. Therefore, these statistics are NOT appropriate estimates of any national characteristics for men and women, but instead are quick impressions of the data collected, which are often the beginning of a more meaningful analysis that is conditional on the disciplinary area.6
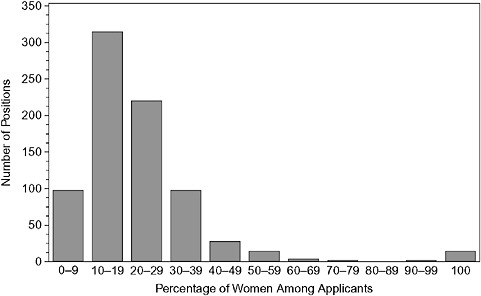
FIGURE 3-1(a) Percentage of females among applicants to all tenured and tenure-track positions.
Descriptive Data
While women are increasingly receiving Ph.D.s in Science and Engineering (S&E), they are still greatly outnumbered by men in terms of applications for Research I positions. For tenure-track jobs, the median number of applications a department receives is 52 applications from men and 8 applications from women—or about 7 applications from men for every application from a woman. For tenured positions, the median number of applications a department receives is 40 applications from men and 8 from women, for a ratio of 5 to 1.7 Figure 3-1(a) presents a histogram of the percentage of female applicants for all positions; Figure 3-1(b) presents this information for tenured positions; and Figure 3-1(c) presents this information for tenure-track positions.
Overall, departments received from 1 to 800 applications for their advertised tenure-track positions (n = 626), and 1 to 500 applications for tenured positions (n = 128). Departments recorded only 1 applicant for 17 (3 percent) tenure-track positions and 9 (8 percent) tenured positions. The survey results showed that 3 men and 2 women were hired through “target of opportunity” positions where
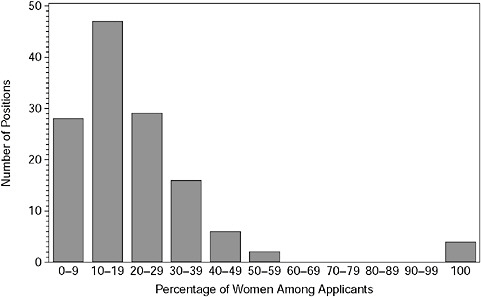
FIGURE 3-1(b) Percentage of women among applicants to all tenured positions.
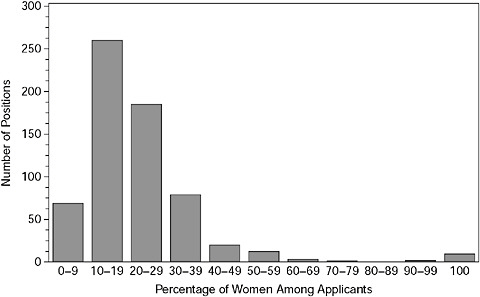
FIGURE 3-1(c) Percentage of women among applicants to all tenure-track positions.
SOURCE: Survey of departments carried out by the Committee on Gender Differences in Careers of Science, Engineering, and Mathematics Faculty.
TABLE 3-1 Number of Tenured and Tenure-Track Positions with Complete Information About the Gender of Applicants by Discipline
the position by intention was offered to only 1 candidate, though the rank at hire was not known. Table 3-1 shows the number of cases with complete applicant information by discipline and type of position (tenured or tenure-track). Note that the number of cases across discipline and type of position combinations is roughly similar, so no discipline contributes an inordinate proportion of the data to the analyses that follow.
Another finding is that for job openings for which only individuals of 1 gender applied, that gender was more likely to be male. For tenure-track positions, there were only 9 openings for which no men applied (only women applied), and 8 of these were cases in which only 1 woman applied. On the other hand, there were no female applicants (only men applied) for 32 tenure-track positions, or about 6 percent of available positions, with only 9 of these positions having a single applicant. Similar findings were seen for tenured positions. For 2 positions, no men applied. These were the 2 cases in which there was only 1 applicant. Conversely, no women applied to 16 tenured jobs, or 16.5 percent of the positions; only 7 of these were single-applicant positions. This finding may lend credence to the anecdotal argument sometimes propounded by chairs or search committees that no women applied for particular advertised positions (Brennan, 1996; see especially p. 9).
Considering the data by discipline, in the instance of tenure-track positions, most of the cases (29 of 32) in which only men applied occurred in physics or the engineering fields. For tenured positions, 10 of the 16 cases occurred in chemistry (6) and physics (4). This may reflect the fact that engineering and physics have a lower percentage of female doctorates or that female engineers and physicists are more likely to prefer employment outside of major research universities.
Finally, how do the percentages of female applicants relate to the percentage of women in the doctoral pool from which departments are drawing? One might expect the proportion of female applicants to be similar to the percentage
TABLE 3-2 Percentage of Women in the Doctoral Pool and Distribution of the Percentage of Women among Job Applicants for Tenure-Track Positions by Discipline
|
Discipline |
1999-2003 All Doctorate-Granting Institutions (percent) |
1999-2003 Research I Institutions Only (percent) |
Mean Percentage of Female Applicants for Tenure-Track Positions (percent)a |
|
Biology |
45 |
45 |
26 (8, 25, 50) |
|
Chemistry |
32 |
32 |
18 (6, 15, 39) |
|
Civil Engineering |
18 |
18 |
16 (0, 10, 100) |
|
Electrical Engineering |
12 |
12 |
11 (0, 10, 22) |
|
Mathematics |
27 |
25 |
20 (9, 20, 34) |
|
Physics |
15 |
14 |
13 (0, 10, 27) |
|
NOTES: In parentheses, we show the 5th percentile, the median, and the 95th percentile (computed over all tenure-track positions in each discipline) of the percentage of females among applicants. Only those tenure-track positions with complete information about the gender of candidates were included in these calculations (as in Table 3-1). a Mean percentage of female applicants computed as the average (over all tenure-track positions) of the percentage of females in the applicant pool. SOURCE: Ph.D. data are from the National Science Foundation. WebCASP distribution of the percentage of female applicants was computed using the same data used to construct Table 3-1. |
|||
of doctorates awarded to women in S&E across each of the disciplines. Table 3-2 suggests that this relationship is more complex. In the table, the second column shows percentages of doctorates awarded to women in the period 1999-2003 by doctorate-granting institutions, while the third column shows percentages of Ph.D.s awarded to women by the subset of Research I institutions.8 Data on the proportion of women among all applicants for tenure-track jobs by discipline are presented in column four.
In examining Table 3-2, it is important to note that while the second and third columns reflect averages over individuals, the last column relates to the percentage of women averaged over job openings. Thus, the values are not strictly comparable. An individual can apply to more than one job and may be counted multiple times as an applicant. If women are more likely to apply to multiple jobs than men, then the percentage of women among applicants is overestimated. Conversely, if women only apply to a few positions while men apply to many, then the average percentage of women applicants (and the rest of the distribution of the percentage of female applicants) is underestimated.
Table 3-2 shows that the percentage of applications from women are
consistently lower than the percentage of Ph.D.s awarded to women. There are, however, substantial differences among the disciplines in how much they are lower. In electrical engineering, mathematics, and physics, the percentage of women applying for faculty positions is only modestly lower than the percentage of women receiving Ph.D.s. However, in the fields with the largest representation of women with Ph.D.s—biology and chemistry—the percentage of Ph.D.s awarded to women exceeds the percentage of applications from women by a large amount. This finding should be further explored. Possible explanations that might be tested in follow-on research include:
-
Female biology and chemistry doctorates prefer occupations outside of research-intensive institutions relative to men (for example, in higher education, but in liberal arts colleges; in education as K-12 teachers; or in industry or government);
-
As the percentage of doctorates awarded to women increases, departments may make fewer special efforts to encourage women to apply for faculty positions; or
-
Female Ph.D.s in biology and chemistry apply for fewer jobs than women in other fields relative to men.
The first hypothesis may also, to a greater or lesser extent, hold for the smaller disparities found in civil engineering, electrical engineering, mathematics, and physics.
Another study examining the percentage of women in Ph.D. pools relative to the percentage of female faculty also found mixed results (NAS, NAE, and IOM, 2007). Comparing data for faculty who were tenure-track or tenured in 2003 with earlier averages of doctorates revealed that in engineering, chemistry, and the physical sciences, there was a smaller percentage of women in the Ph.D. pool than in assistant professor positions, while in the life sciences, computer sciences, and mathematics, the percentage of women in the pool of doctorates was larger. Comparing the doctoral pool to associate professors in engineering and life sciences, the percentage of women in the pool exceeded the percentage of female associate professors. In computer science, chemistry, the physical sciences, and mathematics, there was a greater percentage of female associate professors. Considering full professors, the percentage of female full professors in most fields was smaller than the percentage of women in the relevant doctoral pool.
Statistical Analysis
Having summarized earlier in this chapter the literature on the factors that are potentially associated with the percentage of applicants who are women, we now investigate whether the data on hiring collected in our surveys support the hypotheses put forth by earlier investigators. In our applicant models, the fol-
lowing institutional, departmental, and position-level variables measured in our survey were used as explanatory variables: discipline, type of position (tenured, tenure-track), whether the institution is private or public, the prestige level of the department advertising the position, the proportion of females in the search committee, the number of family-friendly policies advertised by the institution, whether the search committee chair is a man or a woman, the percentage of female faculty in the department, and the size of the metropolitan area in which the institution is located.
We first investigated whether any of these factors are associated with the probability that no women apply to a position.9 To do so, we first created a binary variable with the value 0 if there were no female applicants and the value 1 if at least one woman applied to the position. We excluded for this analysis those positions identified as target of opportunity and open rank positions. We fitted a logistic regression model to the binary outcome variable and included as predictors in the model the institutional, departmental, and position-level variables listed above, as well as two-way interactions between discipline and the other predictors to investigate whether any of the potential effects of predictors is discipline-dependent. To account for possible correlations within positions advertised by the same institution, we implemented the method of generalized estimating equations (GEE) to compute standard errors for all parameter estimates that account for possible correlations across positions in the same institution.
We found the probability that at least one woman would apply to a position is associated with the set of discipline indicators (p = 0.03), type of position (p < 0.0001), type of institution (p = 0.08), prestige of the institution (p = 0.04), and the number of family-friendly policies in effect at the institution (p = 0.001). No other factor was statistically associated with the probability of at least one female applicant. Results can be more easily understood by looking at the adjusted means of the differences in the probability of no female applicant across levels of some of the statistically significant factors. These adjusted means are the means computed after “adjusting for” or “accounting for” all other effects in the model. Technical details and the tables are given in Appendix 3-2. We then focused on all positions and modeled the number of female applicants as a function of the same independent variables listed above. To do so, we fitted a Poisson regression model to the number of female applicants and used total number of applicants as an exposure variable. Possible correlation across positions advertised by the same institution was accounted for when computing standard errors of parameter estimates via the method of generalized estimating equations method. Again, we only included positions that were advertised as tenured or tenure-track.
As expected, we found statistically significant differences across disciplines in the proportion of females in the applicant pool. Biology, chemistry, and math-
ematics had significantly higher proportions of female applicants than did all other disciplines across all types of institutions and positions. The proportion of female applicants in civil engineering, physics, and electrical engineering was significantly lower. The type of position was not substantially associated with the proportion of females in the applicant pool. The percentage of females among applicants to tenured positions was similar to the percentage of females among applicants to tenure-track positions.
It has been speculated that the appearance of a women-friendly environment attracts female applicants. Our results confirm this view. The percentage of women in the search committee and whether a woman chaired the committee were both significantly and positively associated with the percentage of women in the applicant pool (p = 0.01 and p = 0.02, respectively). For every 1 percent increase in the percentage of females in the search committee, we can anticipate an increase of about 0.7 percent in the percentage of women in the applicant pool. In contrast, the number of family-friendly policies advertised by the institution did not appear to be associated with the percentage of female applicants. Other factors including type of institution (public or private), prestige of the institution, and location of the institution had no association with the percentage of women in the applicant pool.
These results may thus support the argument that an individual applicant’s characteristics are relatively more important in determining application behavior. Institutions wishing to increase the number of applications from women may have to rethink current efforts or consider new strategies.
SELECTION FOR INTERVIEWS FOR S&E JOBS
This section examines the representation of women among candidates whom departments choose to interview. Prior to this survey, few data were available about the probability that a female applicant for an academic position will be interviewed as compared with the probability that a male applicant will be interviewed. There is, however, substantial literature suggesting that reviewers tend to discount the credentials and qualifications of female job applicants. Insofar as this discounting occurs among academic searches such literature might be relevant.
The committee’s departmental survey allows an examination of the percentage of women being interviewed and offered positions. This section examines the interviewing behavior of departments.
Descriptive Data
Our survey data allowed us to examine the actual behavior of departments for the 545 tenure-track and 97 tenured openings for which we have gender data for applicants, interviewees, offers, and ultimate hires. Across all the positions—tenure-track or tenured—an average of four men and one woman were interviewed
for any particular position. A cynical reader might wonder if this is the case because search committees are attempting to show they are fulfilling a diversity mandate by interviewing a woman. However, an examination of the data on the percentage of women interviewed reveals that the percentage does not decline as the number of interviews undertaken increases, as it would if each job search interviewed only one woman for appearances’ sake. This finding, however, masks two other important findings.
First, our survey data allowed us to examine the actual behavior of departments for the 545 tenure-track and 97 tenured openings for which we have gender data for applicants, interviewees, offers, and ultimate hires. The second and fourth columns of Table 3-3 draw on information from Table 3-2; that is, the mean percentage of female applicants for tenure-track jobs and the mean percentage of female applicants for tenured jobs. The third and fifth columns present the mean percentage of female interviewees for tenure-track positions and for tenured positions.
As the table shows, in every instance, the mean percentage of female interviews exceeds the mean percentage of applications from women. With the exception of civil engineering, for which the median percentage of female interviewees for tenured positions is zero, results are similar if we compare median percentages (rather than mean percentages), but we do not show those here. (The reason for a zero percent median percentage of women in interview pools in the case of civil engineering is the small sample size of 12 cases.)
Even though the percentage of females in interview pools exceeds the percentage one might expect from the representation of women in applicant pools, no woman was interviewed for 155 (28 percent) tenure-track positions and 41 (42 percent) tenured jobs. Of course, part of this number is comprised of cases for which there were no female applicants. Still, in 124 tenure-track job openings (23 percent), at least 1 woman applied, yet no women were interviewed. In 23 (24 percent) tenured jobs, at least 1 woman applied, but no women were interviewed. These figures are substantially higher than for men. No men were interviewed for 18 tenure-track positions or 3 percent (in nine of those cases, there were no male applicants) and for 4 tenured positions or 4 percent (in 2 of those cases, there were no male applicants).
Table 3-4 shows that for tenure-track jobs, mathematics by far had the lowest proportion of positions for which no women interviewed, followed by biology and chemistry. (These proportions are computed using all cases, including those with no female applicants.) For tenured positions, biology had the lowest proportion of positions for which no women interviewed, followed by physics.
At first glance, the proportion of positions for which no women were interviewed for tenure-track positions might seem high. In all cases, however, the percentage of positions for which no women interviewed was below what might have been expected if gender played no role in the process of selection of interview candidates and if we assume qualifications are not gender-dependent. For
TABLE 3-3 Mean Percentage of Females Among Applicants and Among Interviewees in Each Discipline
|
Discipline |
Tenure-Track |
Tenured |
||||
|
Applicants (%) |
Interviewees (%) |
n |
Applicants (%) |
Interviewees (%) |
n |
|
|
Biology |
25 |
30 |
111 |
29 |
34 |
20 |
|
Chemistry |
18 |
25 |
123 |
25 |
30 |
18 |
|
Civil Engineering |
16 |
30 |
72 |
19 |
30 |
13 |
|
Electrical Engineering |
11 |
19 |
75 |
9 |
17 |
12 |
|
Mathematics |
20 |
28 |
96 |
15 |
21 |
28 |
|
Physics |
13 |
20 |
124 |
19 |
32 |
25 |
|
NOTES: Means were computed as the average (across all positions with complete information about gender of applicants and interviewees) of the percentage of females among applicants (or interviewees) for the position. The numbers of positions listed in this table are smaller than the numbers listed in Table 3-1, and the mean percentage of female applicants to tenure-track positions are different from those displayed in Table 3-2. This is because here we only considered positions for which complete gender information about all applicants and interviewees was available. SOURCE: Survey of departments carried out by the Committee on Gender Differences in Careers of Science, Engineering, and Mathematics Faculty. |
||||||
TABLE 3-4 Percentage of Positions for Which No Women Were Interviewed by Type of Position
|
Discipline |
Tenured |
Tenure-Track |
||
|
Actual Percentage of All-Male Interview Pools |
Probability of All-Male Poolsa |
Actual Percentage of All-Male Interview Pools |
Probability of All-Male Poolsa |
|
|
Biology |
25 (20) |
18 |
22 (111) |
24 |
|
Chemistry |
50 (18) |
24 |
22 (123) |
37 |
|
Civil Engineering |
46 (13) |
35 |
33 (72) |
42 |
|
Electrical Engineering |
42 (12) |
62 |
35 (75) |
56 |
|
Mathematics |
39 (28) |
44 |
13 (96) |
33 |
|
Physics |
32 (25) |
35 |
38 (124) |
50 |
|
NOTES: Actual number of cases is given in parentheses. The expected number of positions with no women interviewed given the size and gender composition of the applicant pools (see Table 3-3) is computed as described in the text. The percentage of positions for which no women were interviewed is based on tenured and tenure-track positions for which complete information about gender of all interviewees was available. The data used to construct these values are the same as those used to calculate the statistics showing those interviewed divided by the total number of positions of each type and in each discipline for which complete gender information for all interviewees was available. aThese values are the probabilities of an all-male interview pool assuming that five interviewees were selected, the population of applicants was very large, and the frequency of men and women in the applicant pool equaled the percentages from Table 3-3. SOURCE: Survey of departments carried out by the Committee on Gender Differences in Careers of Science, Engineering, and Mathematics Faculty. |
||||
example, assuming five candidates were interviewed for each position, using a simple binary calculation and the proportion of females in the applicant pool from Table 3-3, for tenure-track positions we would expect about 50 percent of the interview pools to include no women in physics, 56 percent in electrical engineering, and 42 percent in civil engineering—the three areas with the lowest representation of women among applicants. In biology, we would expect about 24 percent of the tenure-track interview pools to include no women, again assuming five individuals are on average interviewed for each tenure-track position. In chemistry, the expected percentage of interview pools with no women is 37 percent and in mathematics it is 33 percent. In all cases the percentage of male-only interview pools for tenure-track positions in the six disciplines is smaller than the corresponding probability of an all-male pool. There are significant discipline differences. Electrical engineering and mathematics have the largest difference (21 percent and 20 percent, respectively) between their probability of an all-male pool and their actual interview pools of applicants.
This finding suggests that once tenure-track women apply to a position,
departments are on average inviting more women to interview than would be expected if gender were not a factor, or women who apply to tenure-track or tenured positions in research-intensive institutions are, on average, well qualified. It is important to note that these higher rates of success do not imply favoritism, but may be explained by the possibility that only the strongest female candidates applied for Research I positions. This self-selection by female candidates would be consistent with the lower rates of application by women to these positions.
For tenured positions, the expected percentage of interview pools with no women are 18, 24, 35, 62, 44, and 35 percent for biology, chemistry, civil engineering, electrical engineering, mathematics, and physics, respectively. The situation for tenured positions is much less clear. Electrical engineering, mathematics, and physics have smaller all-male interview pools than their probability pools. This is particularly true for electrical engineering, which had male-only interview pools 42 percent of the time compared to a probability of 62 percent. However, civil engineering, chemistry, and biology had larger all-male interview pools than expected, with chemistry being the most notable. Fifty percent of the interview pools for tenured positions in chemistry were all-male, while the probability value was 24 percent. This finding highlights the importance of disaggregating survey data by discipline.
Factors Associated with a Higher Percentage of Female Interviews
As with the analysis of applications, the analysis of interviews focused on departmental and institutional variables. Most of the factors in the applicant model are also used here: discipline; departmental climate, as measured by female faculty; female faculty on the search committee and family-friendly policies; public versus private universities; and prestige. Much of the literature on making hiring more equitable focuses on bringing actors with a broader view from outside the department into the decision making, so we expect intervention by a dean might also be positively related to the probability of interviewing a woman.
Because departments draw from the pool of applicants in deciding whom to interview, this analysis controls for the percentage of applications from women—the dependent variable from the last model. We expect a positive relationship between the percentage of applications from women and the percentage of interviewees who are women.
Statistical Analysis
The percentage of women in the interview pool appears to exceed the percentage of female applicants in all areas. We now investigate whether the percentage of women in the interview pool is associated with the institutional, departmental, and position-level characteristics described earlier and with two additional predictors: the percentage of female applicants and an indicator of whether the composition
of the interview pool is reviewed by a dean or other committee external to the search committee. We proceeded as we did when analyzing the percentage of female applicants. We first fitted a logistic regression model to the probability of no women in the interview pool. We then considered all positions and fitted a Poisson multiple regression model to the number of women in the interview pool to investigate whether institutional or position-level attributes are associated with the representation of women in the interview pool. We used the size of the interview pool as an exposure in the model, since the range in interview pool size was quite large, from 1 to 22. (The mean number of candidates interviewed for a position was 5.) In both cases, we accounted for the possible correlation among positions advertised by the same institution by computing standard errors of parameter estimates using the GEE method. The total number of cases considered for these analyses was 667. Of the 667 cases, there were no women in interview pools in 188 cases.
We have argued earlier that the probability of no women in interview pools is below what might be expected across many of the disciplines we reviewed. Results from the logistic regression modeling suggest further that the probability of female interviewees increases when the percentage of female applicants increases, as would be expected (p < 0.0001), with the percentage of women in the search committee (borderline significant, p = 0.06) and with the number of family-friendly policies advertised by the university (borderline significant, p = 0.07). When we account for all covariates, the adjusted mean probability that a woman who has applied to a position receives an invitation to interview is lowest in biology and not significantly different in any of the other disciplines. This would be expected given that biology has significantly more female applicants than other disciplines. The probability of women in the interview pool is significantly lower when the position is advertised as tenured than when it is advertised as tenure-track (p-value = 0.013). No other factor was significantly associated with the probability of having at least one woman in the interview pool.
Adjusted means of the probability of at least one woman in the interview pool, with the corresponding 95 percent confidence interval for the true mean probability, are presented in the table in Appendix 3-4. The values in the table corresponding to differences between levels of an effect represent the ratio of the odds ratios in each of the two levels. For example, if the probability that a woman will be interviewed in biology is 0.51, the odds ratio 0.51/0.49 is 1.04, meaning a female applicant is 4 percent more likely to be interviewed than not. If for chemistry the corresponding odds ratio is 4 (0.8/0.2, according to Appendix 3-4) then the ratio of odds ratios between biology and chemistry is 1.04/4 = 0.26. In other words, the “advantage” of a female applicant in biology is only 26 percent of that of a female applicant in chemistry. Calculation of all standard errors (and consequently, confidence intervals) in the table in Appendix 3-4 required using the Delta method. (The Delta method is described in Appendix 3-7.)
When we focused on the number of women in each interview pool, we found
that the percentage of female applicants is significantly (and positively) associated with the percentage of females in the applicant pool (p < 0.0001) and varies across discipline. For every 1 percent increase in the proportion of female applicants, the proportion of female interviewees increased by approximately 2 percent. The proportion of women in the interview pool was significantly lower in biology, electrical engineering, and physics relative to the other three areas. The effect of discipline, however, is difficult to interpret since the interaction between discipline and other factors is statistically significant. For example, the proportion of women interviewed in mathematics was not the same at public or private institutions. The difference in the percentage of female applicants between mathematics and civil engineering was larger in private institutions. Furthermore, women appear to be interviewed at a higher rate in the top 10 electrical engineering departments than in electrical engineering departments with lesser prestige. Because interpretation of main effects is problematic when interactions are present, we do not present adjusted means resulting from this analysis. No factor other than discipline and the representation of women among applicants (plus some interactions) was found to be associated with the percentage of women in interview pools.
OFFERS MADE
The final step in the search process is making a offer to one of the individuals interviewed. This section examines the percentage of offers made to women and the factors that may have an impact on this percentage. Table 3-5 presents data on whether the department’s search results in a first offer to a woman or a man, for the 108 tenured and 583 tenure-track jobs for which we have information on the gender of the applicant to whom an offer was made.
As the table illustrates, women received the first offer about 29 percent of the time for tenure-track positions and 31 percent of the time for tenured positions.
In Table 3-6, we present the distribution, over departments, of the percentage of women interviewees and offers for tenure-track and tenured jobs, which dem-
TABLE 3-5 Percent of First Offers by Gender and Type of Position
|
Type of Position |
First Offer to a |
||
|
Female |
Male |
Total |
|
|
Tenured |
31 |
69 |
108 |
|
Tenure-track |
29 |
71 |
583 |
|
NOTES: Only those positions for which complete gender information about interviewees to whom the first offer was extended are included. Thus, the total number of positions on which this table is based is smaller than the numbers shown in Table 3-4. These percentages represent offers in all six disciplines, and therefore may hide important disciplinary differences. SOURCE: Survey of departments carried out by the Committee on Gender Differences in Careers of Science, Engineering, and Mathematics Faculty. |
|||
onstrates that there is variability by discipline hidden by Table 3-5. However, the general pattern remains. Once again—similar to the case for interviews compared to applicants—women receive a greater percentage of first offers than interviews for all fields in the case of tenure-track positions. This finding also holds for tenured positions, except—interestingly—for biology.
Factors Associated with a Higher Probability that a Woman Will Be Offered a Position
The department typically decides who will receive an offer. Thus, the statistical analysis of offers made focused on departmental and institutional variables. Most of the factors included in the applicant and interview models are also used here: discipline; departmental climate, as measured by female faculty, female faculty on the search committee and family-friendly policies; public versus private universities; prestige; and intervention by a dean in the selection process. For availability, the model for offers uses the percentage of interviewees who were women—the dependent variable from the last model. It is assumed that there is a positive relationship between the percentage of interviews of women and the likelihood a woman will be offered the position.
Statistical Analysis
The response variable of interest was binary: a woman was first offered the position or the position was offered to a man. We considered all the institutional and position-level variables described earlier, with the following modifications. Instead of the percentage of female applicants, we now included the percentage of women in the interview pool, and instead of an indicator of whether the candidate pool is reviewed by a dean or an external committee, we included an indicator of whether a dean approves the hiring recommendation made by the committee. Since the probability that a woman will be offered the position when none was interviewed is clearly zero, we restricted these analyses to those positions for which interview pools included at least one woman. Similarly, we also deleted from these analyses those positions for which all interviewees were women. Thus, results presented here are conditional on having at least one woman and at least one man in the interview pool.
The only two factors that appear to be associated with the probability that a woman will be offered the position first are the percentage of women in the interview pool (p < 0.001) and whether the dean approved an offer (weak association with p = 0.06). When the dean reviews offers, the probability that a woman will be offered a position is 0.38, with a confidence interval of 0.26 to 0.50. This value is significantly larger than the 0.06 (95 percent confidence interval of 0.00 to 0.51) obtained in cases in which the dean has no role in reviewing offers. (The uncertainty around this latter value is high because of a very small sample size.
TABLE 3-6 Distribution of Percentage of Interviews with and Offers, to Women by Discipline
In almost all cases, deans play a role at the time of offering a tenure-track or tenured position to an applicant.) The size of the “dean effect” must therefore be interpreted cautiously. For every 1 percent increase in the percentage of females in the interview pool, the probability that a woman would be offered the position increased by about 5 percent. Finally, the probability that a woman would be offered the position was lowest at the top 20 research-intensive institutions compared with non-top 20 research-intensive institutions surveyed. At the highest prestige institutions (top 10), the probability that a woman would get an offer approached significance (p = 0.08). No other factors were associated with the probability that a woman would get an offer.
HIRES
Explaining hires made is more difficult, as the decision to hire involves the department, which makes the offer, and the applicant, who accepts. The committee’s departmental survey does not have information on characteristics of those ultimately hired, beyond their gender. However, the committee’s faculty survey did ask faculty some questions about reasons for accepting the position offered to them. Answers to these questions are explored in the next section of this chapter.
Table 3-7 presents data on the gender of the individual receiving the first offer and the gender of the faculty member ultimately hired for tenure-track positions.
In 95 percent of the cases in which a man was the first choice for a position, a man was ultimately hired in that position. Compare this to the case for women, where only 70 percent of cases in which a woman was first offered a position was a woman ultimately hired. In 30 percent of the cases in which women were offered first, a man ultimately ended up in the position.10
Table 3-8 presents data on the gender of the individual receiving the first offer and the gender of the faculty member ultimately hired for tenured positions.
In all cases in which a man was offered the position first, a man was ultimately hired. In only 77 percent of the cases in which a woman was offered the position first was a woman ultimately hired. In 23 percent of the cases in which a woman was offered the position first, a man was ultimately hired, again suggesting that if the woman who is first offered the position does not accept, there is a substantial chance the job will go to a man.
TABLE 3-7 Percent of Candidates of Each Gender Who Received the First Offer and Gender of Candidates Who Eventually Accepted Each Tenure-Track Position
|
Position Was Offered to |
Person Hired Was a |
|
|
Female |
Male |
|
|
Female |
70 (107) |
30 (46) |
|
Male |
5 (19) |
95 (362) |
|
NOTES: Number of cases is given in parentheses. Table 3-7 is based on the subset of the positions used to construct Table 3-6 for which the gender of the person who accepted the position was known. We do not know from these data whether the person who accepted the position is the same person who received the first offer, even in those cases in which the gender is the same. SOURCE: Survey of departments carried out by the Committee on Gender Differences in Careers of Science, Engineering, and Mathematics Faculty. |
||
TABLE 3-8 First Offer and Person Hired for Tenured Position, Percent by Gender
|
Position Was Offered to |
Person Hired Was a |
|
|
Female |
Male |
|
|
Female |
77 (20) |
23 (6) |
|
Male |
0 (0) |
100 (67) |
|
NOTES: Number of cases is given in parentheses. Table 3-8 is based on the subset of the positions used to construct Table 3-6 for which the gender of the person who accepted the position was known. We do not know from these data whether the person who accepted the position is the same person who received the first offer, even in those cases in which the gender is the same. Number of cases is given in parentheses. SOURCE: Survey of departments carried out by the Committee on Gender Differences in Careers of Science, Engineering, and Mathematics Faculty. |
||
We do not have information in our survey data to permit investigating this difference further. One plausible explanation is that many women who are offered positions are the only woman interviewed for that position. If the only woman interviewed is offered the position and turns it down (for whatever reason), that position will inevitably be filled by a man. In fact, only one woman was interviewed for 205 (38 percent) of the tenure-track and 23 (24 percent) of the tenured openings for which more than one person was interviewed. While there are many reasons why a person might turn down a job offer, in this particular instance, it is possible women, who are interviewed at disproportionally higher rates, also receive more offers than men and have to turn some of them down.
FACULTY PERSPECTIVE ON HIRING
Turning to the faculty survey, the committee asked faculty who were either tenure-track or tenured and had been hired after 1996 what were their “main considerations in deciding to work for their current institution.” Respondents could check up to 15 choices (the 15th and final choice was Other). For each selection, respondents could check yes or no. These data were coded for analysis as follows: If a respondent selected yes or no for some choices but left others unchecked, the unchecked choices were recoded as no. A chi-square (χ2) test was conducted on each of the 14 substantive selections against gender to investigate whether women and men weighed factors differently when deciding to accept an offer for a position. The responses are presented in Appendix 3-8 and are summarized in Figure 3-2 below. The effect of gender was statistically significant only in the case of family-related reasons. As might have been anticipated, women were more likely to weigh family-related factors more heavily than men when deciding whether to accept an offer, but the difference is not substantial.
INSTITUTIONAL POLICIES FOR INCREASING THE DIVERSITY OF APPLICANT POOLS
Our findings suggest that once women apply to a position at a research-intensive institution, the chances that they will be invited to an interview and be offered a position are disproportionately high for many of the disciplines we surveyed. Yet the proportion of women in faculty positions continues to be low despite increasing numbers of women receiving doctorates in the sciences and engineering. In this light, and given that the percentage of women applying for positions is apparently lower than the percentage of women receiving Ph.D.s in the six target disciplines, it appears that the only strategy to increase female representation in the faculty ranks is to increase the percentage of women in the applicant pool.
The NRC’s To Recruit and Advance: Women Students and Faculty in Science and Engineering (2006) identified institutional characteristics, culture, and policies that may have an impact on the percentage of females who choose to apply to academic positions in science and engineering. Some of these include:
-
Increased institutional efforts in signaling the importance of a gender-diverse faculty. This might be accomplished by increasing the frequency of positive declarative institutional statements, by establishing a committee on women, by exercising close oversight over the hiring process, or by devoting additional resources to hiring women.
-
Modified and expanded faculty recruiting programs. Consider, for example, creating special faculty lines earmarked for female or minority candidates, ensuring search committees are diverse, encouraging inter-

FIGURE 3-2 Main considerations for selecting current position (percent saying “yes, this was a factor”), by gender (see Appendix 3-8).
SOURCE: Faculty Survey carried out by the Committee on Gender Differences in the Careers of Science, Engineering, and Mathematics Faculty.
-
vention by deans when applicant or interview pools lack diversity, and systematically assessing past hiring efforts.
-
Improved institutional policies and practices. These might include inserting some flexibility into the tenure clock, providing child care facilities on campus, establishing policies for faculty leave for family or personal reasons, significantly stepping up efforts to accommodate dual career couples, and continuing to offer training at all levels to combat harassment and discrimination and to raise the awareness of all campus citizens.11
-
Improved position of candidates through career advising, networking, and enhancing qualifications.
While all the strategies above might have an impact on the proportion of women in applicant pools, it appears that only the last two might actually encourage more women to choose academia for their professional activity. The issue is not whether female applicants are treated fairly in the interviewing and hiring process; by several indications, they are. Where progress can still be made is in attracting more women to academia by encouraging more of them to apply for faculty positions at Research I institutions. It seems that refocusing resources to develop strategies to encourage female graduate students to pursue a career in academia has the potential for enormous impact.
Written policies and handbooks for faculty searches frequently note specific steps that can be taken to improve the diversity of applicant pools. These include:
-
Defining searches broadly to encourage a more diverse applicant pool;
-
Posting the job advertisement in a wide range of outlets;
-
Contacting professional associations that represent women (e.g., the Caucus for Women in Statistics, Society of Women Engineers, Association for Women in Science, etc.); and
-
Evaluating the applicant pool during the search to determine if sufficient numbers of women are applying.
Departments reported a variety of actions in response to our survey question, “What steps (if any) has your department or institution taken to increase the gender diversity of your candidate pool?” This was an open-ended question, and the most frequent responses are shown in Table 3-9. Four hundred seventeen departments responded. Departments wrote in with answers ranging from zero to 6 steps and citing anywhere from having zero to 15 policies in place. Targeted or special
TABLE 3-9 Steps Taken to Increase the Gender Diversity of the Candidate Pool
advertising was the most frequently cited action, followed by general advertising. These were followed by recruiting at conferences, contacting women directly, and using personal contacts and assistance from on-campus diversity offices.
In addition, for most departments the total number of steps taken was not large. As shown in Table 3-10, 23 percent reported taking no specific action, and 43 percent reported taking just one. Only slightly more than 10 percent reported taking three or more steps.
SUMMARY OF FINDINGS
The analyses in this chapter reveal a number of important findings about the application, recruitment, interview, and hiring process.
TABLE 3-10 Number of Policy Steps Taken by Departments
Applications
Finding 3-1: Women accounted for about 17 percent of applications for both tenure-track and tenured positions in the departments surveyed. There was wide variation by field and by department in the number and percentage of female applicants for faculty positions. In general, the higher the percentage of women in the Ph.D. pool, the higher the percentage of women applying for each position in that field, although the fields with lower percentages of women in the Ph.D. pool had a higher propensity for those women to apply. The percentage of applicant pools that included at least one woman was substantially higher than would be expected by chance. However, there were no female applicants (only men applied) for 32 (6 percent) of the available tenure-track positions and 16 (16.5 percent) of the tenured positions.
Finding 3-2: There are statistically significant differences in the percentage of women in the tenure-track and the tenured applicant pools across the six disciplines surveyed. Biology, chemistry, and mathematics had significantly higher percentages of female applicants than did all other disciplines. The percentage of female applicants in civil engineering, physics, and electrical engineering was significantly lower. The percentage of females among applicants to tenured positions was similar to the percentage of females among applicants to tenure-track positions.
Finding 3-3: In all six disciplines, the percentage of applications from women for tenure-track positions was lower than the percentage of Ph.D.s awarded to women. There were substantial differences among the disciplines. In civil engineering, electrical engineering, mathematics, and physics, the percentage of women applying for faculty positions was only modestly lower than the percentage of women receiving Ph.D.’s. However, in the fields with the largest representation of women with Ph.D.s—biology and chemistry—the percentage of Ph.D.s awarded to women exceeded the percentage of applications from women by a large amount (Table 3-2).
Finding 3-4: The median number of applications a department received for tenure-track jobs was 52 applications from men and 8 applications from women—or about 7 applications from men for every application from a woman. For tenured positions, the median number of applications a department received was 40 applications from men and 8 from women, for a ratio of 5 to 1. (Figure 3-1)
Finding 3-5: For job openings where only individuals of one gender applied, the gender was more likely to be male. There were no female applicants (only men applied) for 32 tenure-track positions or about 6 percent of available positions. Similar findings were seen for tenured positions. No women applied to 16 tenured jobs—or 16.5 percent of the positions. Most of the cases (29 of 32) when only men applied occurred in physics or the engineering fields.
Finding 3-6: Five factors were associated with the probability that at least one female would apply for a position, including (1) the type of position (p < 0.0001); (2) the number of family-friendly policies in effect at the institution (p = 0.001); (3) a set of discipline indicators (p = 0.03); (4) prestige of the institution (p = 0.04); and (5) type of institution (approaches significance p = 0.08). No other factor was statistically associated with the probability of there being at least one female applicant.
Recruitment
Finding 3-7: Most institutional and departmental strategies for increasing the percentage of women in the applicant pool were not effective as they were not strong predictors of the percentage of women applying. The percentage of women on the search committee and whether a woman chaired the search, however, did have a significant effect on recruiting women. Most steps (such as targeted advertising and recruiting at conferences) were done in isolation, with almost two-thirds of the departments in our sample reporting that they took either no steps or only one step to increase the gender diversity of the applicant pool. (Tables 3-9 and 3-10)
Finding 3-8: The percentage of women on the search committee and whether a woman chaired the committee were both significantly and positively associated with the percentage of women in the applicant pool (p = 0.01 and p = 0.02, respectively).
Interviews
Finding 3-9: Across all the positions—tenure-track or tenured—an average of four men and one woman were interviewed for any particular position. Our survey data allowed us to examine the actual behavior of departments for the 545 tenure-track and 97 tenured openings for which we have gender data for applicants, interviewees, offers, and ultimate hires.
Finding 3-10: The percentage of women who were interviewed for tenure-track or tenured positions was higher than the percentage of women who applied. For each of the six disciplines in this study the mean percentage of females interviewed for tenure-track and tenured positions exceeded the mean percentage of female applicants. For example, the female applicant pool for tenure-track positions in electrical engineering was 11 percent, and the corresponding interview pool was 19 percent. (Table 3-3)
Finding 3-11: Although the percentage of women in interview pools across the six disciplines exceeded the percentage of women in applicant pools, no women were interviewed for 28 percent (155 positions) of the tenure-track and 42 percent (42 positions) of the tenured jobs. These figures are substantially higher than those for the men. However, the percentage of male applicants was much higher than the percentage of female applicants, and part of this number was comprised of cases for which there were no female applicants. In 23 percent of the tenure-track job openings (124 positions), at least 1 woman applied, yet no women were interviewed. In 25 percent of the tenured jobs (23 positions), at least 1 woman applied, but no women were interviewed. No men were interviewed for 3 percent (18 positions) of the tenure-track positions, and in one-half of those cases, there were no preceding male applicants; for 4 percent (4 positions) of tenured jobs, and in one-half of those cases, there were no preceding male applicants.
Finding 3-12: For tenure-track positions, the percentage of actual interview pools in which only men were interviewed (no women) was smaller than would have been expected based on applications and interviews for the positions surveyed for each of the six disciplines. For tenured positions, this was the case for three of the disciplines surveyed. Put another way, the percentage of actual interview pools in these disciplines including women was larger than would have been expected. For tenure-track positions, there were significant differences in electrical engineering (35 percent actual all-male interview pools compared to
56 percent probability of all-male pools) and mathematics (13 percent actual pools compared to 33 percent probable pools).
For tenured positions, there were significant differences, again, in electrical engineering (42 percent actual all-male interview pools compared to 62 percent probability of all-male pools); mathematics (39 percent actual compared to 44 percent probable); and physics (32 percent actual compared to 35 percent probable). This was not the case for the remaining disciplines, including biology (25 percent actual compared to 18 percent probable; civil engineering (46 percent actual compared to 35 percent probable); and chemistry, which had the greatest difference (50 percent actual compared to 24 percent probable). (Table 3-4)
Job Offers
Finding 3-13: For all disciplines the percentage of tenure-track women who received the first job offer was greater than the percentage in the interview pool. Women received the first offer in 29 percent of the tenure-track and 31 percent of the tenured positions surveyed. Tenure-track women in all these disciplines received a percentage of first offers that was greater than than their percentage in the interview pool. For example, women were 21 percent of the interview pool for tenure-track electrical engineering positions and received 32 percent of the first offers. This finding is also true for tenured positions, with the notable exception of biology, where the interview pool was 33 percent female and women received 22 percent of the first offers. (Tables 3-5 and 3-6)
Finding 3-14: In 95 percent of the tenure-track and 100 percent of the tenured positions where a man was the first choice for a position, a man was ultimately hired. In contrast, in cases where a woman was the first choice, a woman was ultimately hired in only 70 percent of the tenure-track and 77 percent of the tenured positions. When faculty were asked what factors they considered when selecting their current position, the effect of gender was statistically significantly for only one factor—“family-related reasons.” (Figure 3-2; Tables 3-7 and 3-8)
As several of these findings suggest, many women fare well in the hiring process at research-intensive institutions. If women apply for positions at research-intensive institutions, they have better-than-expected chances of being interviewed and receiving offers compared to male job candidates. The likelihood of receiving an interview and ultimately an offer was particularly high, relative to application rates, in fields where women were less well represented, such as engineering and physics. These findings suggest that many departments at research-intensive institutions, both public and private, are making an effort to increase the numbers and percentages of female faculty in the sciences, engineering, and mathematics. At the same time, women continue to be underrepresented in the applicant pool relative to their representation among the pool of recent Ph.D.s.