Persistent Forecasting of Disruptive Technologies—Report 2 (2010)

Chapter: Appendix F Visualizations of Workshop Discussions

Previous Chapter: Appendix E Transcript of the Workshop's Breakout Sessions
Suggested Citation: "Appendix F Visualizations of Workshop Discussions." National Research Council. 2010. Persistent Forecasting of Disruptive Technologies—Report 2. Washington, DC: The National Academies Press. doi: 10.17226/12834.

Appendix F
Visualizations of Workshop Discussions

During the Forecasting Future Disruptive Technologies Workshop, Lynn Curruthers, a visual practitioner, assimilated ongoing discussions at two workshop sessions and produced the three graphics presented in Figures F-1 through F-3 and, for ease of viewing, included on the CD provided with this report and in the PDF available at http://www.nap.edu/catalog.php?record_id=12834.

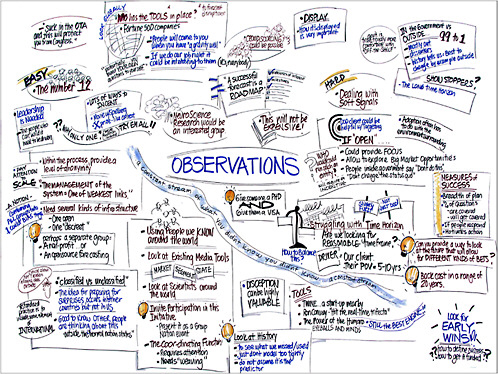
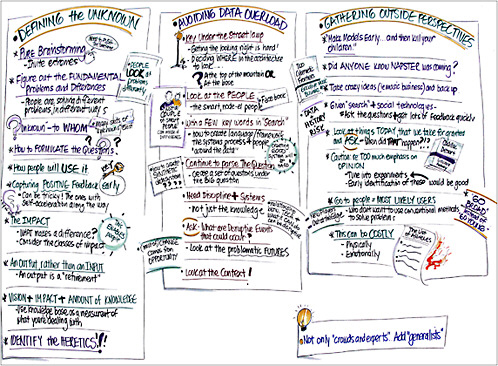
Figures F-1 and F-2 were drawn during the first of the morning sessions, and Figure F-3 was drawn during the summary session. The workshop attendees kept track of the graphics as they were evolving, and offered suggestions and changes to make sure that everything from the session discussions was included.

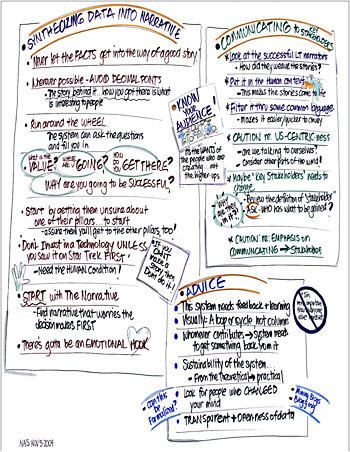
Figure F-2 is meant to be read as a continuation of Figure F-1. Figure F-3 was produced at the end of the day from the workshop attendees’ overall final observations.
Suggested Citation: "Appendix F Visualizations of Workshop Discussions." National Research Council. 2010. Persistent Forecasting of Disruptive Technologies—Report 2. Washington, DC: The National Academies Press. doi: 10.17226/12834.
FIGURE F-1 The first three key areas: Defining the Unknown, Avoiding Data Overload, and Gathering Outside Perspectives.

FIGURE F-1 The first three key areas: Defining the Unknown, Avoiding Data Overload, and Gathering Outside Perspectives.

Suggested Citation: "Appendix F Visualizations of Workshop Discussions." National Research Council. 2010. Persistent Forecasting of Disruptive Technologies—Report 2. Washington, DC: The National Academies Press. doi: 10.17226/12834.
FIGURE F-2 The second three key areas: Synthesizing Data into Narrative, Communicating to Key Stakeholders, and Advice.

FIGURE F-2 The second three key areas: Synthesizing Data into Narrative, Communicating to Key Stakeholders, and Advice.

Suggested Citation: "Appendix F Visualizations of Workshop Discussions." National Research Council. 2010. Persistent Forecasting of Disruptive Technologies—Report 2. Washington, DC: The National Academies Press. doi: 10.17226/12834.
FIGURE F-3 Overall observations of workshop attendees.

FIGURE F-3 Overall observations of workshop attendees.

Suggested Citation: "Appendix F Visualizations of Workshop Discussions." National Research Council. 2010. Persistent Forecasting of Disruptive Technologies—Report 2. Washington, DC: The National Academies Press. doi: 10.17226/12834.
Page 79
Suggested Citation: "Appendix F Visualizations of Workshop Discussions." National Research Council. 2010. Persistent Forecasting of Disruptive Technologies—Report 2. Washington, DC: The National Academies Press. doi: 10.17226/12834.
Page 80
Suggested Citation: "Appendix F Visualizations of Workshop Discussions." National Research Council. 2010. Persistent Forecasting of Disruptive Technologies—Report 2. Washington, DC: The National Academies Press. doi: 10.17226/12834.
Page 81
Suggested Citation: "Appendix F Visualizations of Workshop Discussions." National Research Council. 2010. Persistent Forecasting of Disruptive Technologies—Report 2. Washington, DC: The National Academies Press. doi: 10.17226/12834.
Page 82
Next Chapter: Transcript of the Workshop for Appendix D
Subscribe to Emails from the National Academies
Stay up to date on activities, publications, and events by subscribing to email updates.