Soil and Water Quality: An Agenda for Agriculture (1993)
Chapter: 6 Nitrogen in the Soil-Crop System
6
Nitrogen in the Soil-Crop System
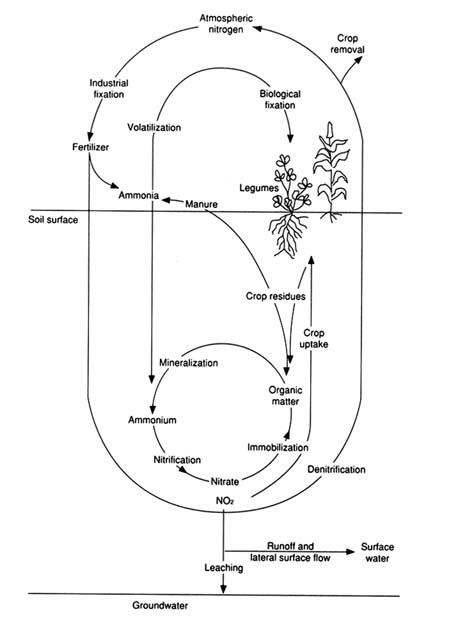
Nitrogen is ubiquitous in the environment. It is one of the most important plant nutrients and forms some of the most mobile compounds in the soil-crop system. Nitrogen is continually cycled among plants, soil organisms, soil organic matter, water, and the atmosphere (Figure 6-1). Nitrogen enters the soil from many different sources and leaves the root zone of the soil in many different ways. This flux of nitrogen into, out of, and within the soil takes place through complex biochemical transformations.
The mounting concerns related to agriculture's role in nitrogen delivery into the environment are reflected in several detailed reviews (Follett and Schimel, 1989; Follet et al., 1991; Hallberg, 1987, 1989b; Keeney, 1986a,b; Power and Schepers, 1989). A brief review of the nitrogen cycle and nitrogen budget or mass balance considerations is necessary to understand the options for management improvements in farming systems to mitigate the environmental impacts of nitrogen.
THE NITROGEN CYCLE
The nitrogen cycle is critical to crop growth. The balance between inputs and outputs and the various transformations in the nitrogen cycle determine how much nitrogen is available for plant growth and how much may be lost to the atmosphere, surface water, or groundwater.
Nitrogen is an important component of soil organic matter, which is made up of decaying plant and animal tissue and the complex organic
compounds that form the soil humus. At any one-time, most of the nitrogen held in the soil is stored in soil organic matter.
Mineralization
Mineralization processes transform the nitrogen in soil organic matter to ammonium ions (NH4), releasing them into the soil. Ammonium is relatively immobile in the soil, being strongly adsorbed to clay minerals and organic matter. Ammonium may be delivered to surface water, attached to sediment or suspended matter, or in solution. It is readily converted into nitrate, through nitrification, at appropriate soil temperatures (above about 9°C [48°F]). Ammonium can create water quality problems for fish and aquatic life under certain temperature and dissolved oxygen conditions.
Nitrification
Nitrification processes transform ammonium ions, which are produced by mineralization or added to the soil, to nitrite (NO2) and to nitrate (NO3), which is easily absorbed by plant roots. Nitrification is typically mediated by soil bacteria and can take place rapidly with adequate soil moisture and temperature under oxidizing conditions in the soil. Except for some atmospheric processing, nitrification in the soil is the sole natural source of nitrate in the environment. Nitrate is soluble and mobile in water and is the form of nitrogen most commonly related to water quality problems. Nitrates that are not absorbed by plants or microorganisms or otherwise immobilized may readily move with percolating water and may leach through the soil to groundwater. Nitrates in the groundwater can move through springs and seeps or shallow flow systems to pollute surface waters, or they can leach into deeper aquifers.
Immobilization
Immobilization includes various processes through which ammonium ions and nitrates are converted to organic nitrogen (referred to as organic-N) and immobilized or bound up in the soil. Ammonium and nitrate ions can be taken up by plants or microorganisms in the soil, transforming the nitrogen into organic matter. Mineralized nitrogen can rapidly recycle through transformations to ammonium and nitrate and then back into the organic-N pool. This occurs primarily through the action of microbes.
Denitrification
Denitrification, another biological transformation, converts nitrate into nitrite and then to gaseous nitrogen (N2) and nitrous oxide (N2O). This is the major pathway that returns nitrogen from the soil environment to the atmosphere. Such losses are of environmental concern because these gases are among those that contribute to the so-called greenhouse effect and may affect the protective layer of ozone in the stratosphere.
Interactive Processes
Mineralization, nitrification, immobilization, and denitrification are interactive processes through which a nitrogen molecule may move many times. The processes are affected by oxidizing and reducing conditions and the availability of oxygen and organic carbon in the soil. These processes go on simultaneously; they can coexist in close proximity and vary temporally in the same setting. In the small pores within aggregates in the soil profile, oxygen may be depleted and reducing conditions may become dominant, resulting in denitrification. Yet, on the exteriors of aggregates, around macropores, oxygen may be available and nitrification occurs. Seasonally, in a setting where the soil is normally dominated by air-filled pores and oxidizing conditions, the soil may become saturated with water during recharge events, and reducing conditions and denitrification may dominate temporarily. It is the balance between these processes and their seasonal timing that determines how much nitrogen is available for crops and how much nitrogen may be lost from the soil to groundwater and surface water or the atmosphere.
NITROGEN MASS BALANCE
A molecule of nitrogen may enter the soil system as organic-N from crop residues or other plant or microbial biomass, from animal manures or organic wastes (for example, sewage sludge or food processing residues), and through the action of leguminous plants such as alfalfa that take nitrogen from the atmosphere and incorporate it into the plant's tissue (nitrogen fixation). The nitrogen in commercial fertilizer is directly added to soil systems in many forms, but the dominant forms are ammonium, nitrate, and urea. Some nitrogen, primarily as nitrate and ammonium, is also added with precipitation.
Nitrogen is taken up by crops and can be removed from the soil
TABLE 6-1 Nitrogen (N) Inputs, Outputs, and Balances in the United States under the Low, Medium, and High Scenarios
| Metric Tons of N (Percent of Total Inputs)a | ||
Input or Output | Low Scenario | Medium Scenario | High Scenario |
Input | |||
Fertilizer-N | 9,390,000 (47) | 9,390,000 (45) | 9,390,000 (42) |
Manure-N | 1,730,000 (9) | 1,730,000 (8) | 1,730,000 (8) |
Legume-N | 6,120,000 (30) | 6,870,000 (33) | 8,560,000 (38) |
Crop residues | 2,890,000 (14) | 2,890,000 (14) | 2,890,000 (13) |
Total input | 20,100,000 (100) | 20,900,000 (100) | 22,600,000 (100) |
Output | |||
Harvested crops | 10,600,000 (53) | 10,600,000 (51) | 10,600,000 (47) |
Crop residues | 2,890,000 (14) | 2,890,000 (14) | 2,890,000 (13) |
Total output | 13,500,000 (67) | 13,500,000 (64) | 13,500,000 (60) |
Balance | 6,670,000 (33) | 7,420,000 (36) | 9,110,000 (40) |
NOTE: See the Appendix for a full discussion of the methods used to estimate nitrogen inputs and outputs. a Input, output, or balance as a percent of the total mass of inputs. | |||
system with the harvested portion of the crop (for example, grain) or can be left in the soil system as root mass or crop residues. Nitrogen can be lost to the atmosphere through denitrification or the volatilization of ammonia from the fertilizers and manures applied to the soil surface. It can also move through or over the soil with water to pollute surface water or groundwater.
Even under native prairies and forests, some nitrogen loss occurs through leaching, denitrification, erosion, and biomass. Biomass nitrogen can be lost because of a limited harvest, lost from senescing vegetation, or carried away by wind or smoke when the biomass is burned. Nutrient gains and losses in natural ecosystems are roughly in balance, however; and nitrogen losses from natural ecosystems into water are significantly lower than losses from agricultural ecosystems. Numerous studies on various scales have shown from 3-to 60-fold greater nitrate concentrations in surface water and groundwater in agricultural areas compared with those in forested or grassland areas (Hallberg, 1987, 1989b; Keeney, 1986a,b; McArthur et al., 1985; Omernik, 1976). Continued growth of plants in natural ecosystems depends on the cycling of nutrients between biomass and organic and inorganic stores (Miller and Larson, 1990).
Table 6-1 estimates the major, manageable, national nitrogen inputs and outputs for harvested croplands in 1987. Inputs of nitrogen include nitrogen applied to croplands as synthetic fertilizers, nitrogen in crop
residues voided in manures, and nitrogen supplied by legumes (alfalfa and soybeans). Outputs include nitrogen in harvested crops and crop residues. (See the Appendix for a full discussion of the methods used to estimate nitrogen inputs and outputs.) Only the manure that is collectible and that can be applied to croplands was considered. Some of the nitrogen in collectible manures is lost through volatilization, runoff, leaching, or other processes before it can be applied to croplands. The amount of nitrogen lost depends on the methods used to collect, store, and apply manures. In Table 6-1, only that portion of total nitrogen voided in manures that was estimated to be economically collectible and recoverable for use on croplands was used as the nitrogen inputs from manure.
Estimates of the rate of nitrogen fixation by alfalfa and soybeans vary widely. Estimates of rates of fixation by alfalfa range from 70 to 600 kg/ha/yr (62 to 532 lb/acre/yr) and from 15 to 310 kg/ha/yr (13 to 275 lb/acre/yr) for soybeans (Appendix Table A-4). Such large ranges in reported values are related, in part, to differences in soil nitrogen availability, climate, and crop variety. In addition, the amount of nitrogen fixed by alfalfa depends on the density and age of the stand. Estimates are further complicated because the fixed nitrogen is not immediately available for use by crop plants and some of the reduced need for nitrogen by crops following legumes is related to rotation effects other than the nitrogen supplied by fixation. Because of these difficulties, nitrogen replacement values are usually used to estimate the effect of legumes on the need for supplemental nitrogen by succeeding crops. The nitrogen replacement values include both the rotation effects and the influence of fixed nitrogen when determining the need for supplemental nitrogen.
Because of the wide range of estimates of nitrogen fixation by legumes (alfalfa and soybeans), the committee used three fixation-nitrogen replacement value estimates (low, medium, and high scenarios) to calculate nitrogen inputs. The nitrogen fixation rates and replacement values under the three scenarios are given in Table 6-2. The nitrogen replacement value, as used here, is the difference between the nitrogen input (fixed and accumulated nitrogen) and the nitrogen removed with the harvested legume crop (see Appendix Table A-5.)
Estimates of nitrogen outputs in harvested crops and crop residues are also reported in Table 6-1. The difference between nitrogen inputs and outputs is reported as nitrogen balances. A more detailed analysis of nitrogen inputs and outputs from agricultural lands helps to identify opportunities for reducing nitrogen losses from farming systems.
TABLE 6-2 Nitrogen Accumulation and Nitrogen Replacement Value Estimated for Alfalfa and Soybeans
|
| Nitrogen Accumulation (kg/ha) | |
Legume | Scenario | Total Nitrogen Input | Nitrogen Replacement Valuea |
Alfalfa | Low | 230 | 45 |
Medium | 250 | 65 | |
High | 380 | 195 | |
Soybeans | Low | 175 | 10 |
Medium | 200 | 35 | |
High | 220 | 55 | |
NOTE: See the Appendix for a full discussion of the methods used to estimate nitrogen accumulation and replacement values. a The nitrogen replacement value includes the amount of fixed nitrogen available to a succeeding crop and the reduced need for supplemental nitrogen that may be a result of rotation effects. | |||
Nitrogen Inputs
The nitrogen delivered in rainfall; obtained from fertilizers; mineralized from soil organic-N, crop residues, manure, or legumes; or even delivered in irrigation water contributes to the nitrogen budget of a particular agricultural field. All of these nitrogen sources are subject to the transformations of the nitrogen cycle and all can contribute to environmental nitrogen losses. The importance of any particular source depends on the type of agricultural enterprise, its geographic location and climate, and the soil's microclimate. This variation is evident in Tables 6-3 and 6-4, which report state- and national-level nitrogen mass balances.
Nitrogen in Fertilizers
The nitrogen in fertilizers is the single largest source of nitrogen applied to most croplands. In 1987, 9.39 million metric tons (10.4 million tons) of nitrogen was applied nationwide in the form of synthetic fertilizers. For the low, medium, and high scenarios, the amount of synthetic fertilizer applied represents 47, 45, and 42 percent of nitrogen inputs, respectively. The importance of synthetic fertilizers as a nitrogen source (fertilizer-N) varies widely around the United States, depending on the crop and the region where that crop is grown. Three of the four major commodity crops—corn, wheat, and cotton—use 61 percent of U.S. fertilizer-N. Corn, which covers about 21 percent of U.S. cropland,
TABLE 6-3 State and National Nitrogen Inputs and Outputs (metric tons)
| Inputs | Outputs | |||||||
State | Fertilizer-N | Recoverable Manure-N | Legume-N Fixation | Crop Residues | Total | Harvested Crop | Crop Residues | Total | Balance |
Low Scenario | |||||||||
Alabama | 111,000 | 25,300 | 44,300 | 9,420 | 190,000 | 60,800 | 9,420 | 70,200 | 120,000 |
Alaska | 1,850 | 0 | 0 | 61 | 1,910 | 620 | 61 | 681 | 1,230 |
Arizona | 73,500 | 22,200 | 12,800 | 3,980 | 112,000 | 35,500 | 3,980 | 39,500 | 73,000 |
Arkansas | 188,000 | 40,300 | 229,000 | 54,600 | 512,000 | 220,000 | 54,600 | 275,000 | 237,000 |
California | 482,000 | 106,000 | 88,400 | 32,800 | 709,000 | 246,000 | 32,800 | 279,000 | 431,000 |
Colorado | 126,000 | 61,300 | 66,600 | 48,000 | 302,000 | 175,000 | 48,000 | 223,000 | 78,500 |
Connecticut | 6,450 | 4,880 | 1,900 | 81 | 13,300 | 3,800 | 81 | 3,880 | 9,430 |
Delaware | 15,200 | 5,850 | 16,300 | 4,380 | 41,700 | 14,000 | 4,370 | 18,400 | 23,400 |
Florida | 258,000 | 15,700 | 7,900 | 3,090 | 285,000 | 25,100 | 3,090 | 28,200 | 257,000 |
Georgia | 175,000 | 31,400 | 56,500 | 20,000 | 283,000 | 105,000 | 20,000 | 125,000 | 158,000 |
Hawaii | 14,900 | 1,030 | 10 | 0 | 15,900 | 110 | 0 | 110 | 15,800 |
Idaho | 187,000 | 26,600 | 85,800 | 37,900 | 337,000 | 186,000 | 37,900 | 224,000 | 113,000 |
Illinois | 805,000 | 37,200 | 676,000 | 380,000 | 1,900,000 | 1,120,000 | 380,000 | 1,500,000 | 402,000 |
Indiana | 462,000 | 32,900 | 349,000 | 200,000 | 1,040,000 | 595,000 | 200,000 | 795,000 | 249,000 |
Iowa | 780,000 | 87,400 | 688,000 | 394,000 | 1,950,000 | 1,200,000 | 394,000 | 1,590,000 | 356,000 |
Kansas | 438,000 | 114,000 | 202,000 | 163,000 | 917,000 | 547,000 | 163,000 | 710,000 | 207,000 |
Kentucky | 165,000 | 24,500 | 103,000 | 35,300 | 327,000 | 163,000 | 35,300 | 199,000 | 129,000 |
Louisiana | 138,000 | 5,670 | 111,000 | 26,100 | 280,000 | 109,000 | 26,100 | 135,000 | 145,000 |
Maine | 11,600 | 7,780 | 2,200 | 1,230 | 22,800 | 11,700 | 1,230 | 12,900 | 9,880 |
Maryland | 38,800 | 21,100 | 36,500 | 12,600 | 109,000 | 47,100 | 12,600 | 59,700 | 49,300 |
Massachusetts | 9,860 | 4,390 | 3,000 | 161 | 17,400 | 5,300 | 161 | 5,460 | 12,000 |
Michigan | 220,000 | 37,900 | 163,000 | 64,000 | 485,000 | 238,000 | 64,000 | 302,000 | 183,000 |
Minnesota | 525,000 | 79,400 | 450,000 | 220,000 | 1,270,000 | 737,000 | 220,000 | 957,000 | 317,000 |
Mississippi | 142,000 | 13,400 | 145,000 | 23,800 | 324,000 | 115,000 | 23,800 | 138,000 | 186,000 |
Missouri | 322,000 | 42,400 | 386,000 | 113,000 | 863,000 | 487,000 | 113,000 | 600,000 | 263,000 |
| Inputs | Outputs | |||||||
State | Fertilizer-N | Recoverable Manure-N | Legume-N Fixation | Crop Residues | Total | Harvested Crop | Crop Residues | Total | Balance |
Montana | 91,100 | 12,000 | 114,000 | 52,400 | 270,000 | 212,000 | 52,400 | 264,000 | 5,200 |
Nebraska | 608,000 | 93,000 | 273,000 | 236,000 | 1,210,000 | 662,000 | 236,000 | 898,000 | 312,000 |
Nevada | 4,880 | 2,220 | 22,500 | 521 | 30,100 | 29,900 | 521 | 30,400 | (300) |
New Hampshire | 2,040 | 1,980 | 1,700 | 24 | 5,740 | 3,210 | 24 | 3,230 | 2,510 |
New Jersey | 20,800 | 3,170 | 11,700 | 3,040 | 38,700 | 14,900 | 3,040 | 17,900 | 20,800 |
New Mexico | 24,000 | 14,500 | 18,300 | 5,410 | 62,200 | 36,800 | 5,410 | 42,200 | 20,000 |
New York | 93,900 | 78,200 | 84,300 | 18,700 | 275,000 | 138,000 | 18,700 | 156,000 | 119,000 |
North Carolina | 176,000 | 33,000 | 94,000 | 30,900 | 334,000 | 122,000 | 30,900 | 153,000 | 181,000 |
North Dakota | 302,000 | 13,700 | 162,000 | 108,000 | 586,000 | 357,000 | 108,000 | 465,000 | 121,000 |
Ohio | 356,000 | 40,100 | 327,000 | 134,000 | 856,000 | 468,000 | 134,000 | 602,000 | 253,000 |
Oklahoma | 246,000 | 30,500 | 44,300 | 34,100 | 355,000 | 162,000 | 34,100 | 196,000 | 159,000 |
Oregon | 114,000 | 13,500 | 34,100 | 16,600 | 178,000 | 93,900 | 16,700 | 111,000 | 67,600 |
Pennsylvania | 47,500 | 79,200 | 90,900 | 29,700 | 247,000 | 156,000 | 29,700 | 186,000 | 61,200 |
Rhode Island | 1,490 | 0 | 200 | 8 | 1,700 | 330 | 8 | 338 | 1,360 |
South Carolina | 65,100 | 5,680 | 43,200 | 11,300 | 125,000 | 45,600 | 11,300 | 56,900 | 68,400 |
South Dakota | 164,000 | 35,300 | 278,000 | 94,900 | 572,000 | 360,000 | 94,900 | 455,000 | 117,000 |
Tennessee | 140,000 | 20,600 | 96,600 | 23,500 | 281,000 | 118,000 | 23,600 | 141,000 | 140,000 |
Texas | 674,000 | 153,000 | 29,700 | 94,800 | 951,000 | 340,000 | 95,800 | 436,000 | 515,000 |
Utah | 27,000 | 11,300 | 44,900 | 4,480 | 87,700 | 57,100 | 4,480 | 61,500 | 26,100 |
Vermont | 4,480 | 17,800 | 9,500 | 256 | 32,000 | 17,400 | 256 | 17,700 | 14,400 |
Virginia | 71,300 | 25,400 | 47,800 | 11,000 | 156,000 | 73,500 | 11,000 | 84,500 | 71,000 |
Washington | 185,000 | 25,300 | 40,600 | 39,200 | 290,000 | 158,000 | 39,200 | 197,000 | 93,200 |
West Virginia | 11,900 | 5,610 | 7,800 | 948 | 26,300 | 14,800 | 948 | 15,700 | 10,500 |
Wisconsin | 243,000 | 161,000 | 271,000 | 84,000 | 759,000 | 441,000 | 84,000 | 524,000 | 235,000 |
Wyoming | 20,900 | 9,570 | 50,500 | 5,180 | 86,200 | 53,700 | 5,180 | 58,900 | 27,300 |
United States | 9,390,000 | 1,730,000 | 6,120,000 | 2,890,000 | 20,100,000 | 10,600,000 | 2,890,000 | 13,500,000 | 6,670,000 |
Medium Scenario | |||||||||
Alabama | 111,000 | 25,300 | 50,500 | 9,420 | 196,000 | 60,800 | 9,420 | 70,200 | 126,000 |
Alaska | 1,850 | 0 | 0 | 61 | 1,910 | 620 | 61 | 681 | 1,230 |
Arizona | 73,500 | 22,200 | 13,900 | 3,980 | 114,000 | 35,500 | 3,980 | 39,500 | 74,100 |
Arkansas | 188,000 | 40,300 | 261,000 | 54,600 | 544,000 | 220,000 | 54,600 | 275,000 | 269,000 |
| Inputs | Outputs | |||||||
State | Fertilizer-N | Recoverable Manure-N | Legume-N Fixation | Crop Residues | Total | Harvested Crop | Crop Residues | Total | Balance |
California | 482,000 | 106,000 | 96,100 | 32,800 | 717,000 | 246,000 | 32,800 | 278,000 | 438,000 |
Colorado | 126,000 | 61,300 | 72,400 | 48,000 | 308,000 | 175,000 | 48,000 | 223,000 | 84,300 |
Connecticut | 6,450 | 4,880 | 2,100 | 81 | 13,500 | 3,800 | 81 | 3,880 | 9,630 |
Delaware | 15,200 | 5,850 | 18,600 | 4,380 | 44,000 | 14,000 | 4,370 | 18,400 | 25,700 |
Florida | 258,000 | 15,700 | 8,900 | 3,090 | 286,000 | 25,100 | 3,090 | 28,200 | 258,000 |
Georgia | 175,000 | 31,400 | 64,400 | 20,000 | 291,000 | 105,000 | 20,000 | 125,000 | 166,000 |
Hawaii | 14,900 | 1,030 | 15 | 0 | 15,900 | 110 | 0 | 110 | 15,800 |
Idaho | 187,000 | 26,600 | 93,200 | 37,900 | 345,000 | 186,000 | 37,900 | 224,000 | 121,000 |
Illinois | 805,000 | 37,200 | 770,000 | 380,000 | 1,990,000 | 1,120,000 | 380,000 | 1,500,000 | 496,000 |
Indiana | 462,000 | 32,900 | 397,000 | 200,000 | 1,090,000 | 595,000 | 200,000 | 795,000 | 297,000 |
Iowa | 780,000 | 87,400 | 780,000 | 394,000 | 2,040,000 | 1,200,000 | 394,000 | 1,590,000 | 450,000 |
Kansas | 438,000 | 114,000 | 227,000 | 163,000 | 942,000 | 547,000 | 163,000 | 710,000 | 232,000 |
Kentucky | 165,000 | 24,500 | 116,000 | 35,300 | 340,000 | 163,000 | 35,300 | 199,000 | 142,000 |
Louisiana | 138,000 | 5,670 | 126,000 | 26,100 | 296,000 | 109,000 | 26,100 | 135,000 | 160,000 |
Maine | 11,600 | 7,780 | 2,400 | 1,230 | 23,000 | 11,700 | 1,230 | 12,900 | 10,100 |
Maryland | 38,800 | 21,100 | 41,300 | 12,600 | 114,000 | 47,100 | 12,600 | 59,700 | 54,100 |
Massachusetts | 9,860 | 4,390 | 3,300 | 161 | 17,700 | 5,300 | 161 | 5,460 | 12,300 |
Michigan | 220,000 | 37,900 | 181,000 | 64,000 | 503,000 | 238,000 | 64,000 | 302,000 | 201,000 |
Minnesota | 525,000 | 79,400 | 507,000 | 220,000 | 1,330,000 | 737,000 | 220,000 | 957,000 | 373,000 |
Mississippi | 142,000 | 13,400 | 165,000 | 23,800 | 344,000 | 115,000 | 23,800 | 138,000 | 206,000 |
Missouri | 322,000 | 42,400 | 439,000 | 113,000 | 916,000 | 487,000 | 113,000 | 600,000 | 315,000 |
Montana | 91,100 | 12,000 | 124,000 | 52,400 | 280,000 | 212,000 | 52,400 | 264,000 | 15,200 |
Nebraska | 608,000 | 93,000 | 306,000 | 236,000 | 1,240,000 | 662,000 | 236,000 | 898,000 | 345,000 |
Nevada | 4,880 | 2,220 | 24,400 | 521 | 32,000 | 29,900 | 521 | 30,400 | 1,600 |
New Hampshire | 2,040 | 1,980 | 1,800 | 24 | 5,840 | 3,210 | 24 | 3,230 | 2,610 |
New Jersey | 20,800 | 3,170 | 13,200 | 3,040 | 40,200 | 14,900 | 3,040 | 17,900 | 22,300 |
| Inputs | Outputs | |||||||
State | Fertilizer-N | Recoverable Manure-N | Legume-N Fixation | Crop Residues | Total | Harvested Crop | Crop Residues | Total | Balance |
New Mexico | 24,000 | 14,500 | 19,900 | 5,410 | 63,800 | 36,800 | 5,410 | 42,200 | 21,600 |
New York | 93,900 | 78,200 | 91,700 | 18,700 | 283,000 | 138,000 | 18,700 | 156,000 | 126,000 |
North Carolina | 176,000 | 33,000 | 107,000 | 30,900 | 347,000 | 122,000 | 30,900 | 153,000 | 194,000 |
North Dakota | 302,000 | 13,700 | 178,000 | 108,000 | 602,000 | 357,000 | 108,000 | 465,000 | 137,000 |
Ohio | 356,000 | 40,100 | 369,000 | 134,000 | 899,000 | 468,000 | 134,000 | 602,000 | 296,000 |
Oklahoma | 246,000 | 30,500 | 49,000 | 34,100 | 360,000 | 162,000 | 34,100 | 196,000 | 164,000 |
Oregon | 114,000 | 13,500 | 37,500 | 16,600 | 181,000 | 93,900 | 16,700 | 111,000 | 70,500 |
Pennsylvania | 47,500 | 79,200 | 99,500 | 29,700 | 256,000 | 156,000 | 29,700 | 186,000 | 69,800 |
Rhode Island | 1,490 | 0 | 230 | 8 | 1,730 | 330 | 8 | 338 | 1,390 |
South Carolina | 65,100 | 5,680 | 49,400 | 11,300 | 131,000 | 45,600 | 11,300 | 56,900 | 74,600 |
South Dakota | 164,000 | 35,300 | 307,000 | 94,900 | 601,000 | 360,000 | 94,900 | 455,000 | 146,000 |
Tennessee | 140,000 | 20,600 | 110,000 | 23,500 | 294,000 | 118,000 | 23,600 | 141,000 | 153,000 |
Texas | 674,000 | 153,000 | 33,000 | 94,800 | 955,000 | 341,000 | 95,800 | 436,000 | 518,000 |
Utah | 27,000 | 11,300 | 48,800 | 4,480 | 91,600 | 57,100 | 4,480 | 61,600 | 30,000 |
Vermont | 4,480 | 17,800 | 10,300 | 256 | 32,800 | 17,400 | 256 | 17,700 | 15,200 |
Virginia | 71,300 | 25,400 | 53,800 | 11,000 | 162,000 | 73,500 | 11,000 | 84,500 | 77,000 |
Washington | 185,000 | 25,300 | 44,200 | 39,200 | 294,000 | 158,000 | 39,200 | 197,000 | 96,800 |
West Virginia | 11,900 | 5,610 | 8,600 | 948 | 27,100 | 14,800 | 948 | 15,700 | 11,300 |
Wisconsin | 243,000 | 161,000 | 296,000 | 84,000 | 784,000 | 441,000 | 84,000 | 525,000 | 259,000 |
Wyoming | 20,900 | 9,570 | 54,800 | 5,180 | 90,500 | 53,700 | 5,180 | 58,900 | 31,600 |
United States | 9,390,000 | 1,730,000 | 6,870,000 | 2,890,000 | 20,900,000 | 10,600,000 | 2,890,000 | 13,500,000 | 7,420,000 |
High Scenario | |||||||||
Alabama | 111,000 | 25,300 | 57,000 | 9,420 | 203,000 | 60,800 | 9,420 | 70,200 | 133,000 |
Alaska | 1,850 | 0 | 0 | 61 | 1,910 | 620 | 61 | 681 | 1,230 |
Arizona | 73,500 | 22,200 | 21,000 | 3,980 | 121,000 | 35,500 | 3,980 | 39,500 | 81,200 |
Arkansas | 188,000 | 40,300 | 289,000 | 54,600 | 572,000 | 220,000 | 54,600 | 275,000 | 297,000 |
California | 482,000 | 106,000 | 146,000 | 32,800 | 767,000 | 246,000 | 32,800 | 279,000 | 488,000 |
Colorado | 126,000 | 61,300 | 110,000 | 48,000 | 345,000 | 175,000 | 48,000 | 223,000 | 122,000 |
Connecticut | 6,450 | 4,880 | 3,200 | 81 | 14,600 | 3,800 | 81 | 3,880 | 10,700 |
Delaware | 15,200 | 5,850 | 20,800 | 4,380 | 46,200 | 14,000 | 4,370 | 18,400 | 27,900 |
| Inputs | Outputs | |||||||
State | Fertilizer-N | Recoverable Manure-N | Legume-N Fixation | Crop Residues | Total | Harvested Crop | Crop Residues | Total | Balance |
Florida | 258,000 | 15,700 | 10,500 | 3,090 | 287,000 | 25,100 | 3,090 | 28,200 | 259,000 |
Georgia | 175,000 | 31,400 | 72,000 | 20,000 | 298,000 | 105,000 | 20,000 | 125,000 | 174,000 |
Hawaii | 14,900 | 1,030 | 20 | 0 | 16,000 | 110 | 0 | 110 | 15,800 |
Idaho | 187,000 | 26,600 | 142,000 | 37,900 | 393,000 | 186,000 | 37,900 | 224,000 | 169,000 |
Illinois | 805,000 | 37,200 | 871,000 | 380,000 | 2,090,000 | 1,120,000 | 380,000 | 1,500,000 | 597,000 |
Indiana | 462,000 | 32,900 | 453,000 | 200,000 | 1,150,000 | 595,000 | 200,000 | 795,000 | 354,000 |
Iowa | 780,000 | 87,400 | 917,000 | 394,000 | 2,180,000 | 1,200,000 | 394,000 | 1,590,000 | 586,000 |
Kansas | 438,000 | 114,000 | 282,000 | 163,000 | 997,000 | 547,000 | 163,000 | 710,000 | 286,000 |
Kentucky | 165,000 | 24,500 | 141,000 | 35,300 | 366,000 | 163,000 | 35,300 | 199,000 | 167,000 |
Louisiana | 138,000 | 5,670 | 139,000 | 26,100 | 309,000 | 109,000 | 26,100 | 135,000 | 173,000 |
Maine | 11,600 | 7,780 | 3,700 | 1,230 | 24,300 | 11,700 | 1,230 | 12,900 | 11,400 |
Maryland | 38,800 | 21,100 | 48,900 | 12,600 | 121,000 | 47,100 | 12,600 | 59,700 | 61,700 |
Massachusetts | 9,860 | 4,390 | 5,000 | 161 | 19,400 | 5,300 | 161 | 5,460 | 14,000 |
Michigan | 220,000 | 37,900 | 241,000 | 64,000 | 563,000 | 238,000 | 64,000 | 302,000 | 261,000 |
Minnesota | 525,000 | 79,400 | 621,000 | 220,000 | 1,450,000 | 737,000 | 220,000 | 957,000 | 488,000 |
Mississippi | 142,000 | 13,400 | 183,000 | 23,800 | 362,000 | 115,000 | 23,800 | 138,000 | 224,000 |
Missouri | 322,000 | 42,400 | 502,000 | 113,000 | 980,000 | 487,000 | 113,000 | 600,000 | 379,000 |
Montana | 91,100 | 12,000 | 188,000 | 52,400 | 344,000 | 212,000 | 52,400 | 264,000 | 79,600 |
Nebraska | 608,000 | 93,000 | 387,000 | 236,000 | 1,320,000 | 662,000 | 236,000 | 898,000 | 426,000 |
Nevada | 4,890 | 2,220 | 37,100 | 521 | 44,700 | 29,900 | 521 | 30,400 | 14,300 |
State | Fertilizer-N | Recoverable Manure-N | Legume-N Fixation | Crop Residues | Total | Harvested Crop | Crop Residues | Total | Balance |
New Hampshire | 2,040 | 1,980 | 2,760 | 24 | 6,800 | 3,210 | 24 | 3,230 | 3,570 |
New Jersey | 20,800 | 3,170 | 16,400 | 3,040 | 43,400 | 14,900 | 3,040 | 17,900 | 25,500 |
New Mexico | 24,000 | 14,500 | 30,300 | 5,410 | 74,200 | 36,800 | 5,410 | 42,200 | 32,000 |
New York | 93,900 | 78,200 | 139,000 | 18,700 | 329,000 | 138,000 | 18,700 | 156,000 | 173,000 |
North Carolina | 176,000 | 33,000 | 120,000 | 30,900 | 360,000 | 122,000 | 30,900 | 153,000 | 207,000 |
North Dakota | 302,000 | 13,700 | 254,000 | 108,000 | 678,000 | 357,000 | 108,000 | 465,000 | 212,000 |
Ohio | 356,000 | 40,100 | 434,000 | 134,000 | 964,000 | 468,000 | 134,000 | 602,000 | 362,000 |
Oklahoma | 246,000 | 30,500 | 66,700 | 34,100 | 377,000 | 162,000 | 34,100 | 196,000 | 182,000 |
Oregon | 114,000 | 13,500 | 56,300 | 16,600 | 200,000 | 93,900 | 16,700 | 111,000 | 89,800 |
Pennsylvania | 47,500 | 79,200 | 145,000 | 29,700 | 302,000 | 156,000 | 29,700 | 186,000 | 115,000 |
Rhode Island | 1,490 | 0 | 350 | 8 | 1,850 | 330 | 8 | 338 | 1,510 |
South Carolina | 65,100 | 5,680 | 54,700 | 11,300 | 137,000 | 45,600 | 11,300 | 56,900 | 79,9000 |
South Dakota | 164,000 | 35,300 | 423,000 | 94,900 | 717,000 | 360,000 | 94,900 | 455,000 | 262,000 |
Tennessee | 140,000 | 20,600 | 126,000 | 23,500 | 311,000 | 118,000 | 23,600 | 141,000 | 169,000 |
Texas | 674,000 | 153,000 | 44,200 | 94,800 | 966,000 | 341,000 | 95,800 | 437,000 | 529,000 |
Utah | 27,000 | 11,300 | 74,200 | 4,480 | 117,000 | 57,100 | 4,480 | 61,600 | 554,000 |
Vermont | 4,480 | 17,800 | 15,600 | 256 | 38,100 | 17,400 | 256 | 17,700 | 20,500 |
Virginia | 71,300 | 25,400 | 66,100 | 11,000 | 174,000 | 73,500 | 11,000 | 84,500 | 89,300 |
Washington | 185,000 | 25,300 | 67,100 | 39,200 | 317,000 | 158,000 | 39,200 | 197,000 | 120,000 |
West Virginia | 11,900 | 5,610 | 12,800 | 948 | 31,300 | 14,800 | 948 | 15,800 | 15,500 |
Wisconsin | 243,000 | 161,000 | 440,000 | 84,000 | 928,000 | 441,000 | 84,000 | 525,000 | 403,000 |
Wyoming | 20,900 | 9,570 | 83,400 | 5,180 | 119,000 | 53,700 | 5,180 | 58,900 | 60,200 |
United States | 9,390,000 | 1,730,000 | 8,560,000 | 2,890,000 | 22,600,000 | 10,600,000 | 2,890,000 | 13,500,000 | 9,110,000 |
NOTE: See the Appendix for a full discussion of the methods used to estimate nitrogen inputs and outputs. | |||||||||
TABLE 6-4 State and National Nitrogen Contributions to Total Inputs and Outputs
| Percentage of Total Input Mass | ||||||
| Inputs | Outputs | |||||
State | Fertilizer-N | Recoverable Manure-N | Legume-N Fixation | Crop Residues | Harvested Crop | Crop Residues | Balance |
Low Scenario | |||||||
Alabama | 58 | 13 | 23 | 5 | 32 | 5 | 63 |
Alaska | 97 | 0 | 0 | 3 | 32 | 3 | 64 |
Arizona | 65 | 20 | 11 | 4 | 32 | 4 | 65 |
Arkansas | 37 | 8 | 45 | 11 | 43 | 11 | 46 |
California | 68 | 15 | 12 | 5 | 35 | 5 | 61 |
Colorado | 42 | 20 | 22 | 16 | 58 | 16 | 26 |
Connecticut | 48 | 37 | 14 | 1 | 29 | 1 | 71 |
Delaware | 36 | 14 | 39 | 10 | 34 | 10 | 56 |
Florida | 91 | 6 | 3 | 1 | 9 | 1 | 90 |
Georgia | 62 | 11 | 20 | 7 | 37 | 7 | 56 |
Hawaii | 93 | 6 | 0 | 0 | 1 | 0 | 99 |
Idaho | 55 | 8 | 25 | 11 | 55 | 11 | 34 |
Illinois | 42 | 2 | 36 | 20 | 59 | 20 | 21 |
Indiana | 44 | 3 | 33 | 19 | 57 | 19 | 24 |
Iowa | 40 | 4 | 35 | 20 | 61 | 20 | 18 |
Kansas | 48 | 12 | 22 | 18 | 60 | 18 | 23 |
Kentucky | 50 | 7 | 31 | 11 | 50 | 11 | 39 |
Louisiana | 49 | 2 | 39 | 9 | 39 | 9 | 52 |
Maine | 51 | 34 | 10 | 5 | 51 | 5 | 43 |
Maryland | 36 | 19 | 33 | 12 | 43 | 12 | 69 |
Massachusetts | 57 | 25 | 17 | 1 | 30 | 1 | 69 |
Michigan | 45 | 8 | 34 | 13 | 49 | 13 | 38 |
Minnesota | 41 | 6 | 35 | 17 | 58 | 17 | 25 |
| Percentage of Total Input Mass | ||||||
| Inputs | Outputs | |||||
State | Fertilizer-N | Recoverable Manure-N | Legume-N Fixation | Crop Residues | Harvested Crop | Crop Residues | Balance |
Mississippi | 44 | 4 | 45 | 7 | 35 | 7 | 57 |
Missouri | 37 | 5 | 45 | 13 | 56 | 13 | 30 |
Montana | 34 | 4 | 42 | 19 | 79 | 19 | 2 |
Nebraska | 50 | 8 | 23 | 20 | 55 | 20 | 26 |
Nevada | 16 | 7 | 75 | 2 | 99 | 2 | (1) |
New Hampshire | 36 | 34 | 30 | 0 | 56 | 0 | 44 |
New Jersey | 54 | 8 | 30 | 8 | 38 | 8 | 54 |
New Mexico | 39 | 23 | 29 | 9 | 59 | 9 | 32 |
New York | 34 | 28 | 31 | 7 | 50 | 7 | 43 |
North Carolina | 53 | 10 | 28 | 9 | 36 | 9 | 54 |
North Dakota | 52 | 2 | 28 | 18 | 61 | 18 | 21 |
Ohio | 42 | 5 | 38 | 16 | 55 | 16 | 30 |
Oklahoma | 69 | 9 | 12 | 10 | 46 | 10 | 45 |
Oregon | 64 | 8 | 19 | 9 | 53 | 9 | 38 |
Pennsylvania | 19 | 32 | 37 | 12 | 63 | 12 | 25 |
Rhode Island | 88 | 0 | 12 | 0 | 19 | 0 | 80 |
South Carolina | 52 | 5 | 34 | 9 | 36 | 9 | 55 |
South Dakota | 29 | 6 | 49 | 17 | 63 | 17 | 20 |
Tennessee | 50 | 7 | 34 | 8 | 42 | 8 | 50 |
Texas | 71 | 16 | 3 | 10 | 36 | 10 | 54 |
Utah | 31 | 13 | 51 | 5 | 65 | 5 | 30 |
Vermont | 14 | 56 | 30 | 1 | 54 | 1 | 45 |
Virginia | 46 | 16 | 31 | 7 | 47 | 7 | 46 |
Washington | 64 | 9 | 14 | 14 | 54 | 14 | 32 |
West Virginia | 45 | 21 | 30 | 4 | 58 | 4 | 40 |
Wisconsin | 32 | 21 | 36 | 11 | 56 | 11 | 31 |
Wyoming | 24 | 11 | 59 | 6 | 62 | 6 | 32 |
United States | 47 | 9 | 30 | 14 | 53 | 14 | 33 |
| Percentage of Total Input Mass | ||||||
| Inputs | Outputs | |||||
State | Fertilizer-N | Recoverable Manure-N | Legume-N Fixation | Crop Residues | Harvested Crop | Crop Residues | Balance |
Medium Scenario | |||||||
Alabama | 57 | 13 | 26 | 5 | 31 | 5 | 64 |
Alaska | 97 | 0 | 0 | 3 | 32 | 3 | 64 |
Arizona | 65 | 20 | 12 | 4 | 31 | 4 | 65 |
Arkansas | 35 | 7 | 48 | 10 | 40 | 10 | 50 |
California | 67 | 15 | 13 | 5 | 34 | 5 | 61 |
Colorado | 41 | 20 | 24 | 16 | 57 | 16 | 27 |
Connecticut | 48 | 36 | 16 | 1 | 28 | 1 | 71 |
Delaware | 35 | 13 | 42 | 10 | 32 | 10 | 58 |
Florida | 90 | 5 | 3 | 1 | 9 | 1 | 90 |
Georgia | 60 | 11 | 22 | 7 | 36 | 7 | 57 |
Hawaii | 93 | 6 | 0 | 0 | 1 | 0 | 99 |
Idaho | 54 | 8 | 27 | 11 | 54 | 11 | 35 |
Illinois | 40 | 2 | 39 | 19 | 56 | 19 | 25 |
Indiana | 42 | 3 | 36 | 18 | 54 | 18 | 27 |
Iowa | 38 | 4 | 38 | 19 | 59 | 19 | 22 |
Kansas | 46 | 12 | 24 | 17 | 58 | 17 | 25 |
Kentucky | 48 | 7 | 34 | 10 | 48 | 10 | 42 |
Louisiana | 47 | 2 | 43 | 9 | 37 | 9 | 54 |
Maine | 50 | 34 | 10 | 5 | 51 | 5 | 44 |
Maryland | 34 | 19 | 36 | 11 | 41 | 11 | 48 |
Massachusetts | 56 | 25 | 19 | 1 | 30 | 1 | 40 |
Michigan | 44 | 8 | 36 | 13 | 47 | 13 | 40 |
Minnesota | 39 | 6 | 38 | 17 | 55 | 17 | 28 |
| Percentage of Total Input Mass | ||||||
| Inputs | Outputs | |||||
State | Fertilizer-N | Recoverable Manure-N | Legume-N Fixation | Crop Residues | Harvested Crop | Crop Residues | Balance |
Mississippi | 41 | 4 | 48 | 7 | 33 | 7 | 60 |
Missouri | 35 | 5 | 48 | 12 | 53 | 12 | 34 |
Montana | 33 | 4 | 44 | 19 | 76 | 19 | 5 |
Nebraska | 49 | 7 | 25 | 19 | 53 | 19 | 28 |
Nevada | 15 | 7 | 76 | 2 | 93 | 2 | 5 |
New Hampshire | 35 | 34 | 31 | 0 | 55 | 0 | 45 |
New Jersey | 52 | 8 | 33 | 8 | 37 | 8 | 55 |
New Mexico | 38 | 23 | 31 | 8 | 58 | 8 | 34 |
New York | 33 | 28 | 32 | 7 | 49 | 7 | 45 |
North Carolina | 51 | 10 | 31 | 9 | 35 | 9 | 56 |
North Dakota | 50 | 2 | 30 | 18 | 59 | 18 | 23 |
Ohio | 40 | 4 | 41 | 15 | 52 | 15 | 33 |
Oklahoma | 68 | 8 | 14 | 9 | 45 | 9 | 46 |
Oregon | 63 | 7 | 20 | 9 | 52 | 9 | 39 |
Pennsylvania | 19 | 31 | 39 | 12 | 61 | 12 | 27 |
Rhode Island | 86 | 0 | 13 | 0 | 19 | 0 | 80 |
South Carolina | 50 | 4 | 38 | 9 | 35 | 9 | 57 |
South Dakota | 27 | 6 | 51 | 16 | 60 | 16 | 24 |
Tennessee | 48 | 7 | 37 | 8 | 40 | 8 | 52 |
Texas | 71 | 16 | 3 | 10 | 36 | 10 | 54 |
Utah | 29 | 12 | 53 | 5 | 62 | 5 | 33 |
Vermont | 14 | 54 | 31 | 1 | 53 | 1 | 46 |
Virginia | 44 | 16 | 33 | 7 | 46 | 7 | 48 |
Washington | 63 | 9 | 15 | 13 | 54 | 13 | 33 |
West Virginia | 44 | 21 | 32 | 4 | 55 | 4 | 42 |
Wisconsin | 31 | 21 | 38 | 11 | 56 | 11 | 33 |
Wyoming | 23 | 11 | 61 | 6 | 59 | 6 | 35 |
United States | 45 | 8 | 33 | 14 | 51 | 14 | 36 |
| Percentage of Total Input Mass | ||||||
| Inputs | Outputs | |||||
State | Fertilizer-N | Recoverable Manure-N | Legume-N Fixation | Crop Residues | Harvested Crop | Crop Residues | Balance |
High Scenario | |||||||
Alabama | 55 | 12 | 28 | 5 | 30 | 5 | 65 |
Alaska | 97 | 0 | 0 | 3 | 32 | 3 | 64 |
Arizona | 61 | 18 | 17 | 3 | 29 | 3 | 67 |
Arkansas | 33 | 7 | 51 | 10 | 38 | 10 | 52 |
California | 63 | 14 | 19 | 4 | 32 | 4 | 64 |
Colorado | 37 | 18 | 32 | 14 | 51 | 14 | 35 |
Connecticut | 44 | 33 | 22 | 1 | 26 | 1 | 73 |
Delaware | 33 | 13 | 45 | 9 | 30 | 9 | 60 |
Florida | 90 | 5 | 4 | 1 | 9 | 1 | 90 |
Georgia | 59 | 11 | 24 | 7 | 35 | 7 | 58 |
Hawaii | 93 | 6 | 0 | 0 | 1 | 0 | 99 |
Idaho | 48 | 7 | 36 | 10 | 47 | 10 | 43 |
Illinois | 38 | 2 | 42 | 18 | 53 | 18 | 29 |
Indiana | 40 | 3 | 39 | 17 | 52 | 17 | 31 |
Iowa | 36 | 4 | 42 | 18 | 55 | 18 | 27 |
Kansas | 44 | 11 | 28 | 16 | 55 | 16 | 29 |
Kentucky | 45 | 7 | 39 | 10 | 45 | 10 | 46 |
Louisiana | 45 | 2 | 45 | 8 | 35 | 8 | 56 |
Maine | 48 | 32 | 15 | 5 | 48 | 5 | 47 |
Maryland | 32 | 17 | 40 | 10 | 39 | 10 | 51 |
Massachusetts | 51 | 23 | 26 | 1 | 27 | 1 | 72 |
Michigan | 39 | 7 | 43 | 11 | 42 | 11 | 46 |
Minnesota | 36 | 5 | 43 | 15 | 51 | 15 | 34 |
| Percentage of Total Input Mass | ||||||
| Inputs | Outputs | |||||
State | Fertilizer-N | Recoverable Manure-N | Legume-N Fixation | Crop Residues | Harvested Crop | Crop Residues | Balance |
Mississippi | 39 | 4 | 51 | 7 | 32 | 7 | 62 |
Missouri | 33 | 4 | 51 | 12 | 50 | 12 | 39 |
Montana | 26 | 3 | 55 | 15 | 62 | 15 | 23 |
Nebraska | 46 | 7 | 29 | 18 | 50 | 18 | 32 |
Nevada | 11 | 5 | 83 | 1 | 67 | 1 | 32 |
New Hampshire | 30 | 29 | 41 | 0 | 47 | 0 | 52 |
New Jersey | 48 | 7 | 38 | 7 | 34 | 7 | 59 |
New Mexico | 32 | 20 | 41 | 7 | 50 | 7 | 43 |
New York | 29 | 24 | 42 | 6 | 42 | 6 | 53 |
North Carolina | 49 | 9 | 33 | 9 | 34 | 9 | 58 |
North Dakota | 45 | 2 | 37 | 16 | 53 | 16 | 31 |
Ohio | 37 | 4 | 45 | 14 | 49 | 14 | 38 |
Oklahoma | 65 | 8 | 18 | 9 | 43 | 9 | 48 |
Oregon | 57 | 7 | 28 | 8 | 47 | 8 | 45 |
Pennsylvania | 16 | 26 | 48 | 10 | 52 | 10 | 38 |
Rhode Island | 81 | 0 | 19 | 0 | 18 | 0 | 82 |
South Carolina | 48 | 4 | 40 | 8 | 33 | 8 | 58 |
South Dakota | 23 | 5 | 59 | 13 | 50 | 13 | 36 |
Tennessee | 45 | 7 | 41 | 8 | 38 | 8 | 55 |
Texas | 70 | 16 | 5 | 10 | 35 | 10 | 55 |
Utah | 23 | 10 | 63 | 4 | 49 | 4 | 47 |
Vermont | 12 | 47 | 41 | 1 | 46 | 1 | 54 |
Virginia | 41 | 15 | 38 | 6 | 42 | 6 | 51 |
Washington | 58 | 8 | 21 | 12 | 50 | 12 | 38 |
West Virginia | 38 | 18 | 41 | 3 | 47 | 3 | 50 |
Wisconsin | 26 | 17 | 47 | 9 | 47 | 9 | 43 |
Wyoming | 18 | 8 | 70 | 4 | 45 | 4 | 51 |
United States | 42 | 8 | 38 | 13 | 47 | 13 | 40 |
NOTE: See the Appendix for a full discussion of the methods used to estimate nitrogen inputs and outputs. | |||||||
TABLE 6-5 Nitrogen and Phosphorus Fertilizer Use: Top Ten States
Rank | State | Percent Nitrogen Use | Rank | State | Percent Phosphorus Use |
1. | Illinois | 9 | 1. | Illinois | 9 |
2. | Iowa | 9 | 2. | Iowa | 7 |
3. | Texas | 8 | 3. | Texas | 6 |
4. | Nebraska | 7 | 4. | Minnesota | 6 |
5. | Minnesota | 5 | 5. | Indiana | 5 |
6. | California | 5 | 6. | Missouri | 4 |
7. | Kansas | 5 | 7. | California | 4 |
8. | Indiana | 4 | 8. | Ohio | 4 |
9. | Missouri | 4 | 9. | Kansas | 4 |
10. | Oklahoma |
| 10. | Nebraska | 4 |
| Subtotal | 59 |
| Subtotal | 53 |
SOURCE: H. Vroomen. 1989. Fertilizer Use and Price Statistics: 1960–88. Statistical Bulletin 780. Washington, D.C.: U.S. Department of Agriculture, Economic Research Service, Resources and Technology Division. | |||||
is by far the major nitrogen user in the United States, accounting for about 41 percent of the fertilizer-N applied (Vroomen, 1989).
Rates of application of fertilizer-N also vary by crop and region. Of the major commodity crops, little or no nitrogen is applied to soybean crops; but in 1988, an average of 153 kg of nitrogen/ha (137 lb/acre) was applied to corn crops nationwide. Corn crops receive the highest amounts of fertilizer-N, which have increased nationally from about 67 kg/ha (60 lb/acre) in 1965 to about 157 kg/ha (140 lb/acre) in 1985. Rates have declined slightly since 1985. The rates of fertilizer-N application to crops such as sorghum and potatoes are also significant, but these crops cover more limited areas (Vroomen, 1989). Geographically, fertilizer-N use parallels cropping patterns; 10 states—predominantly grain-producing states—account for nearly 60 percent of fertilizer-N use (Table 6-5).
Nitrogen Fixed by Legumes
The symbiotic bacteria associated with leguminous crops such as alfalfa and soybeans can fix and add substantial amounts of nitrogen to the soil. The amount of nitrogen fixed by alfalfa and soybeans under the low, medium, and high scenarios is approximately 6.1 million metric tons (6.6 million tons), 6.9 million metric tons (7.5 million tons), and 8.6 million metric tons (9.5 million tons), respectively. These estimates represent 30, 33, and 38 percent of nitrogen inputs, respectively (depending on the rate of fixation and the nitrogen replacement values used for alfalfa and soybeans). Alfalfa has been reported to fix as little as
70 kg of nitrogen/ha (62 lb/acre) and as much as 600 kg of nitrogen/ha (532 lb/acre). Soybeans have been found to fix as little as 15 kg of nitrogen/ha (13 lb/acre) and as much as 310 kg of nitrogen/ha (275 lb/acre) (Appendix Table A-4). Some of that fixed nitrogen is removed when the crop is harvested, but some remains in the soil and is available for subsequent crops.
Estimates of the amount of nitrogen actually fixed by particular legumes are problematic because there are no unequivocal methods for measurement (see Appendix). Crop rotation with legumes, however, consistently produces a yield benefit to succeeding crops with reduced inputs of nitrogen. The contribution of legumes to the national nitrogen balance is very important (Tables 6-3 and 6-4). To minimize environmental losses of nitrogen and to optimize crop yields, an estimate of the legume contribution to nitrogen in the farming system must be considered.
Nitrogen in Animal Manure
The importance of the nitrogen in manure (manure-N) in the mass balance varies from region to region (Tables 6-3 and 6-4). When livestock is a component of the farming system, the contribution of manure-N to the mass balance can be significant.
Economically recoverable manure-N represents 9, 8, and 8 percent of total nitrogen inputs in the low, medium, and high scenarios, respectively. The mass of economically recoverable manure-N, however, is relatively low compared with the total mass of manure-N. Nationally, only 34 percent of the total nitrogen voided in manures is estimated to be economically recoverable for use elsewhere. The portion of manures that are economically recoverable can be increased through better management.
The amount of manure-N actually applied to croplands depends on the kind of manure and, particularly, the way that the producer handles the manure. Application rates vary dramatically from farm to farm, and manure is often applied by using manure-spreading equipment that makes careful calibrations of the nitrogen application rate difficult. In Lancaster County, Pennsylvania, for example, Schepers and Fox (1989) found that manure was applied to fields at rates ranging from 29 to 101 metric tons/ha (13 to 45 tons/acre), even though producers thought they were applying 45 metric tons/ha (20 tons/acre). Different animal manures contain different proportions of nitrogen, and the nitrogen occurs in various forms. A large portion of the nitrogen in manures may be found in the organic form and is not
immediately available for crops when it is applied. This nitrogen becomes available over time as it is mineralized and can contribute nitrogen over several crop seasons.
These and other special problems in managing nutrients in manures are discussed at greater length in Chapter 11.
Nitrogen in Crop Residue
Crop residue is the mass of plant matter that remains in the field after harvest (such as corn stover). The harvested portion of crops remove nutrients from the system, but most of the crop residues remain in the soil system and effectively enter the organic-N storage component. Although crop residues from a previous year may be factored as an input, the crop residues of the current crop year must be considered an output, and for a given field this often results in a relative balance. Hence, in routine management and nutrient-yield response evaluations, residues are often ignored as inputs and are implicitly factored into the soil-mineralization contribution.
Other Nitrogen Inputs
Synthetic fertilizers, legumes, and manures are the most important sources of nitrogen inputs to soil-crop systems. Nitrogen is, however, added to soil-crop systems in rainfall and irrigation water and through mineralization from soil organic matter. In certain farming systems and at certain times, these other inputs can be important. Because of their variability and the difficulty in estimating the amount of nitrogen obtained from these sources on a state or national basis, they were not used to estimate the mass balances given in Tables 6-1, 6-3, and 6-4. There are other inputs sources, such as nitrogen in dry deposition, crop seed, foliar absorption, and nonsymbiotic fixation of nitrogen. These are minor or secondary inputs that are not typically manageable and are seldom measured. These sources have been implicitly included in nutrient-yield response evaluations and are explicitly ignored in most studies.
Nitrogen in Rainfall
The amount of nitrogen found in rainfall varies from storm to storm and region to region. The total inorganic nitrogen deposited in rainfall ranged from 3.9 to 12.4 kg/ha/year (3.5 to 11.1 lb/acre/year) in studies done in Indiana, Iowa, Minnesota, Wisconsin, and Nebraska (Tabatabai
et al., 1981); and annual averages across the eastern United States in National Atmospheric Deposition Program Monitoring range from 3 to 7 kg/ha (3 to 6 lb/acre) (Schepers and Fox, 1989). These sources provide low amounts of nitrogen compared with the nitrogen inputs from fertilizers, manure, and legumes in intensively managed croplands. Hence, they are not typically considered in cropland nitrogen mass balances (Oberle and Keeney, 1990). They can be, however, an important source of nitrogen in rangelands and natural ecosystems (Schepers and Fox, 1989). Nitrogen inputs from precipitation are generally low, and they are often assumed to be about equivalent to the annual nitrogen losses through runoff and erosion (Meisinger, 1984).
Nitrogen in Irrigation Water
The amount of nitrogen in irrigation water is often quite low and is not normally considered in nitrogen mass balances. However, in areas where irrigated and fertilized crop production has been practiced for some time, the nitrogen in the form of nitrate (nitrate-N) in the groundwater used to irrigate crops has become a significant nitrogen source. In the Central Platte River Valley in Nebraska, nitrate contamination of the shallow groundwater has been increasing at a rate of 0.4 to 1.0 mg/liter/year (0.4 to 1.0 ppm/year) (Exner, 1985; Exner and Spalding, 1976, 1990; Spalding et al., 1978). The contamination is related to the nitrogen output losses from intensive nitrogen fertilization in irrigated corn production. In many areas the nitrate-N concentrations in the groundwater have increased from 2 mg/liter (2 ppm) to between 10 and more than 20 mg/liter (10 to >20 ppm) (Exner and Spalding, 1990). With increased nitrate-N concentrations, irrigation water can become an important source of nitrogen. For example, 30 cm (12 inches) of irrigation water with a nitrate-N concentration of 20 mg/liter (20 ppm) would result in an application of 60 kg of nitrogen to each hectare (54 lb/acre) irrigated.
Schepers and colleagues (1986) noted that in the Central Platte River Valley, the groundwater used to irrigate corn contributed an average of 46 kg of nitrogen/ha (41 lb/acre), or 31 percent of the nitrogen applied as fertilizer. The groundwater used to irrigate potatoes in Wisconsin contributed an average of 57 kg/ha (51 lb/acre), or 25 percent of the nitrogen added as fertilizer (Saffigna and Keeney, 1977). Surface waters used as sources of irrigation water usually contain much lower concentrations of nitrogen (Schepers and Fox, 1989). In some natural resource districts in Nebraska, the nitrate-N in the irrigation water must now be
accounted for and is used to reduce the amount of fertilizer-N applied (Central Platte Natural Resources District, 1992; Schepers et al., 1991).
Soil Nitrogen and Mineralization
Mineralization is a relatively slow process that is dependent on temperature and moisture; only 2 to 3 percent of the organic nitrogen stored in soil is mineralized annually (Buckman and Brady, 1969; Oberle and Keeney, 1990). This 2 to 3 percent, however, is the basis for natural ecosystem nutrient cycling and, depending on the amount of organic matter in the soil, can supply a significant portion of the nitrogen needed by crops each year.
Despite the relatively slow rate of mineralization, this process can be an important factor in determining the year-to-year variability in the amount of nitrogen available to crop plants. The 2 to 3 percent mineralization rate is an average and the moisture and temperature regimes that are optimal for plant growth are also optimal for nitrogen mineralization and nitrification that make the nitrogen stored in soil organic matter available to plants. In years when conditions are optimal, more nitrogen may be released; this natural interaction is an important contributor of nitrogen in climatically optimal years that produce bumper crops. However, the mineralization of nitrogen from the soil, related to inherent soil fertility, has been implicitly included in nutrient-yield response and management evaluations for different soils. New tools are needed to measure the actual nitrogen available from mineralization and other residuals to account for and take advantage of annual variability.
Nitrogen Outputs
The primary desired output is nitrogen taken up in harvested crops and crop residues. Nitrogen is lost to the atmosphere by volatilization and denitrification and is washed away in runoff in solution, attached to eroded particulates or organic matter. Nitrogen is also leached as nitrate to locations deeper in the soil or to groundwater. Other minor outputs can include gaseous losses such as N2O evolution during nitrification; decomposition of nitrous acid, or losses directly from maturing or senescent crops (Bremner et al., 1981; Meisinger and Randall, 1991; Nelson, 1982). Some nutrients are taken up by weeds or immobilized by microbes, but these nutrients primarily enter the organic-N storage pool. These minor outputs are secondary factors and have typically been implicitly included in nutrient-crop yield response models.
Nitrogen in Crops and Residues
The nitrogen found in harvested crops represents the greatest and most important output of nitrogen from croplands. For 1987, the nitrogen harvested in crops and residues was estimated at more than 13 million metric tons (14 million tons) (Table 6-1). The amount of nitrogen harvested in crops and residues was estimated to be 67, 64, and 60 percent of total inputs under the low, medium, and high scenarios, respectively. The balance of total nitrogen inputs not accounted for in crops or residues was 6.7 million, 7.4 million, and 9.1 million metric tons (7.4 million, 8.1 million, and 10 million tons) under the low, medium, and high scenarios, respectively. These balances represent 33, 36, and 40 percent of total nitrogen inputs, respectively.
Nitrogen Balance
The national nitrogen balance summarized in Tables 6-1, 6-3, and 6-4, is a partial cropland budget (see Appendix for details). The balance term in Table 6-1 is simply the residual of the major cropland inputs minus the major output of nitrogen taken up in crop production. The balance term, or residual in this treatment, is an estimate of the amount of nitrogen available that (1) may go into storage or (2) may potentially be lost into the environment. The magnitude of the balance and the relative magnitude of the inputs provide insights into the opportunities to improve the environmental and financial performance of farming systems.
Nitrogen balances are positive under all three scenarios (Table 6-1). At the national level, the nitrogen applied to croplands in synthetic fertilizers is roughly the same as that obtained in harvested crops (not including crop residues). Nitrogen balances range from 6 million to 9 million metric tons (6.7 million to 10 million tons) under the low and high scenarios, respectively. Under the high scenario, the nitrogen balance is nearly equal to the amount of nitrogen purchased in synthetic fertilizer. The results reported under the high scenario in Table 6-1 are similar to those reported by Power (1981) and Follett and colleagues (1987) for nitrogen mass balance in 1977 (Table 6-6).
These aggregate mass balances must be interpreted with caution. As discussed earlier, not all of the estimated nitrogen inputs are available for crop growth. A positive balance should, therefore, be expected; and a positive balance of 7 million metric tons (7.8 million tons) of nitrogen, such as estimated under the medium scenario in Table 6-1, does not mean that fertilizer nitrogen applications can be reduced by this same amount.
TABLE 6-6 Estimated Nitrogen Balance for Crop Production in the United States, 1977
Nitrogen Output or Input | Metric Tons of Nitrogen | Percentage of Total Nitrogen Input Mass |
Output in 1977 in Harvested crops | 7.6 | 36 |
Crop residues | 4.3 | 20 |
Total | 11.9 | 56 |
Inputs to cropland | ||
As commercial fertilizer | 9.5 | 45 |
As symbiotically fixed N | 7.2 | 34 |
In crop residues | 3.0 | 14 |
In manure and organic wastes | 1.4 | 7 |
Total | 21.1 | 100 |
SOURCE: Adapted from J. F. Power. 1981. Nitrogen in the cultivated ecosystem. Pp. 529-546 in Terrestrial Nitrogen Cycles—Processes, Ecosystem Strategies and Management Impacts, F. E. Clark and T. Rosswall, eds. Ecological Bulletin No. 33. Stockholm, Sweden: Swedish Natural Science Research Council. | ||
The magnitude of the estimated positive balances, however, does help to explain the prevalence of elevated nitrate concentrations in surface water and groundwater in intensive agricultural watersheds. The magnitude of the positive nitrogen balance and the portion of that balance lost to surface water, groundwater, or the atmosphere, however, vary greatly by region and between farms.
The amount of nitrogen taken up (the output term) varies from crop to crop and with crop yield. This variation is evident in the aggregate mass balances among the states (Tables 6-3 and 6-4). Such aggregate differences, however, do not account for the disparity between nitrogen additions and removals for selected crops. For example, as many large-scale balances would suggest, the harvested crop nitrogen output is slightly greater than the fertilizer nitrogen input. However, more than 35 percent of the nitrogen output in harvested crops is accounted for by various legumes that receive very little nitrogen fertilizer. Major commodities, including corn, cotton, potatoes, rice, and wheat account for more than 80 percent of the fertilizer-N applied. The nitrogen output in harvested grain from these commodities, however, accounts for only about 57 percent of their fertilizer-N input. If all legume inputs and outputs are taken out of the national balance, the remaining harvested crops output is only equivalent to about 35 to 40 percent of the fertilizer- and manure-N inputs. In 1987, approximately 41 percent of total
fertilizer-N used was applied to corn, whereas approximately 26 percent of the nitrogen in all harvested crops was in corn.
These data illustrate one part of the nitrogen balance problem; at current rates of nitrogen application, some crop management systems are not as efficient as was once presumed. Nitrogen recovery, even apparent nitrogen recovery, by agronomic crops is seldom more than 70 percent, and average values are closer to 50 percent (Keeney, 1982). Furthermore, some of the nitrogen recovered by crop plants is returned to the soil nitrogen pool as crop residues and roots and becomes part of the nitrogen pool in the soil. The amount of nitrogen actually removed from the system in harvested portions of the crop can be more in the range of 35 percent or less, particularly for continuous cropping of corn or other grains that receive large additions of nitrogen (Meisinger et al., 1985; Sanchez and Blackmer, 1988; Timmons and Baker, 1991; Varvel and Peterson, 1990).
Peterson and Frye (1989) obtained a similar result; that is, for U.S. corn production, the amount of nitrogen fertilizer used has exceeded the amount of nitrogen harvested in grain by 50 percent every year since 1968. This situation is even more striking because the data do not account for any other nitrogen additions—from manure, legumes in rotation, or soil nitrogen mineralization—that are common in corn production.
Losses to the Environment
As discussed, the residual or balance term in the nitrogen balance is an estimate of the amount of nitrogen that may go into storage or be lost into the environment. Various cropland studies show that the post-harvest residual of available nitrogen in the soil, both in the fall and following crop season, is proportionately related to the amount of nitrogen applied (e.g., Bundy and Malone, 1988; Jokela, 1992; Jokela and Randall, 1989). In the context of climatic variability and related crop yield variability, some residual nitrogen and some losses into the environment are inevitable. The magnitude of this residual is related to the potential for excessive losses into the environment.
Losses to the Atmosphere
Nitrogen can volatilize directly from the fertilizers and manure applied to the surface of croplands and can be lost from the soil as nitrogen gases are produced through denitrification. Losses from direct volatilization can be quite large, especially from surface applications of
manure. These contributions of nitrous oxides, ammonia, and methane to greenhouse gases is of concern. Recent studies suggest that, except under special conditions, loss of nitrogen through denitrification may be lower than previously thought (Schepers and Fox, 1989). For most rainfed systems of fertilized crops, estimates of nitrous oxide emissions from denitrification and nitrification range from 1 to 20 kg/ha/year (1 to 18 lb/acre/year) (Duxbury et al., 1982; Thomas and Gilliam, 1978) and the proportion of fertilizer-N lost is estimated at 2 to 3 percent per year (Eichner, 1990; Goodroad et al., 1984). Cultivated legumes also contribute to nitrous oxide emissions (Eichner, 1990) and losses from flooded rice production can be quite high for many gaseous forms of nitrogen (Lindau et al., 1990). Part of the unaccounted for nitrogen in Table 6-1 is undoubtedly delivered to the atmosphere, but the probable amount of nitrogen lost to the atmosphere is difficult to estimate.
Losses to Surface Water and Groundwater
A portion of the unaccounted for nitrogen is delivered to surface water and groundwater through runoff, erosion, and leaching. Larson and colleagues (1983) estimated that 9.5 metric tons (10.5 million tons) of nitrogen was lost with eroded soil in 1982, an amount roughly equivalent to the amount of nitrogen applied in synthetic fertilizers in 1987. In addition, some nitrogen in the form of ammonium (ammonium-N) is lost along with the organic-N attached to soil particles. This ammonium-N contributes to the available nitrogen in surface water. Little soluble nitrogen is lost in true runoff. The majority of soluble nitrogen, nitrate, is lost in leaching through the soil and may move as shallow, subsurface flow or as deeper groundwater into surface waters (Lowrance, 1992a). Most of the nitrate found in surface waters comes from this groundwater component (Hallberg, 1987).
Proportional relationships between nitrogen applications and the nitrogen found in water have been shown in several studies (Hallberg, 1989b; Keeney, 1986a). The amount of nitrate-nitrogen lost in leaching to drainage tiles installed beneath topsoil was related in a nearly linear fashion to the amount of nitrogen applied for lands with application rates that exceeded 50 kg/ha (45 lb/acre) (Baker and Laflen, 1983). Nitrate accumulated in the water of subsoils of three experimental sites in Virginia only after the amount of nitrogen applied exceeded the optimum rate (Hahne et al., 1977). Investigators found a similar pattern in central Nebraska. The concentration of nitrate-nitrogen in groundwater under croplands was found to increase as the rate of nitrogen application increased (Schepers et al., 1991). The groundwater under croplands
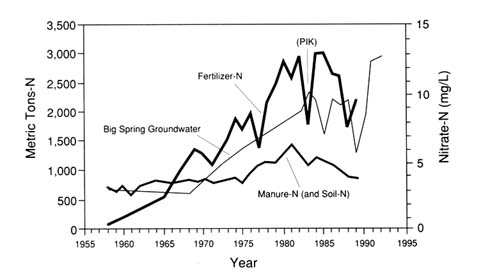
FIGURE 6-2 Amount of fertilizer-N and manure-N applied in relation to annual average nitrate concentration in groundwater in Big Spring Basin, Iowa. PIK, the Payment-In-Kind program initiated by the U.S. Department of Agriculture in 1983 that resulted in taking large acreages of cropland out of production in 1983. Source: G. R. Hallberg. 1989. Nitrate in ground water in the United States. Pp. 35–74 in Nitrogen Management and Ground Water Protection, R. F. Follet, ed. Amsterdam: Elsevier. Reprinted with permission from © Elsevier Science Publishers, B.V.
that received nitrogen at 45 kg/ha (50 lb/acre) less than the recommended application rate had nitrate concentrations of about 10 mg/liter (10 ppm). Concentrations of 18 to 25 mg/liter (18 to 25 ppm) were found under croplands where producers applied nitrogen at up to 168 kg/ha (150 lb/acre) in excess of the recommended amount (Schepers et al., 1991). In this area of central Nebraska, there was no significant difference in yields between fields where 23 kg/ha (50 lb/acre) less than the recommended amount was applied and fields where 168 kg/ha (150 lb/acre) more than the recommended amount of nitrogen was applied.
Data from the Big Spring Basin in Iowa trace the relationship of increasing residual nitrogen and groundwater nitrate concentrations over time (Figure 6-2). The amount of nitrogen applied as commercial fertilizer, manure, and legume-N has increasingly exceeded that harvested in the crop since 1970 (Hallberg, 1987). The concentration of nitrate in groundwater has increased as the difference between the amount of nitrogen applied and the amount of nitrogen harvested has
increased and as the number of years of applied nitrogen amounts in excess of harvested nitrogen amounts has increased.
Many studies have shown that the amount of residual nitrogen in cropland soil is closely related to the amount of nitrogen applied as fertilizer manure or provided as legumes. The application of nitrogen in excess of that needed for crop requirements leaves a pool of residual nitrogen in the soil at the end of each growing season. Much of this residual nitrogen is in the form of nitrates. Nitrates are soluble in water and move quickly and easily through the soil profile. It is the residual nitrogen that is most likely to pollute groundwater or surface water. Some of this residual may remain in the root zone and contribute to subsequent crops (Jokella and Randall, 1989), but this residual can readily be lost to pollute groundwater and surface water (Hallberg, 1987; Sanchez and Blackmer, 1988).
OPPORTUNITIES TO REDUCE NITROGEN LOSSES
The nitrogen mass balances in Tables 6-1, 6-3, and 6-4 illustrate the fact that, under some situations, the mass of unharvested nitrogen can be quite large. The balance between the nitrogen entering and leaving the soil-crop system is the critical factor that must be managed on croplands to prevent unacceptable losses of nitrogen to the environment. The goal is to strike a balance between the amount of nitrogen entering the system and the amount taken up and removed by crops while minimizing the amount of nitrogen left in the system so that the mass of residual nitrogen that may end up in water or the atmosphere, over time, is as small as possible. Reducing the mass of residual nitrogen added to the soil-crop system can improve both economic and environmental performances.
Reducing the mass of residual nitrogen in the soil-crop system can be accomplished by accounting for all sources of nitrogen added to the system, refining estimates of crop nitrogen requirements, refining yield goals, synchronizing the application of nitrogen with crop needs, and increasing seasonal nitrogen uptake in the cropping system.
Accounting for Nitrogen from All Sources
The nitrogen balances in Tables 6-1, 6-3, and 6-4 suggest the importance of accounting for all nitrogen sources in the farming system when attempting to improve nitrogen management. Regional or farm level nitrogen balances reveal similar imbalances between nitrogen inputs and outputs.
Regional Nutrient Balances
Peterson and Russelle (1991) estimated that alfalfa, which occupies only 8 percent of the cropland in the Corn Belt, fixes more than 1 billion kg of nitrogen (2.2 billion lb) annually, whereas 4 billion kg (8.8 billion lb) of nitrogen is applied in the form of commercial fertilizer to croplands in the eight-state Corn Belt region. Alfalfa accumulates nitrogen through symbiotic fixation and the concentration of nitrogen from the soil profile. It contributes some of this nitrogen directly to the soil-crop system when it is plower under for a succeeding crop through mineralization of plant residues. It contributes nitrogen indirectly through manures from livestock fed alfalfa. Peterson and Russelle (1991) estimate that if the nitrogen contributed both directly and indirectly by alfalfa was accounted for, fertilizer-N applications in the Corn Belt as a whole could be reduced between 8 and 14 percent with no yield loss (Table 6-7). For states with larger areas of alfalfa crops, the potential fertilizer reductions are much greater. In Wisconsin, for example, the range of possible nitrogen application reductions was 37 to 66 percent, in Michigan it was 20 to 36 percent, and in Minnesota it was 13 to 23 percent.
Lowrance and colleagues (1985) estimated nutrient budgets for agricultural watersheds in the southeastern coastal plain. They accounted for nitrogen inputs from precipitation, commercial fertilizer, and legumes and estimated the outputs in stream flows and harvests. The proportion of nitrogen unaccounted for in harvested crops ranged from 47 to 75 percent of total inputs, depending on the watershed and the year studied.
Farm Nitrogen Balances
Legg and colleagues (1989) estimated nitrogen balances for southeastern Minnesota and found that nitrogen from alfalfa, soybeans, and manure provided, on average, 95 kg/ha (85 lb/acre) or 64 percent of the nitrogen applied in commercial fertilizers. The total nitrogen per hectare applied from all sources was, on average, 72 kg/ha (64 lb/acre) in excess of the nitrogen needed to achieve yield goals. The importance of accounting for all sources of nitrogen applied to the crop-soil system is even more apparent if the data provided by Legg and colleagues (1989) for four farms in their study area are examined (see Chapter 2, Table 2-2). For farms A, B, and C, respectively, 42, 102, and 29 percent of the nitrogen needed to achieve yield goals was provided by legumes and manure alone. All three farms, however, applied commercial fertilizer in
TABLE 6-7 Potential Reductions in Nitrogen Fertilizer Applied to Corn
|
| Potential Fertilizer Reductions (106 kg) | |||||
| Area of Corn Following | After Alfalfa | With Manure | Total (percent) | |||
State | Alfalfaa (103 ha) | Highb | Lowc | Highd | Lowe | Highf | Lowf |
Illinois | 86 | 22 | 7 | 16 | 13 | 38 (5) | 20 (3) |
Indiana | 47 | 12 | 4 | 8 | 7 | 21 (5) | 11 (2) |
Iowa | 185 | 43 | 14 | 34 | 27 | 76 (9) | 41 (5) |
Michigan | 162 | 34 | 11 | 27 | 21 | 61 (36) | 33 (20) |
Minnesota | 219 | 39 | 13 | 36 | 29 | 75 (23) | 42 (13) |
Missouri | 51 | 11 | 4 | 7 | 5 | 17 (13) | 9 (7) |
Ohio | 78 | 20 | 7 | 14 | 11 | 33 (12) | 17 (6) |
Wisconsin | 363 | 57 | 19 | 56 | 45 | 133 (66) | 64 (37) |
Total | 1,191 | 238 | 79 | 198 | 157 | 435 (14) | 237 (8) |
NOTE: Potential reductions are estimated by adjusting fertilizer application rates to account for the nitrogen supplied by alfalfa by fixation or indirectly from manure produced by livestock fed alfalfa. a Assuming 28.6 percent of the alfalfa area is rotated to corn each year. b Assuming corn does not require nitrogen fertilizer the first year following alfalfa and requires half the average rate the second year after alfalfa. c Assuming corn requires half the average rate the first year following alfalfa and the full average rate the second year after alfalfa. d Assuming 40 percent of the nitrogen in manure is available to corn the first year after application and 40 percent of the remaining nitrogen is available the second year after application. e Assuming 30 percent of the nitrogen in manure is available to corn the first year after application and 30 percent of the remaining nitrogen is available the second year after application. f Fertilizer-N reduction expressed as a percentage of total nitrogen fertilizer applied to corn. SOURCE: T. A. Peterson and M. P. Russelle. 1991. Alfalfa and the nitrogen cycle in the Corn Belt. Journal of Soil and Water Conservation 46:229–235. Reprinted with permission from © Journal of Soil and Water Conservation. | |||||||
amounts nearly adequate to achieve yield goals in the absence of any other nitrogen inputs. For these three farms, commercial fertilizer applications could have been reduced by 39, 100, and 19 percent, respectively, without any change in yield goals or loss in yields.
Similar results have been reported elsewhere (Hallberg, 1987; Lanyon and Beegle, 1989; Magette et al., 1989; Olson, 1985). A budget for the state of Nebraska suggests that since the mid-1960s, the amount of nitrogen applied to croplands has exceeded crop requirements by 20 to 60 percent (Olson, 1985). The regional and farm level nitrogen balances reinforce the results of the state and national balances in Tables 6-3 and 6-4.
Improving Nitrogen Management
These results clearly suggest that producers have a great opportunity to improve nitrogen management and reduce the mass of residual nitrogen in the soil-crop system by properly accounting for all sources of nitrogen. The importance of accounting for all sources of nitrogen varies greatly from farm to farm and region to region, depending on the relative contributions of various sources of nitrogen to the soil-crop system. Regional variation is apparent in Tables 6-3 and 6-4 (see also Figure 3-1, Chapter 3).
When multiple sources of nitrogen are involved, a proper accounting of all sources may be the single most important step in improving nitrogen management. The amount of nitrogen that needs to be applied to cropland depends on how much nitrogen is already available from all sources. Nitrogen available from manure applications, legumes, soil organic matter, and other sources should be accounted for before recommendations for supplemental applications of nitrogen are made. The importance of carefully accounting for all sources of nitrogen has been repeatedly stressed as a way to improve nitrogen management (see, for example, Bock and Hergert [1991], Peterson and Frye [1989], Schepers and Mosier [1991], and University of Wisconsin-Extension and Wisconsin Department of Agriculture, Trade and Consumer Protection [1989]; U.S. Congress, Office of Technology Assessment [1990]).
Even though crop producers can nearly always reduce their costs by adequately accounting for all sources of nitrogen, the available survey data suggest that such accounting is the exception rather than the rule in current practice. In 1987, El-Hout and Blackmer (1990) evaluated the nitrogen status of first year corn fields, following alfalfa rotations, in northeastern Iowa using soil and tissue tests. The evaluations showed that most producers were not taking adequate credits for their alfalfa. Fertilizer-N application rates ranged from 6 to 227 kg/ha (5 to 203 lb/acre) and averaged 136 kg/ha (121 lb/acre), yet yields ranged from 9 to 13 metric tons/ha (4 to 6 tons/acre), averaging about 12 metric tons/ha (5 lb/acre). Fifty-nine percent of the fields also received some manure applications. Of the 29 fields, 86 percent had greater concentrations of soil nitrate than were needed for optimal yields; 56 percent had at least twice the critical amount needed, and 21 percent had at least three times this amount. Crop response studies in this region have consistently shown that no fertilizer-N or only a small starter nitrogen application is needed to produce optimal or maximum yields after a multiyear alfalfa stand. Had such recommendations for rotation benefits been followed, the average optimal fertilizer-N rate would have been 13 kg/ha (12
lb/acre), 123 kg/ha (110 lb/acre) less than the rate that was used (El-Hout and Blackmer, 1990).
Soil Testing
Although soil testing in the fall can be an effective management tool for phosphorus and potassium, this is not the case for nitrogen. Measuring the nitrogen available as nitrate or ammonium in fall soil samples is ineffective for estimating the amount of residual nitrogen available from the soil for the next growing season. Because such nitrogen is readily transformed or leached over the fall, winter, and early spring, the available forms of nitrogen present in the fall often have little bearing on the available nitrogen for the next season in the humid and subhumid Grain Belt states (Jokela and Randall, 1989; Magdoff, 1991a,b). Organic carbon content is sometimes measured by using fall soil samples, and this measure is used to provide an estimate of the amount that may be mineralized in the next growing season. The long-term average amount of mineralized nitrogen contributed is one of many factors implicitly incorporated into long-term nitrogen application rate experiments and, hence, is also implicitly included in nitrogen recommendations based on such studies. New soil testing approaches are showing promise to provide enhanced management, particularly for crop production in the grain belt (Binford et al., 1992; Magdoff, 1991a,b).
Improving Estimates of Crop Nitrogen Needs
The first stage in nitrogen management is the establishment of the nitrogen requirements and the yield response of the crop to nitrogen. This work is done through field trials by growing the crop using various nitrogen application rates, usually on research plots, and measuring the changes in crop yields. The variability in crop response to nitrogen is accounted for by multiple plot replications of the same nitrogen application rates to integrate the local variability imposed by soil (and imposed by the research methods used on small plots), replication of experiments in different areas to assess the variability caused by different soil and climatic conditions, and replication of experiments over time at the same location to integrate the variability imposed by annual climatic differences. Variability in results is confounded, for example, by genetic improvements in corn hybrids, crop rotations, tillage, and pest and weed management.
Such experiments have been used to establish realistic crop production potentials for various regional (substate) combinations of soil,
climate, and management. With all the sources of variance in such data (for example, year-to-year and plot-to-plot variations), determination of optimal fertilization rates involves the fitting of some form of statistical model to the observed crop yield responses to the various rates of fertilizer application over time.
Economically Optimum Rate of Nitrogen Application
The concept of the economically optimum rate of nitrogen application was developed early in the assessment of the use of fertilizers to enhance crop production (Heady et al., 1955; National Research Council, 1961). Because there is a declining rate of yield increase at increasing rates of application, the economically optimum rate is functionally the point at which the price of the last small increment of fertilizer equals the value of the additional crop produced by this fertilizer. At higher rates the additional crop is worth less than the additional fertilizer. This relationship is affected by changes in fertilizer and corn prices. Many different statistical response models have been used to identify economic optimum rates. Various reports have noted that these models can disagree significantly in identifying optimal rates (Anderson and Nelson, 1975; Cerrato and Blackmer, 1990; Nelson et al., 1985), but these disagreements have received little attention. There is no standard approach for selecting one model over another. Typically, investigators use the best-fitting model, determined by a correlation coefficient, to the given set of data. Corn yield responses to nitrogen most typically have been described by a quadratic equation model and field studies with two to four replications of two to four rates of fertilizer application, particularly for long-term studies.
More Refined Models Needed
Recent work provides a more rigorous statistical comparison and assessment of such models. Using data from long-term crop rotation studies (with up to 28 years of continuous treatment), Blackmer (1986) illustrated that testing two to four different rates of fertilizer application does not provide enough data to define the economically optimal nitrogen application rate. Cerrato and Blackmer (1990) evaluated the five most widely used response models, and their resultant predictions, from 12 site-years of corn yield data. They used 10 nitrogen application rates for each site and three replications of each treatment. The various models provided similar, significant correlations and predicted similar maximum crop yields. However, the models predicted widely different
economically optimum rates of nitrogen fertilization ranging from 128 to 379 kg/ha (114 to 338 lb/acre). Using the standard model the predicted rate was 22 percent greater than the best model indicated by more thorough statistical evaluation of the results.
This illustrates a source of potential error that contributes to excess nitrogen use. Although refinement of such crop response models is hardly as simple as it seems, refinement of such models is important for refining nitrogen input recommendations (Bock and Sikora, 1990).
Determining Realistic Yield Goals
Ideally, the nitrogen fertilizer application recommendation should be based on the amount of nitrogen that must be made available during the growing season to produce the crop. However, estimates of the amount of nitrogen that the crop needs must be made before the crop is grown and before the weather and other factors that will affect the year's yield are known. Hence, the producer establishes a yield goal: a preseason estimate of the crop yield the producer hopes to realize. The yield goal is then used to project the amount of nitrogen that should be applied on the basis of the projected amount needed to achieve the yield goal.
The importance of setting realistic yield goals as the basis for making both economically and environmentally sound recommendations has been highlighted many times (see, for example, Bock and Hergert [1991]; Peterson and Frye [1989]; University of Wisconsin-Extension and Wisconsin Department of Agriculture, Trade and Consumer Protection [1989]; U.S. Congress, Office of Technology Assessment [1990]). Setting realistic yield goals is particularly important for reducing residual nitrogen. An unrealistically high yield goal will result in nitrogen applications in excess of that needed for the yield actually achieved and will contribute to the mass of residual nitrogen in the soil-crop system. (See Chapter 2 for more discussion of yield goals.)
The most reliable way to set yield goals is to base goals on historical yields, for example, during the past 5 years, actually achieved on a field-by-field basis. Use of a yield achieved under optimal weather conditions that lead to a bumper crop as the goal will lead to the overapplication of nitrogen during most years. This practice increases production costs and residual nitrogen; in addition, many soils, except those low in organic matter, may supply the added nitrogen needed during a bumper crop year because the warm and moist conditions that lead to a bumper crop also increase the amount of nitrogen mineralized from soil organic matter (Schepers and Mosier, 1991).
Another part of the problem is that some producers set yield goals for
their whole-farm rather than for each field and often fertilize each field similarly. Not only must yield goals be set realistically but, to optimize management, they should also be set on a field-by-field and preferably a soil-by-soil basis (Carr et al., 1991; Larson and Robert, 1991).
Synchronizing Applications with Crop Needs
The need to improve nitrogen management by synchronizing applications with periods of crop growth has been often highlighted (see, for example, Ferguson et al. [1991]; Jokela and Randall [1989]; Peterson and Frye [1989]; Randall [1984]; Russelle and Hargrove [1989]; University of Wisconsin-Extension and Wisconsin Department of Agriculture, Trade and Consumer Protection [1989]; U.S. Congress, Office of Technology Assessment [1990]).
Nitrogen is needed most during the period when the crop is actively growing. Nitrogen applied before that time is vulnerable to loss through leaching or subsurface flow because of the mobility of nitrates in the soil system. Larger applications of nitrogen are generally used if nitrogen is applied in the fall, in particular, to make up for the nitrogen that is lost or that becomes unavailable in the soil during the period between application and crop growth. However, timed or multiple applications must be carefully evaluated for their economic and environmental efficacy. Simply increasing the number of applications presuming that this will improve crop uptake efficiency may ignore many other factors that affect crop growth (Killorn and Zourarakis, 1992; Timmons and Baker, 1991).
Production and environmental advantages to simple changes in timing of application may be climate and site-specific. When timing is coupled with new tools, such as the presidedress soil nitrate test, to gauge the amount of nitrogen available, and hence the additional amount actually needed, significant economic and environmental benefits may be possible.
New Tools for Nitrogen Management
New tools and management methods are needed to accurately assess available residual nitrogen and to reduce the producer's uncertainty in estimating a crop's nitrogen needs. As discussed, typical soil test methods are inadequate. In practice, nitrogen recommendations rely on evaluating general soil types and using the state's (extension-experiment station) recommended rate for a given yield goal for the soil types in that region. This approach, in part, has led to the blanket nitrogen applications that are part of the current problems and inefficiencies.
Practical and accurate soil and plant testing methods that allow refined assessment of crop nitrogen needs, in relation to the nitrogen available (through soil mineralization, available residual, rotation, and manure additions) in a particular growing season, are needed to reduce the uncertainty and risk involved with nitrogen fertilizer applications.
Various plant and tissue tests, such as petiole testing for potato (Wescott et al., 1991), have proved valuable to more efficient nitrogen management for high value vegetable and citrus crops. Such methods must be refined and implemented for the major row crops, such as corn, that consume the majority of nitrogen applied to croplands. Many methods are being tested across the Corn Belt (see, for example, Binford et al., 1992; Binford and Blackmer, 1993; Blackmer et al., 1989; Cerrato and Blackmer, 1991; Fox et al., 1989; Magdoff, 1991a; Meisinger et al., 1992; Motavelli et al., 1992; Piekielek and Fox, 1992; Roth et al., 1992; Tennessee Valley Authority, National Fertilizer Development Center, 1989). One of the methods showing promise is the presidedress soil nitrate test (PSNT). The soil testing is done at a specified time after crop emergence and measures the amount of nitrate-N available in the upper 0.3 to 0.6 m (1 to 2 feet) of the soil profile. The PSNT provides a measure of whether or not supplemental nitrogen is actually needed given the estimate of nitrogen that is already available to the crop. In a project to implement and evaluate the PSNT with fertilizer dealers in Iowa, replicated on-farm trials produced equivalent crop yields but reduced nitrogen applications an average of 42 percent using the PSNT to refine nitrogen applications. The test saved money for producers and significantly reduced environmental loading of nitrogen (Blackmer and Morris, 1992; Hallberg et al., 1991).
Implementation of soil or tissue tests requires that producers sidedress a significant portion of their nitrogen. Few producers, however, currently sidedress their nitrogen applications. Further work is needed on an early spring test that might be useable for preplant applications. In this regard, development of monitoring and modeling systems to help estimate nitrogen availability from the soil and annual carryover, related to climatic, soil, and crop conditions are also needed. Such systems could help to provide forecasts to producers about carryover and availability for them to consider in their annual nutrient and fertilizer application plans.
Obstacles to Better Nitrogen Management
The measures described above, if implemented, would greatly improve the efficiency with which nitrogen is now used in current
cropping systems. Many of these measures could be implemented immediately; others require the development of refined tools such as better soil tests or improved crop response models. In the short-term, efforts to improve nitrogen management in current cropping systems should be the priority and should have the potential to result in immediate gains in both economic and environmental performance.
In the long-term, however, it is unclear whether such improvements in nitrogen management alone will be sufficient to reduce nitrogen loadings to levels where damages are acceptable. There are elements of the nitrogen problem that suggest that, in the long-term, changes in cropping systems that will allow producers to capture more of the available nitrogen may be necessary to adequately reduce nitrogen loadings to surface water and groundwater in some environments.
Economic Obstacles
Producers face a management dilemma because the effectiveness and the efficiency of nitrogen management cannot be assessed, economically or environmentally, until the growing season is over. A crop that produces poor yields because of inclement weather will result in poor nitrogen use efficiency and uptake, potentially leaving large amounts of nitrogen to be lost to the environment, no matter how carefully a management plan was designed. Since producers must make nitrogen applications without being able to predict weather and crop yields, the potential for being wrong is always present and will always occur in some years. Current recommendations of crop nitrogen needs are based on long-term assessments designed to average the many sources of variance in the nitrogen-yield response. This method also averages the recoveries of residual nitrogen carried over from a previous year or the greater amounts that may be mineralized and available under optimal climatic conditions.
In addition, the nature of the crop response to nitrogen and its resulting effect on the economically optimal rate of nitrogen application also constrain the extent to which improvements in nitrogen management alone may reduce nitrogen losses from current cropping systems.
The first stage in current management is to establish the nitrogen requirements of a crop under various soil and climatic conditions. Figure 6-3 shows the yield response of corn to nitrogen for various soils under continuous corn, and Figure 6-4 shows the nitrogen-yield response for corn for three crop rotations on the same soils. The relationships in Figures 6-3 and 6-4 illustrate the benefits of nitrogen fertilization, up to a certain point, in increasing crop yield, particularly in continuous corn.
Figure 6-4 also illustrates the need for less supplemental nitrogen in crop rotations with legumes; there is no yield benefit to nitrogen use following alfalfa. Figure 6-3 illustrates the inherent variability among soils in their capacity to supply nitrogen from mineralization. These factors vary not only among soils and cropping systems but from year to year as well. Figure 6-5 reexamines the relative efficiencies of the typical nitrogen-yield response relationship from the data in Figure 6-4. The nature of the relationship between the nitrogen application rate and
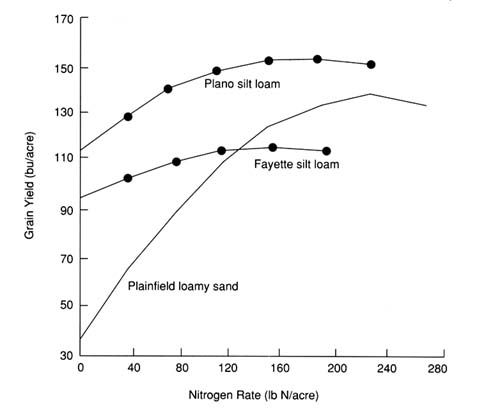
FIGURE 6-3 Yield response of corn to nitrogen applied to three soils. Fayette silt, Fayette silt loam (fine-silty, mixed, mesic Typic Hapludalfs); Plano silt, Plano silt loam (fine-silty, mixed, mesic Typic Argiudolls); and Plainfield ls, Plainfield loamy sand (mixed, mesic Typic Udipsamments). Source: S. L. Oberle and D. R. Keeney. 1990. A case for agricultural systems research. Journal of Environmental Quality 20:4–7. Reprinted with permission from © American Society for Agronomy, Crop Science Society of America, and Soil Science Society of America.
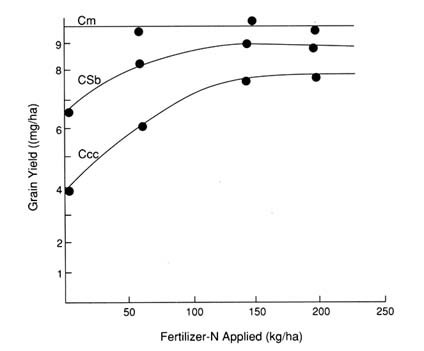
FIGURE 6-4 Yield response of corn to fertilizer for three crop rotations. Ccc, continuous corn; CSb, corn-soybeans-(corn oats); Cm, corn-oats-meadow-meadow (meadow-alfalfa brome mix). Source: Adapted from A. M. Blackmer. 1984. Losses of fertilizer N from soil. Report No. CE-2081, Ames, Iowa: Iowa State University, Cooperative Extension Service.; A. M. Blackmer. 1986. Potential yield response of corn to treatments that conserve fertilizer-N in soil. Agronomy Journal 78:571–575; and J. R. Webb. 1982. Rotation-fertility experiment. Pp. 16–18 in Annual Progress Report Northwest Research Center. Ames, Iowa: Iowa State University.
yield for continuous corn illustrates that, at some point, additional increments of nitrogen application become less efficient. For every additional kilogram of nitrogen applied, less grain is produced, and hence, less of that increment of nitrogen is taken up by the plant. This result is illustrated by the shaded area and dashed lines in Figure 6-5. As the rate of nitrogen application increases, less is recovered in the harvested grain (or in plant residues) and more nitrogen remains as residual nitrogen, potentially to be lost into the environment.
The shaded areas in Figure 6-5 represent a range of values, for perspective. The apparent nitrogen recovery is calculated from the grain yield of a particular increment on the continuous corn yield curve, using
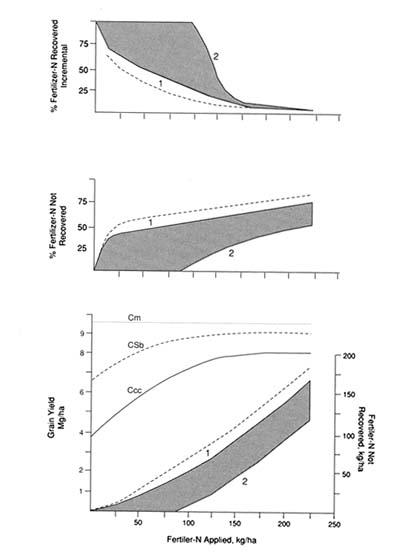
FIGURE 6-5 Nitrogen recovery related to fertilization rate. FN, fertilizer-N; Ccc, continuous corn; CSb, corn-soybeans-(corn-oats); Cm, corn-oats-(meadow-alfalfa brome mix). Source: Adapted from A. M. Blackmer. 1984. Losses of fertilizer-N from soil. Report No. CE-2081, Ames, Iowa: Iowa State University, Cooperative Extension Service.; A. M. Blackmer. 1986. Potential yield response of corn to treatments that conserve fertilizer-N in soils. Agronomy Journal 78:571–575; and J. R. Webb. 1982. Rotation-fertility experiment. Pp. 16–18 in Annual Progress Report Northwest Research Center. Ames, Iowa: Iowa State University.
various standard assumptions. The first assumption is that the grain contains 1.5 percent nitrogen (and weighs 25 kg/ha [56 lb/bu]); the second assumption is that the corn plant requires 0.54 kg of nitrogen per kg of grain (1.2 lb/bu) produced, and the nitrogen is proportioned at 60 percent nitrogen into the grain and 40 percent into the stover. These and the other assumptions given below provide a set of curves enclosed by the shaded envelopes in Figure 6-5. The upper boundary (line 1 of the shaded areas), indicating the lower recovery of fertilizer-N for a given fertilizer application rate, was estimated by subtracting the nitrogen recovered by the unfertilized corn (yield, about 4 metric tons/ha [64 bu/acre]) from the total nitrogen recovered for a given fertilizer application rate. The nitrogen recovered by the unfertilized corn provides a measure of the average amount of nitrogen provided from the soil system (mineralization, including crop residues, and precipitation). The lower boundary provides a conservative estimate that is based on the total amount of nitrogen recovered in the grain but uncorrected for yields from unfertilized areas. The dashed lines (near the line 1 boundary in Figure 6-5) show the upper bound estimated from the corn yields in the corn-soybean rotation.
The values for the incremental fertilizer recovery illustrate how fertilizer-N recovery declines rapidly as the crop approaches optimum and maximum yields. At the maximum yield, recovery effectively reaches zero; at the economically optimum yield, recovery of the last increment of fertilizer-N is less than 10 percent. Even under the more conservative second assumption, less than 50 percent of fertilizer-N is recovered at the economically optimum yield for continuous corn.
Hence, even with economically optimum yields, there is considerable potential for nitrogen losses into the environment. Because of the form of the nitrogen-yield response, the potential for nitrogen losses is very sensitive at high nitrogen application rates when plant uptake of nitrogen is limited. Decreasing the economically optimum yield goal by 5 percent reduces the unrecovered fertilizer-N by about 20 to 30 percent for the continuous corn and reduces the unrecovered amount even more for the corn-soybean rotation. Attempts to push for a last small yield increment can greatly contribute to nitrogen losses. The fate of this nitrogen can follow many paths in the nitrogen cycle; some is immobilized, but other portions may be leached into groundwater or otherwise lost.
Seasonal Obstacles
In addition to the economic incentives, elements of nitrogen dynamics in the soil-crop system may constrain the gains from improved management of nitrogen inputs alone.
The application of nitrogen in the spring is followed by immobilization of nitrogen by plants and microbes in the spring and summer. This immobilization period is followed by mineralization of the nitrogen from plant and microbial tissues in the fall. The seasonal dynamics are such that nitrate levels in the soil are very low during the late summer and early fall (Boone, 1990; Magdoff, 1991b). Following harvest, crop residues, root tissues, and microbial cells begin to mineralize and nitrify, often leading to high soil nitrate concentrations that are susceptible to loss through leaching or runoff during the fall, winter, and spring (Gold et al., 1990). Thus, the nitrate that is lost from cropping systems is not simply nitrogen that has not been used by the crop but includes nitrogen that has been cycled through plant and microbial tissues during the growing season.
Fine-tuning nitrogen input management will reduce losses of nitrogen but may not provide sufficient reductions in nitrate losses from mineralization of crop residues, root material, and microbial cells following harvest. In some settings, the only way to manage this residual nitrogen may be to keep it tied up in plant or microbial tissues by preventing mineralization or to provide a sink for this nitrogen in plants or microbes once it is mineralized. Mineralization can be inhibited by controlling the substrate quality of the residue (for example, residues with a high carbon-to-nitrogen ratio do not release much nitrogen). Use of cover crops or relay crops to take up the nitrogen mineralized following harvest is a mechanism for storing nitrogen in plants. In many environments, it is likely that techniques for managing residual nitrogen will need to be used along with refined input management, or nitrate losses may remain unacceptably high.
Cropping Systems as a Nitrogen Management Tool
The development of cropping systems that prevent the buildup of residual nitrogen during the dormant season has been a focus of research in the past 10 years. The major emphasis has been on the use of cover crops planted after crop harvest (for reviews, see Hargrove, 1988, 1991). Although cover crop techniques have demonstrated abilities to reduce erosion, surface runoff, and leaching into groundwater, several problems limit their widespread use and effectiveness. Langdale and colleagues (1991) report that the cover cropping systems are better developed in the southeastern United States than in other parts of the country and that because of the fragmentation of research efforts and the short-term economic policy structure of the U.S. agricultural system, cover crop use in other regions is prohibitive. The drawbacks and
concerns associated with cover crop use include depletion of soil water by cover crops, slow release of the nutrients contained in cover crop biomass, and difficulties in establishing and killing cover crops, especially in northern areas of the United States (Frye et al., 1988; Lal et al., 1991; Wagger and Mengel, 1988).
Several aspects of the effects of cover crops on total crop system function are poorly understood. Cover cropping changes organic matter pools and microbial nutrient cycling patterns, affecting crop nutrient uptake and fertilizer use efficiency. It likely takes several years for these changes to stabilize and create a new equilibrium of organic matter and nutrient dynamics in soil (Doran and Smith, 1991). More important, the fate of the nutrients absorbed by subsequent cover crops is not clear. Studies with isotopically labeled nitrogen, as well as more conventional nitrogen budget studies, have shown that less than 50 percent of the nitrogen contained in cover crop tissues is absorbed by subsequent crops (Ladd et al., 1983; M. S. Smith et al., 1987; Varco et al., 1989). In many cases, recovery of cover crop nitrogen has been found to be lower than recovery of fertilizer-N (Doran and Smith, 1991). It is critical to determine whether cover crops continually recycle the nitrogen that they absorb or whether they merely act as a temporary sink for the residual nitrogen that ultimately ends up in groundwater or surface water.


