2020 Census Data Products: Demographic and Housing Characteristics File: Proceedings of a Workshop (2023)
Chapter: 5 Evaluation of the Demonstration Data on Housing and Tenure
5
Evaluation of the Demonstration Data on Housing and Tenure
HOUSEHOLD COMPOSITION
Rachel Cortes (Claritas) with co-author Ken Hodges presented a paper in “Use Cases Part II.” She stated that Claritas is a private company that builds nationwide demographic estimates and projections at the block group level, and it relies on Census Bureau data from the decennial census and the American Community Survey to choose inputs and benchmarks when it creates its estimates. Claritas began evaluating these projects beginning with the first release of demonstration data and the 2019 workshop. The most troubling feature Claritas and others found was inconsistency between population and household files. Cortes offered examples such as “improbable and impossible” values for household size, as well as areas with households but no population. For the Public Law 94-171 file, they “made peace with the fact there will be some improbable values.”
Cortes explained that the most important input that Claritas uses from the decennial census data is the cross-tabulation of age and sex. When comparing the Summary File 1 (SF1) with differential privacy products, she stated that she and Hodges calculated an index of dissimilarity that has shown improvement since 2019: the mean index of dissimilarity in 2019 was 35.4, and it is now 8.9.
Another important component from the Demographic and Housing Characteristics (DHC) file is householders by age, which enables a calculation of household income by age that can be used for marketing research. Claritas calculated the component of householders by age for nine age categories. Table 5-1 shows the block group mean percent of the population
| Age | DP | SF1 |
|---|---|---|
| 15–24 | 12.7 | 11.9 |
| 25–34 | 44.2 | 42.3 |
| 35–44 | 53.7 | 52.3 |
| 45–54 | 57.0 | 56.1 |
| 55–59 | 61.2 | 59.4 |
| 60–64 | 65.1 | 60.4 |
| 65–74 | 66.1 | 62.9 |
| 75–84 | 73.3 | 66.9 |
| 85+ | 87.7 | 67.3 |
NOTE: DHC = Demographic and Household Characteristics File; DP = differential privacy; SF1 = Summary File 1.
SOURCE: Adapted from Rachel Cortes workshop presentation, June 21, 2022.
of householders. In an analysis of percent of householders from the differentially privatized file compared with that of the SF1 file, the former shows higher householder categories, especially for older age groups. For example, 67.3 percent of individuals 85 and older were householders in the SF1 file, compared with 87.7 percent in the differentially privatized demonstration data.
When looking at block groups, Cortes discussed assessing the difference between the ratio of the householder rate in the differentially privatized data and SF1. These rates were calculated from the differentially privatized demonstration data from those measured in the SF1 data and taking the absolute mean difference, so negative and positive differences would not offset each other. As Table 5-2 shows, the mean difference for each age category increases as age increases.
Cortes also discussed initial analysis for householders by race and ethnicity for 14 categories (seven races by Hispanic or non-Hispanic). Although this analysis is still ongoing, she stated that early findings suggest that these data look worse than age of householder. Table 5-3 shows that the SF1 data had no inconsistencies at the block group level, while 60.7 percent of block groups had at least one race/ethnicity with more householders than the population in that group.
Cortes concluded by noting that DHC variables that combine population and householders are important to their work. While Claritas looks forward to receiving the final product, it is bracing for what it will find and what it will need to do to deal with these data.
TABLE 5-2 Mean Absolute Difference for DP Ratio vs. SF1 Ratio
| Age | N | Mean |
|---|---|---|
| 15–24 | 216,614 | 3.47 |
| 25–34 | 216,616 | 6.69 |
| 35–44 | 216,553 | 7.00 |
| 45–54 | 216,536 | 6.48 |
| 55–59 | 216,252 | 11.40 |
| 60–64 | 216,108 | 14.77 |
| 65–74 | 216,055 | 12.12 |
| 75–84 | 215,375 | 18.20 |
| 85+ | 210,631 | 39.24 |
NOTE: DP = differential privacy; SF1 = Summary File 1.
SOURCE: Rachel Cortes workshop presentation, June 21, 2022.
| N | DP | SF1 | ||
|---|---|---|---|---|
| 0 | 66,667.0 | 30.3 | 220,334.0 | 0.0 |
| 1 | 71,493.0 | 32.4 | 0.0 | 0.0 |
| 2 | 45,111.0 | 20.5 | 0.0 | 0.0 |
| 3 | 21,897.0 | 9.9 | 0.0 | 0.0 |
| 4 | 9,470.0 | 4.3 | 0.0 | 0.0 |
| 5 | 3,710.0 | 1.7 | 0.0 | 0.0 |
| 6 | 1,349.0 | 0.6 | 0.0 | 0.0 |
| 7 | 463.0 | 0.2 | 0.0 | 0.0 |
| 8 | 140.0 | 0.1 | 0.0 | 0.0 |
| 9 | 27.0 | 0.0 | 0.0 | 0.0 |
| 10 | 7.0 | 0.0 | 0.0 | 0.0 |
| 11–14 | 0.0 | 0.0 | 0.0 | 0.0 |
| Total | 220,334.0 | 100.0 | 220,334.0 | 0.0 |
NOTE: DP = differential privacy; SF1 = Summary File 1.
SOURCE: Adapted from Rachel Cortes workshop presentation, June 21, 2022.
HOUSING TENURE
Leslie Reynolds (Cornell University), with co-author Jan Vink, introduced her presentation, noting that she would be discussing types of housing tenure and how producing these data differentially impacted their accuracy. She stated that homeownership disparities are known: one is more likely to own a home if they are White, married, or generally privileged in society. Consequently, Reynolds emphasized that having inaccurate data in these situations would likely produce disparities and further inequities. Because natural clustering occurs among people who either rent or own their homes, Reynolds asserted that these areas do not necessarily fit within the TopDown Algorithm (TDA) of differential privacy.
Three research questions guided her analysis:
- Does the TDA impact the comparisons between aggregate groups (e.g., state, county, and national levels)?
- Does the TDA differentially impact accuracy within tenure groups?
- Does aggregation level matter for the accuracy of the tenure areas?
Reynolds stated that she used 2010 SF1 and 2010 DHC demonstration data retrieved from IPUMS. The analysis excluded Puerto Rico and tracts with fewer than 200 households. In addition to all tracts in the United States, all tracts in New York State, Monroe County (Rochester), and Onondaga County (Syracuse) were analyzed. The analytical variable was dominant tenure tract: Owned-majority area was defined as greater than or equal to 80 percent owned households in a tract. Rental-majority area was defined as less than or equal to 20 percent households owned. Reynolds stated that the metrics of interest were bias (mean error), accuracy (mean algebraic percent error [MALPE] and median absolute percent error [MdAPE]), and precision or usability. Precision was defined as having a mean error and MdAPE greater than or equal to 10.
Reynolds noted that without separation by tenure count discrepancies between the files are slight for housing units. Large households had the highest MALPE: five percent (see Table 5-4). Reynolds stated that these areas are most likely to include members of underserved populations, such as people of color, younger people, and those with lower incomes.
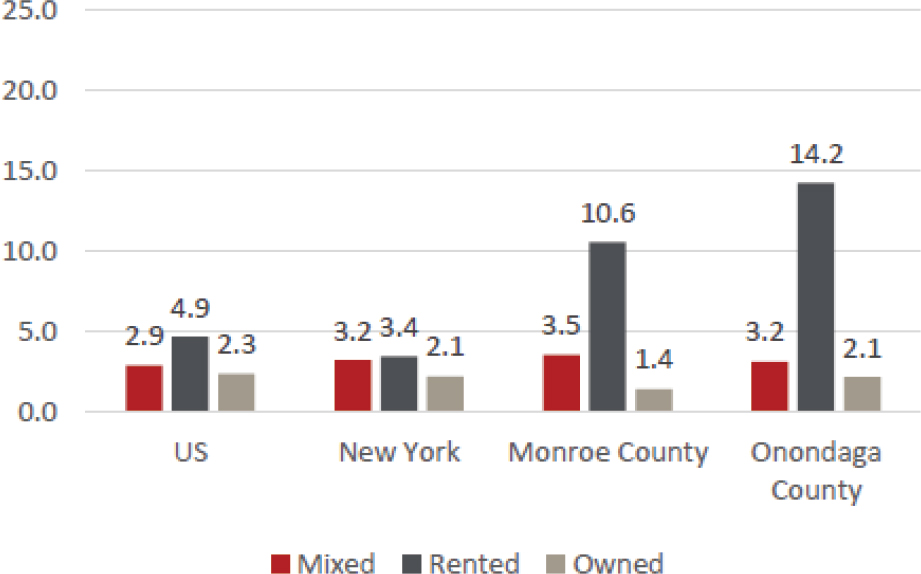
The degree of error was larger in the rental-majority areas versus owned-majority or mixed areas. Reynolds stated that the maximum degree of error was 11, found in Onondaga County for households with children in rented-majority areas (see Table 5-5). When focusing on households with children, Figure 5-1 shows that the MdAPE was largest for households in rented-majority areas and smallest in owned-majority areas. The minimum MdAPE was found in owned-majority areas of Monroe County (1.4%).
| Measures | Mean | |||
|---|---|---|---|---|
| DHC | SF1 | Error | % Error (MALPE) | |
| Households with children | 486.23 | 485.58 | 0.65 | 1.14 |
| Large households | 172.84 | 172.90 | –0.06 | 5.00 |
| Single-person households | 446.26 | 446.23 | 0.03 | 0.34 |
| Nonfamily households | 557.22 | 558.75 | –1.53 | 0.50 |
NOTE: DHC = Demographic and Housing Characteristics File; MALPE = mean algebraic percent error; SF1 = Summary File 1.
SOURCE: Leslie Reynolds and Jan Vink workshop presentation, June 22, 2022.
TABLE 5-5 Mean Error by Households with Children, Geographic Area, and Tenure Majority
| Geography | Mixed | Rented | Owned | |
|---|---|---|---|---|
| Nonfamily households | United States | –2.02* | –6.10* | –0.33* |
| New York State | –1.44* | –2.03* | –1.34* | |
| Monroe County | –1.98 | –6.92 | 0.58 | |
| Onondaga County | –0.67 | –10.79 | 0.54 | |
| Single-person households | United States | –0.01 | –1.93* | 0.38* |
| New York State | 0.11 | –0.38 | 0.01 | |
| Monroe County | 0.80 | –6.08 | 0.79 | |
| Onondaga County | 0.96 | –4.79* | 0.65 | |
| 5+ person households | United States | –0.14 | 2.56* | –0.01 |
| New York State | –0.16 | –1.67* | 1.27* | |
| Monroe County | –0.92 | 2.00 | –0.38 | |
| Onondaga County | –1.17 | 5.79 | –0.33 | |
| Households with children | United States | 0.69* | 6.08* | –1.86* |
| New York State | 0.69 | 2.77* | –0.73* | |
| Monroe County | –1.76 | 10.46 | –3.42* | |
| Onondaga County | –3.85 | 11.00 | –2.04 |
*Errors significantly different from zero.
SOURCE: Leslie Reynolds and Jan Vink workshop presentation, June 22, 2022.
SOURCE: Leslie Reynolds and Jan Vink workshop presentation, June 22, 2022.
Rental-majority areas had the most noticeable accuracy issues across all aggregate levels. The maximum MdAPE was found in rental-majority areas of Onondaga County (14.2%). Reynolds stated that the differences could be due to the privacy-loss budget and unintended allocations, which may change when the TDA is finalized, but disparities such as those shown for rental-majority areas are still problematic.
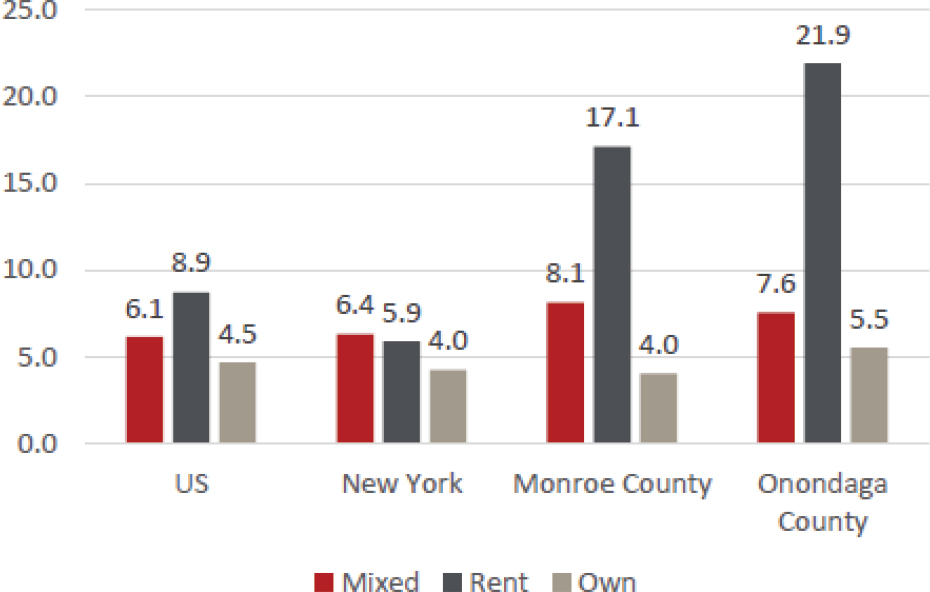
Even greater disparities are demonstrated in Figure 5-2 for inaccuracies reported for large households (defined as having five or more people). Owned-majority areas had the lowest MdAPE, with a minimum of four percent for owned-majority areas in New York State and Monroe County. Rental-majority areas in each aggregate level had the highest MdAPE, with the exception of mixed-tenure areas of New York State, which had an MdAPE of 6.4 percent. The maximum MdAPE was 21.9 percent for rental-majority areas of Onondaga County. When looking at precision across all tracts in the United States, the rental-majority areas were least precise and owner-majority areas were the most precise, as shown in Table 5-6.
Reynolds offered several conclusions. She cautioned that broad measures of similarity between SF1 and the demonstration data can be misleading. In her analysis, she found that tracts aggregated to substate levels generally produce the largest errors. When examining the metrics by tenure
SOURCE: Leslie Reynolds and Jan Vink workshop presentation, June 22, 2022.
TABLE 5-6 Share of Tracts in the United States with Large Errors
| Single-person HH | Nonfamily HH | 5+ person HH | HH with children | |
|---|---|---|---|---|
| Mixed | 2.6% | 3.2% | 26.8% | 7.2% |
| Rent | 5.2% | 7.0% | 36.8% | 27.4% |
| Own | 2.9% | 3.5% | 16.8% | 4.3% |
NOTE: HH = household.
SOURCE: Leslie Reynolds and Jan Vink workshop presentation, June 22, 2022.
majority, accuracy differences were revealed. Data on households in rental-majority areas tended to least accurately match the original 2010 SF1 data, and data on households in owned-majority areas most accurately matched the SF1. Reynolds also stated that measurement of households with children and large households in rental-majority areas contained the most bias and also had the lowest levels of precision. However, the issues of bias and accuracy were less prominent in the person files.
This page intentionally left blank.


