Quantitative Procedures for Designing and Operating Ferry Services (2023)
Chapter: Appendix B - Data Collection and Findings

APPENDIX B
Data Collection and Findings
The research team conducted data collection and analysis to support the findings in the report. As a part of this study, Arup developed a methodology and analytical framework to evaluate the passenger and system capacity of various ferry operators in California, Washington State, and New York. Data were collected through in-person site visits and through review of security camera footage to inform empirical data collection of passenger throughput, walk speed, ramp length, ramp slope, ramp width, loading operations (bow versus side loading) docking procedure duration, and onload/offload durations. Data were compiled and analyzed using PowerBI.
Capacity Constraint Points Observed
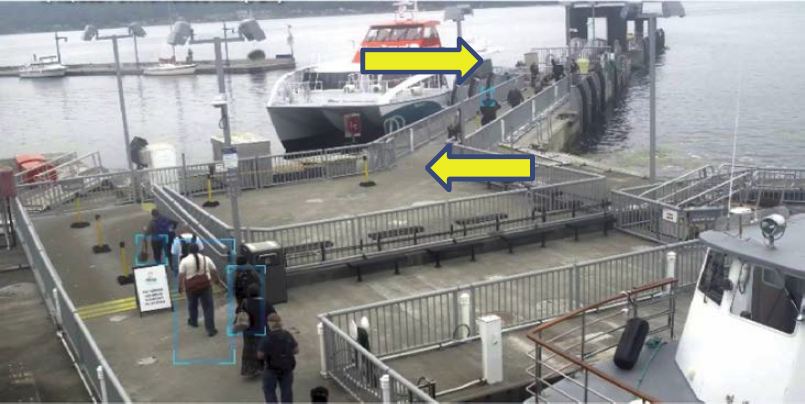
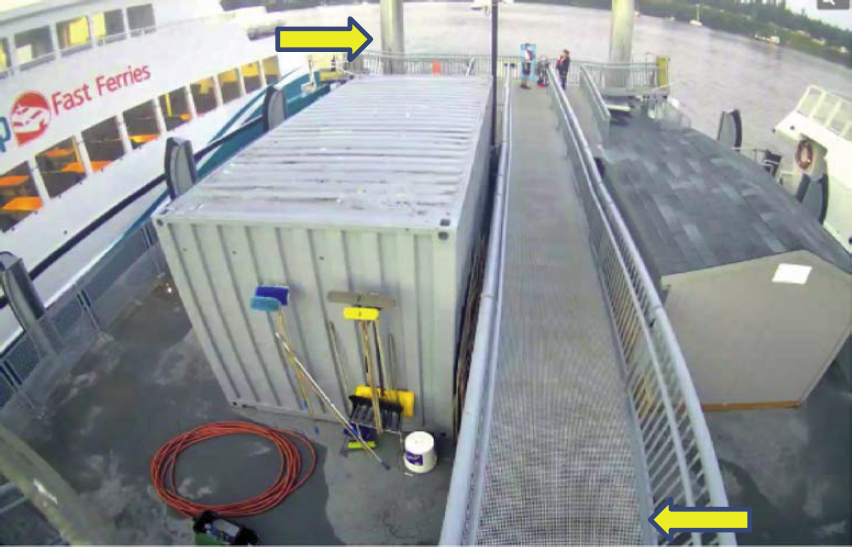
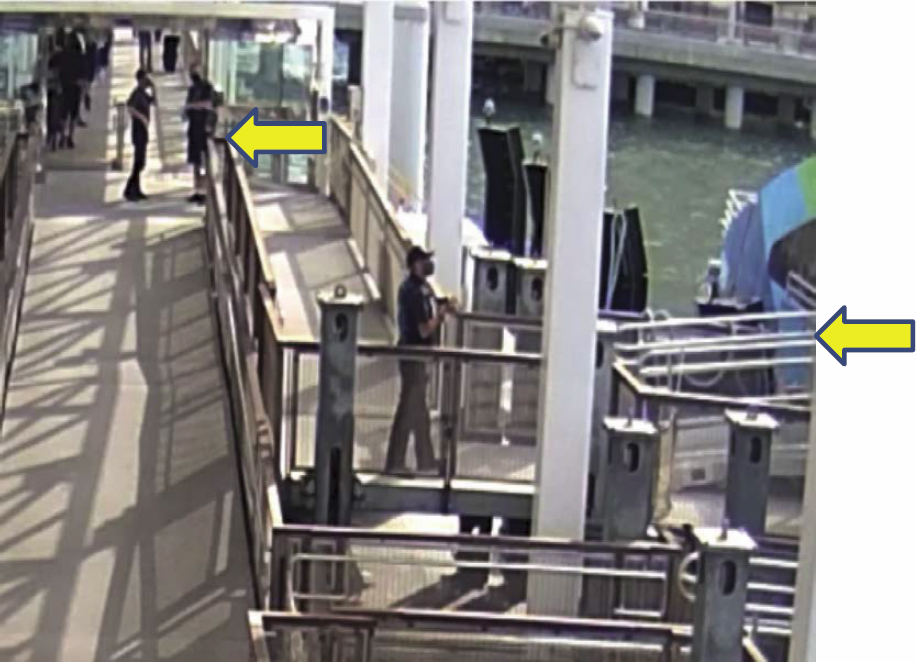
The ferry terminals for Kitsap Fast Ferries, New York City Ferry, and San Francisco Bay Ferries were evaluated as a part of this empirical data collection and analysis exercise. During observations at each terminal, the research team identified the capacity constraint points (the points at which passenger flow slowed or queues occurred).
Kitsap Fast Ferries
For the Kitsap Fast Ferries, the key capacity constraint point was located where fares were collected before entering the final gangway ramp end embarking the vessel.
Bremerton Ferry Terminal
Seattle Pier 50
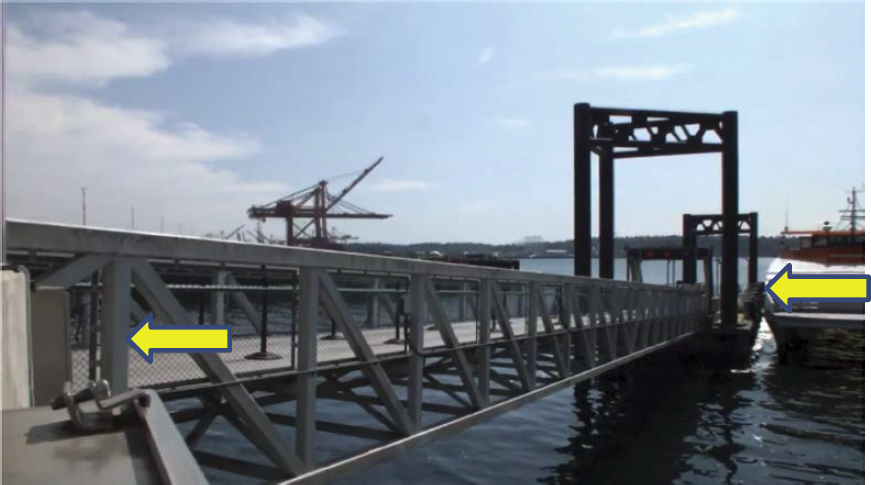
Kingston Ferry Terminal
New York City Ferry
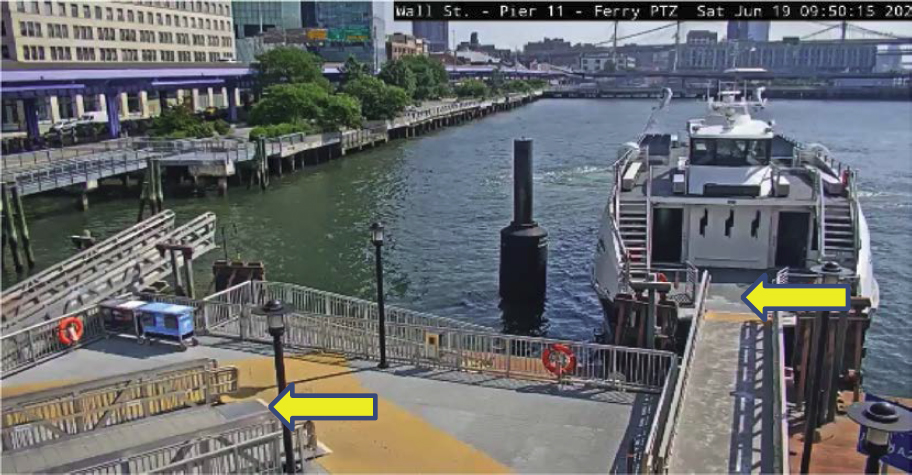
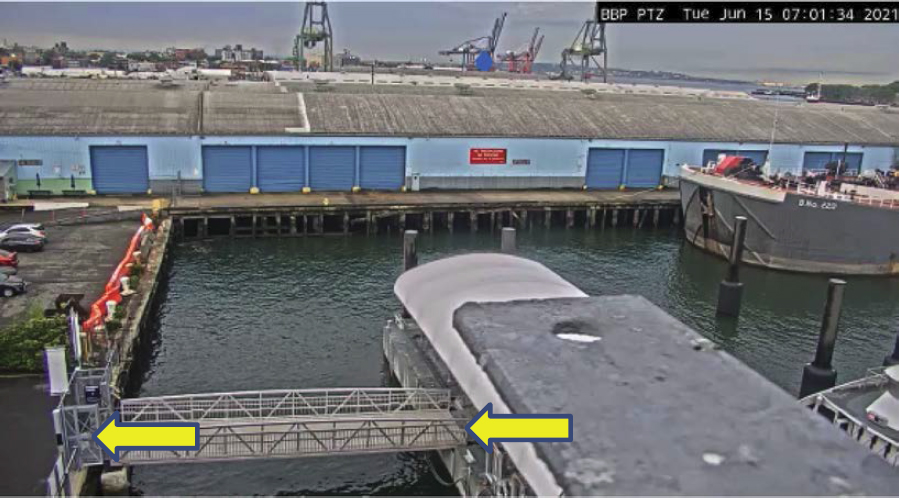
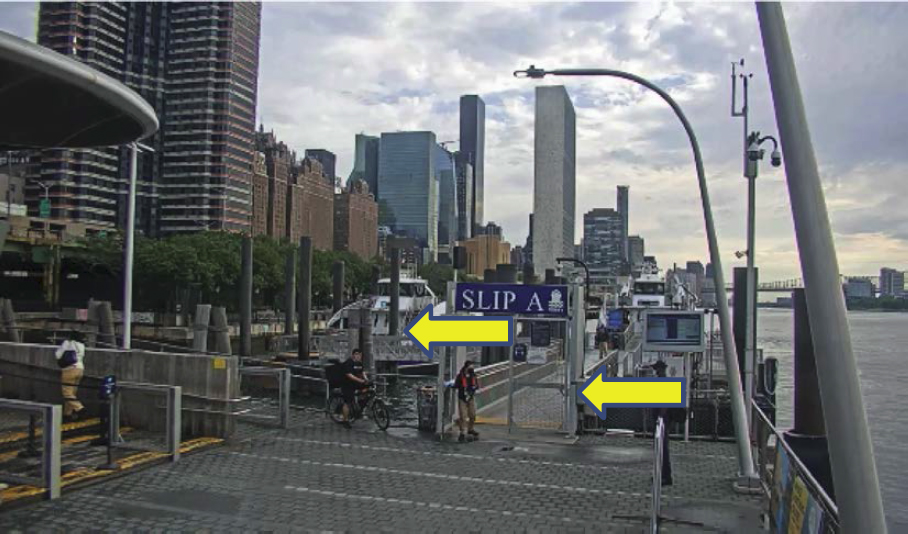
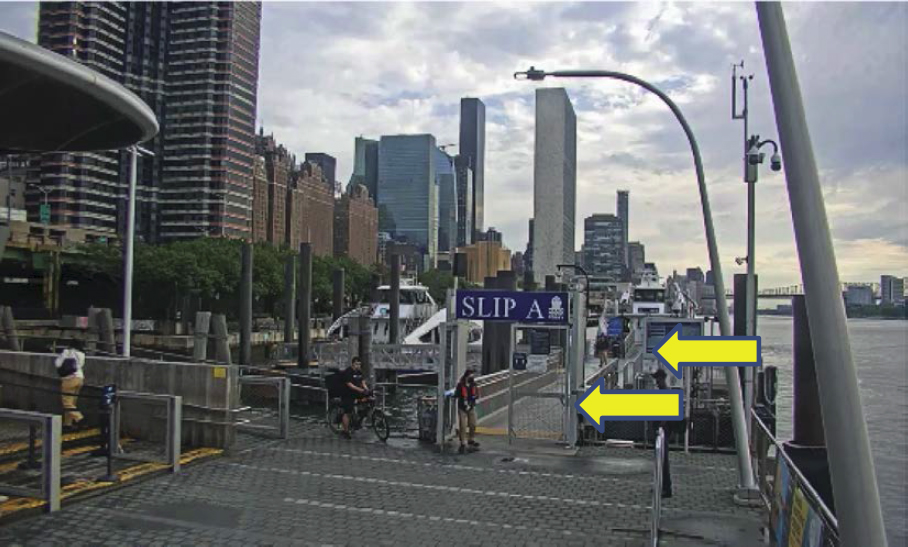
For New York City Ferry, the key capacity constraint point observed was the holding gate before entering the gangway ramp to board the vessel.
Wall Street/Pier 11 A
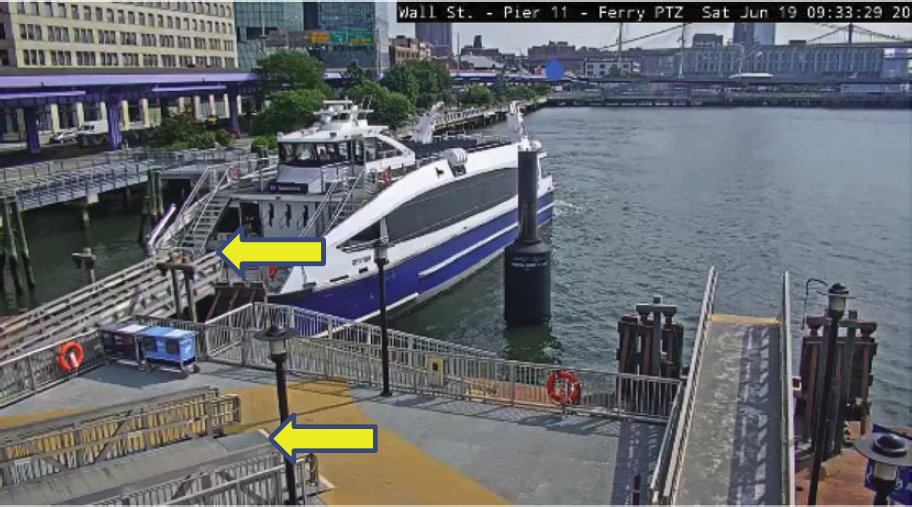
Wall Street/Pier 11 B
Brooklyn Bridge Park/Pier 6
East 34th Street Terminal A
East 34th Street Terminal B
San Francisco Bay Ferries
Alameda Ferry Terminal
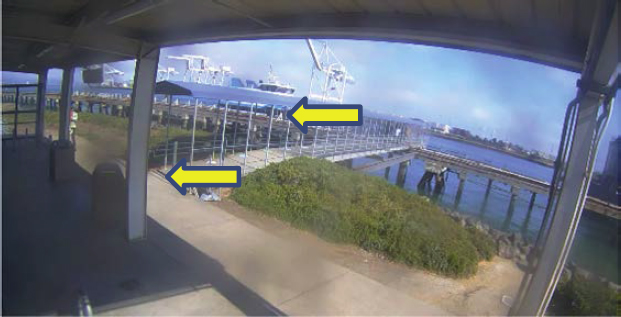
Oakland/Jack London Square
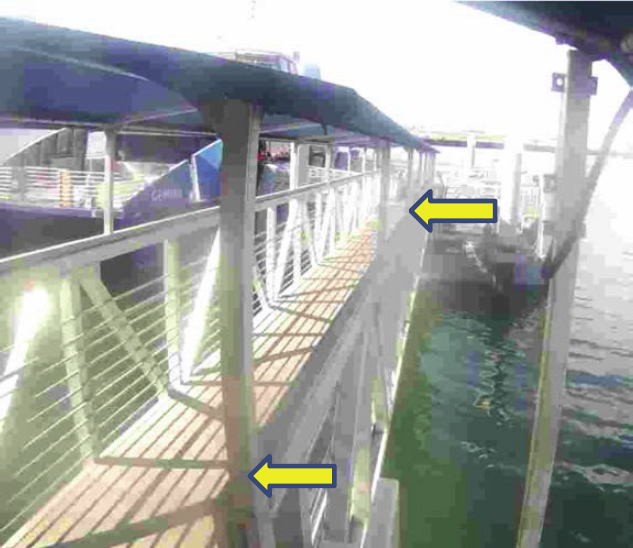
San Francisco Ferry Building Gate E
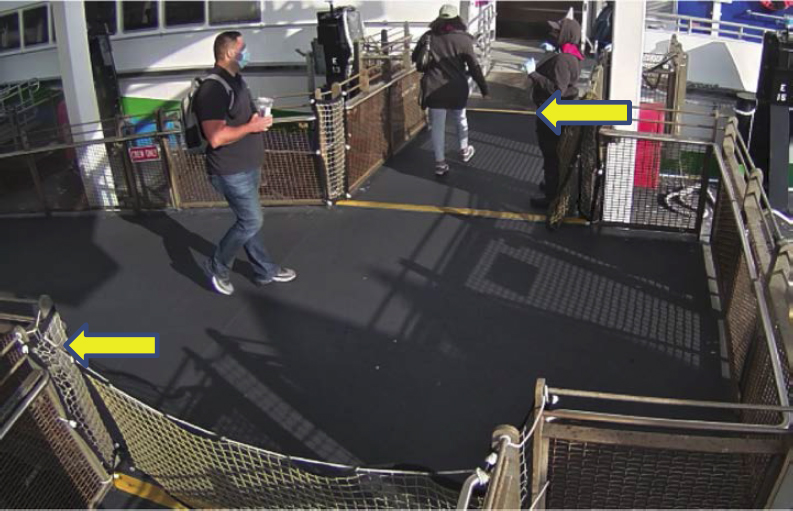
San Francisco Ferry Building Gate F
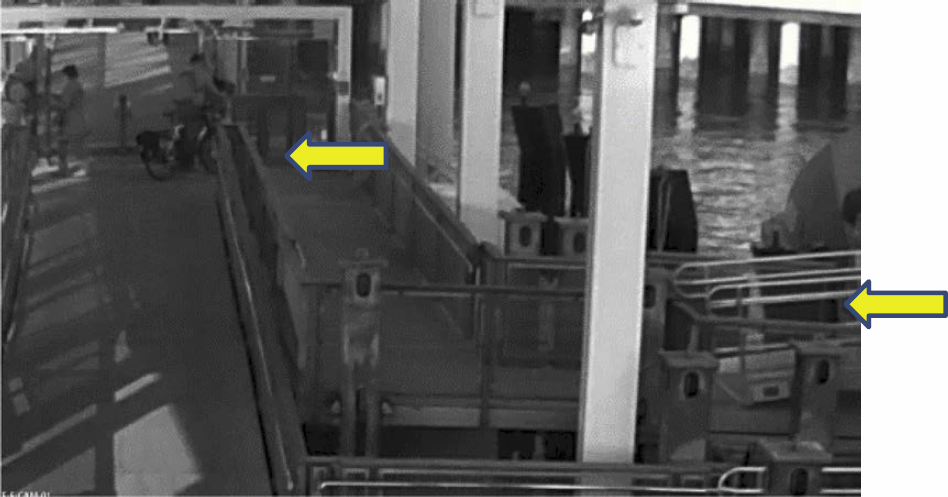
San Francisco Ferry Building Gate G
Data Collection
Using in-person observations and review of security footage, researchers recorded the number of passengers boarding sailings and how long the vessel was in the dock. From this information, the researchers calculated the average walk speed and average number of passengers per minute. The gangway dimensions, including the length and width, were obtained along with the corresponding high and low tidal data for the service day. From this information, the researchers calculated the gangway slopes at low and high tide.
Data Limitations
Data were collected in July 2021 at a time when regional transit ridership varied between Seattle, the San Francisco Bay Area, and New York City. Relative busyness depended on the ferry terminal studied and was inconsistent across operators and specific gates. For example, San Francisco Ferry Building Gate E, with ferry service from San Francisco to Vallejo and Richmond, experienced more passenger volume compared to Gates F or G. Although data observations do not reflect capacity conditions, data collection supported the research team’s findings related to ramp slope and width, and secondary findings related to bow- versus side-loading operations. Further data collection, including passenger flows during at-capacity terminal conditions and passenger flows during a range of ramp slopes resulting from tidal conditions, is identified as a gap for further research and included in Table 25.
Table 25. Data collection table.
| Terminal | High Tide (ft) | Low Tide (ft) | Gangway Low-Tide Slope | Gangway High-Tide Slope | Gangway Width (ft) | Gangway Length Observed (ft) | Average Walk Speed (ft per sec.) | Average Passengers Per Minute | Docking Duration (min.) |
|---|---|---|---|---|---|---|---|---|---|
| Kitsap - Bremerton | 9.48 | –1.29 | –3% | 2% | 6 | 95 | 1.8 | 14 | 8 |
| Kitsap – Pier 50 | 8.96 | 1.23 | –5% | 1% | 11 | 130 | 7.6 | 12 | 12 |
| Kitsap – Kingston | 9.05 | –1.54 | –10% | 3% | 5 | 104 | 3.91 | 13 | 9 |
| NYC – Wall Street Pier 11 A | 4.67 | 0.25 | –12% | –1% | 7 | 58 | 3.46 | 41 | 4 |
| NYC – Wall Street Pier 11 B | 4.67 | 0.25 | –12% | –1% | 7 | 56 | 3.97 | 41 | 4 |
| NYC – Pier 6 | 4.67 | 0.25 | –6% | 0% | 11 | 46 | 3.42 | 16 | 3 |
| NYC – East 34th St A | 4.67 | 0.25 | –10% | –1% | 7 | 130 | 4.51 | 24 | 4 |
| NYC – East 34th St B | 4.67 | 0.25 | –10% | –1% | 7 | 108 | 4.35 | 24 | 4 |
| WETA – Alameda | 5.62 | –0.61 | –8% | –1% | 9 | 35 | 3.96 | 10 | 11 |
| WETA – Oakland | 5.62 | –0.61 | –10% | 0% | 8 | 53 | 6.8 | 12 | 11 |
| WETA – SF Gate E* | 4.95 | –0.61 | –2% | 3% | 6 | 15 | 3.07 | 27 | 18 |
| WETA – SF Gate F* | 4.95 | –0.61 | –2% | 3% | 6 | 35 | 3.74 | 42 | 7 |
| WETA – SF Gate G* | 4.95 | –0.61 | –2% | 3% | 6 | 35 | 2.27 | 38 | 12 |
* All observed ferry service at San Francisco Ferry Building Gates E, F, and G was operated with single-door loading instead of two-door loading due to COVID-19 demand conditions.
Findings
Findings from this empirical data collection and analysis indicate that:
- There are insignificant differences in passenger throughput related to marginal increases in door width (from about 5 ft to 7 ft), but larger increases in throughput (roughly double) can be achieved by doubling the width of the doors.
- The passenger-only ferry systems observed that operate with bow-loading vessels had faster throughput compared to ferry systems using side-loading vessels, with a 25%–30% increase in reasonable expectations. However, the efficiencies are mostly the result of shorter passenger circulation distances, which allow passengers to board faster (e.g., shorter pedestrian travel times along their path of travel). The difference in embarking times for the observed bow-loading vessel and side-loading vessel are provided in Table 26.
Table 26. Embarking comparison between observed bow and side loading vessels.
Bow-Loading Side-Loading 30 passengers/min embarking 25 passengers/min. embarking 1:03 min. average embarking duration 3:35 min. average embarking duration 1 min. median embarking duration 3 min. median embarking duration 3.8 ft/sec. average walk speed 4.4 ft/sec. average walk speed - There are insignificant differences in passenger throughput related to slope of ramps or gangways.
- Estimates from previously developed spreadsheet-based model for Transit Capacity and Quality of Service Manual are consistent with site observations and review of security footage.
Path of Travel Considerations and Capacity Constraints
The path of travel is between two points of passenger ingress from land to the ferry. Core steps along this path of travel are (1) entering float ramp or initial gangway, (2) hold area gate, (3) fare collection, and (4) enter vessel.

Each core step along the path of travel could be a capacity constraint. The researchers observed that the key capacity constraint is located at the point of fare collection. To mitigate capacity constraints along the path of travel, the researchers recommend the following (in prioritized order):
- Collecting fares earlier along the path of travel and directing passengers to a separate hold area after fare collection would allow passengers to walk directly onto the ramp to enter the vessel. The passenger travel time after fare collection is dependent on the length of the ramp (how far passengers must walk) and the average walk speed (how fast passengers walk).
- The largest driver of longer passenger walk times and reduced passenger throughput was a factor of the length of the ramp rather than the slope of the ramp. Shortening the distance between fare collection and entering the vessel along the path of travel can increase passenger throughput when other mitigation measures are considered at the fare collection point.
- Boarding door width should also be considered a key capacity constraint point. Doubling the boarding door width could improve the speed of passenger throughput.
This page intentionally left blank.
Abbreviations and acronyms used without definitions in TRB publications:
| A4A | Airlines for America |
| AAAE | American Association of Airport Executives |
| AASHO | American Association of State Highway Officials |
| AASHTO | American Association of State Highway and Transportation Officials |
| ACI–NA | Airports Council International–North America |
| ACRP | Airport Cooperative Research Program |
| ADA | Americans with Disabilities Act |
| APTA | American Public Transportation Association |
| ASCE | American Society of Civil Engineers |
| ASME | American Society of Mechanical Engineers |
| ASTM | American Society for Testing and Materials |
| ATA | American Trucking Associations |
| CTAA | Community Transportation Association of America |
| CTBSSP | Commercial Truck and Bus Safety Synthesis Program |
| DHS | Department of Homeland Security |
| DOE | Department of Energy |
| EPA | Environmental Protection Agency |
| FAA | Federal Aviation Administration |
| FAST | Fixing America’s Surface Transportation Act (2015) |
| FHWA | Federal Highway Administration |
| FMCSA | Federal Motor Carrier Safety Administration |
| FRA | Federal Railroad Administration |
| FTA | Federal Transit Administration |
| GHSA | Governors Highway Safety Association |
| HMCRP | Hazardous Materials Cooperative Research Program |
| IEEE | Institute of Electrical and Electronics Engineers |
| ISTEA | Intermodal Surface Transportation Efficiency Act of 1991 |
| ITE | Institute of Transportation Engineers |
| MAP-21 | Moving Ahead for Progress in the 21st Century Act (2012) |
| NASA | National Aeronautics and Space Administration |
| NASAO | National Association of State Aviation Officials |
| NCFRP | National Cooperative Freight Research Program |
| NCHRP | National Cooperative Highway Research Program |
| NHTSA | National Highway Traffic Safety Administration |
| NTSB | National Transportation Safety Board |
| PHMSA | Pipeline and Hazardous Materials Safety Administration |
| RITA | Research and Innovative Technology Administration |
| SAE | Society of Automotive Engineers |
| SAFETEA-LU | Safe, Accountable, Flexible, Efficient Transportation Equity Act: A Legacy for Users (2005) |
| TCRP | Transit Cooperative Research Program |
| TEA-21 | Transportation Equity Act for the 21st Century (1998) |
| TRB | Transportation Research Board |
| TSA | Transportation Security Administration |
| U.S. DOT | United States Department of Transportation |