Quantitative Procedures for Designing and Operating Ferry Services (2023)
Chapter: Chapter 1 - Introduction

CHAPTER 1
Introduction
Research Objective
For many areas, ferry transportation services play an important role in regional transportation by providing additional transit capacity to transportation networks and serving as a lifeline for geographically isolated communities. Despite the long history of ferry transportation and recent expansion of ferry service in several regions, research and guidance for ferry capacity planning are underdeveloped compared to other transportation modes. The objectives of this research are to present guidance for defining the capacity of a ferry system as well as for understanding capacity challenges, and to provide quantitative procedures for designing and operating both scheduled and fixed-route ferry transit services and facilities that serve only passengers as well as passengers and vehicles. This report presents capacity concepts and analysis focused on vessels, terminals, and service schedules, and discusses the relationships and dependencies between these elements.
The target audience of this report includes ferry operators and transit decision makers with existing ferry services. The report assumes that its readers have a foundational understanding of the ferry industry or will reference background information in existing ferry reports.
Another goal of this report is to identify gaps in this and previous research where additional data collection and research are needed to more fully develop capacity guidance and quantitative procedures and further the availability of information for ferry capacity planning.
Definitions
This section provides definitions of ferry and transit terms as used in this report. Many of these terms could be used or defined differently in other publications.
Ferry Service Components
- Dwell time: The total time the vessel spends at the dock between tie-up arrival and the departure of the next scheduled service trip, including the time needed to load and unload passengers and perform any necessary vessel cleaning or resupply activities.
- Lifeline route: A ferry route that serves an island or geographically isolated community that depends on the ferry service for access to services, jobs, or schools.
- Maneuvering and approach time: The time necessary to safely approach and depart the berth.
- Multimodal: The spatial, temporal, and financial connections between the ferry route and land-based transportation (e.g., bicycle, bus, microtransit, rideshare, auto). Physical connections and schedule and fare coordination are all components of multimodal systems.
- Operating margin: Extra time built into a scheduled trip time or service schedule to account for trips that take longer than average.
- Passenger: Any ferry user on the vessel or in the terminal, except for those in vehicles (who are referred to as vehicle drivers or passengers in vehicles).
- Pedestrian: Any individual traveling on foot; used in this report in reference to the terminal areas that people walk through to connect to and from the ferry and the rates at which they move through the terminal.
- System capacity: The maximum total number of passengers or vehicles a ferry system (including all vessels and routes) can carry over a specified period of time.
- Service frequency: The scheduled time between departures at a terminal for service along the same route.
- Throughput: The maximum number of passengers or vehicles that can move through a ferry terminal over a specified period of time.
- Time underway: The vessel travel time beginning when the vessel is untied at the departure terminal and ending when the vessel ties up at the arriving terminal, including vessel maneuvering time.
Vessels and Infrastructure
- Admeasured gross tonnage: A measurement reflecting the internal volume of a vessel; used as a basis for vessel regulation.
- Automobile equivalent unit (AEU): A standard footprint used for planning purposes to represent the dimensions of a standard vehicle.
- Freeboard: The height of the vessel main deck from the waterline.
- Holding area: The terminal area beyond the fare collection point dedicated to passenger or vehicle waiting (either linear or cluster).
- Passenger-only ferry: Vessel designed to carry passengers only, some with designated spaces for bicycles or freight. Typically, passengers walk on and off the vessel via a gangway or ramp connection to the dock.
- Queuing area: The area dedicated to lining up passengers or vehicles in order of arrival for fare payment or vessel boarding.
- Terminal: The entire facility used for passenger or passenger and vehicle ferry service, including landside and in-water elements. Depending on the type of ferry service, the terminal may require different components and amenities.
- Vehicle ferry: Also known as “automobile ferry” and “roll-on, roll-off ferry” (“RO-RO ferry”), a vessel (often with separated vehicle deck and passenger cabin spaces) designed to carry vehicles, drivers, passengers in vehicles, walk-on passengers, and passengers with bicycles. Typically, vehicles drive onto the ferry via a ramp or transfer span at one or both ends of the vessel, and passengers walk on and off the vessel over the vehicle ramp or a separated ramp connection to the dock.
Vessel-Focused Terminal Elements
- Berth (also referred to as slip): The specialized infrastructure designed to accommodate a single vessel at a time and provide a connection during operations (loading and unloading vehicles and passengers). If designed to meet tie-up requirements, a berth can also be used for mooring (tie-up outside of service windows).
- Dock: The overwater or along-shore terminal infrastructure used for vessel landing or mooring; may include multiple vessel berths.
- Float: In-water floating infrastructure used to provide berthing for passenger-only vessels.
- Gangway: A passenger walkway connecting a vessel to a float or pier. Gangways may be manually or mechanically moved to connect to the vessel once it is berthed.
- Pier: Fixed overwater infrastructure supported by piles.
- Ramp: A fixed passenger walkway between a float and dock or terminal.
- Transfer span: A movable ramp that provides a connection for vehicles between the dock and ferry vessel.
- Vessel–terminal interface: The alignment and connection between the terminal landing infrastructure and the vessel.
Background and Need for Research
Ferries serve a vital role in transportation systems throughout the United States and internationally. The 2020 National Census of Ferry Operators conducted by the Bureau of Transportation Statistics included responses from 164 U.S. ferry operators, with at least one operator reported from 42 out of the 54 states, territories, and the District of Columbia. Of the reported vessels, 98.54% carry passengers, 37.76% carry vehicles, and 17.35% carry freight. Total reported boarding counts for 2019 included 112.1 million passengers and 26.3 million vehicles (Bureau of Transportation Statistics 2020).
Ferry service is distinct from other transit modes for several reasons, including the regulations and challenges of the marine operating environment and the wide range in vessel and terminal designs and capacities. Each ferry system has unique operating conditions, ridership levels, route geography, and other service characteristics that define vessel and terminal infrastructure needs. However, less data and research are available for ferry planning and design than for other transportation modes, as noted in TCRP Report 165: Transit Capacity and Quality of Service Manual (TCQSM) (Ryus et al. 2013) and other reports.
Terminal and vessel infrastructure involve long-term, and typically expensive, investments. Understanding the information and procedures necessary to evaluate, prioritize, and address capacity issues in a ferry system supports operators and agencies in making these investment decisions. Additionally, this data analysis can also support funding endeavors, whether the funding is from grants or other sources.
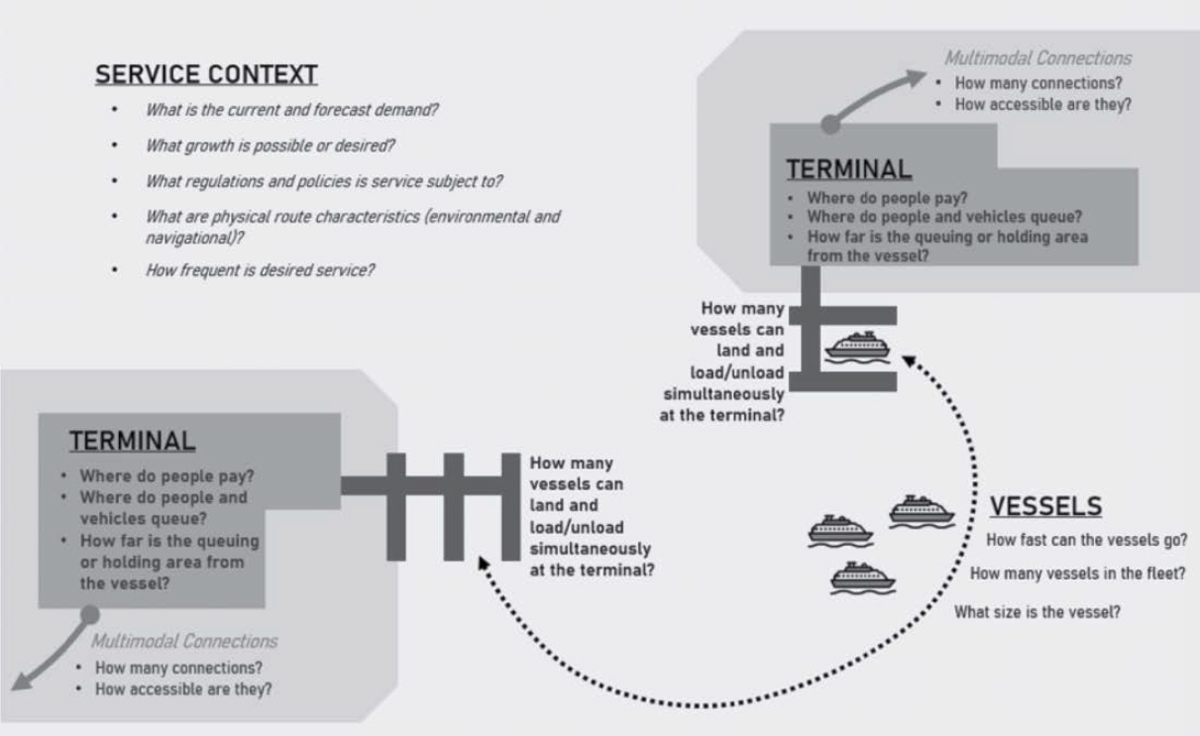
Ferry systems are complex and dynamic. System elements such as vessels, terminals, and operations are highly integrated and affected by many operating conditions that cannot be controlled, such as weather, sea states, marine mammals, vessel traffic, and other environmental operating conditions. This integration of system elements and dynamic operating environment can make it challenging to identify one system element that may relieve a capacity constraint. For example, design of a terminal element such as queuing area can have an impact on both the capacity (number of passengers or vehicles that can be accommodated at one time) and throughput (rate at which passengers or vehicles can move through the terminal), which then affects the vessel capacity that can be accommodated and how often vessel landings can be scheduled. Identifying each element—landside or on the vessel—that creates a pinch point or delay is critical to maximizing system capacity and therefore overall operating efficiency.
Ferry system capacity in relation to terminals and vessels is illustrated in Figure 1. These elements contribute to system capacity, which can be measured both by sailing and over given periods of time.
Research Approach
The research for this project expanded on the ferry guidance provided in previous TCRP and other reports and focused on:
- Identifying how ferry system elements, including operating conditions and assets (vessels and terminals), are related to each other and affect overall system capacity;
- Quantifying and assessing passenger and vehicle movement; and
- Presenting tools that can be used to plan for and address capacity challenges.
Data collection included conducting a literature review of previous ferry reports, administering an operator questionnaire, and observing existing terminal passenger throughput. The following sections provide details on each data collection method.
Literature Review
As a first step toward developing key quantitative procedures for designing and operating scheduled and fixed-route ferry transit services and facilities, the research team reviewed existing ferry studies and identified gaps in the information presented where further research or development of procedures would be needed to support informed ferry planning efforts. The gaps in information identified from the literature review are addressed in this report or are identified as topics recommended for further research in Chapter 6.
Resources reviewed for planning and operating ferry services included:
- TCRP reports,
- Ferry system planning documents, including feasibility studies and terminal design standards, and
- Transportation system planning guidance for other transit modes.
Four seminal ferry planning reports were identified, as summarized in the following. In addition to these four reports, numerous other ferry and transportation planning documents were reviewed and are referenced throughout the report.
- Functional Designs of Ferry Systems (Habib et al. 1980) provides a comprehensive review of urban ferry systems, including the Staten Island Ferry, San Francisco Bay Ferry, Washington State Ferries (WSF), BC Ferries, and BC Hydro Transportation (SeaBus), to establish guidelines for the planning of new services and new systems. The report focuses on the functional design of the vessel and terminal and the critical interface between the two, providing guidance for planning infrastructure and operations to support passengers and vehicles.
- TCRP Report 152: Guidelines for Ferry Transportation Services (Bruzzone 2012) provides an overview of the history and characteristics of ferry systems throughout North America and offers guidelines for planning, marketing, operating, and managing a ferry system as a component of an overall transportation network. Research presented in the report represents a wide range of ferry services and includes findings from a survey of 43 operators and in-depth case studies of eight operators. Guidance is aimed at policymakers and entrepreneurs considering launching or expanding ferry services and includes criteria for evaluation of cost-effectiveness and viability.
- TCRP Report 165: Transit Capacity and Quality of Service Manual, Third Edition (Ryus et al. 2013) includes research-based guidance on evaluating quality of service; measuring transit capacity, speed, and reliability; and sizing elements of transit stops and stations. The manual includes quantitative techniques for calculating the capacity and other operational characteristics of bus, rail, demand-responsive, and ferry transit services, as well as transit stops, stations, and terminals. Chapter 9: Ferry Transit Capacity describes aspects of ferry service, facilities, scheduling, and service planning, and provides quantitative procedures that are summarized in Table 1 of that report.
- TCRP Synthesis 102: Integrating Ferry Services with Mass Transit (Payne et al. 2013) examines the integration between land- and water-based transit systems and explores successful aspects of seamless integration. The report is intended to be a resource for transit agencies to improve existing ferry–transit interfaces and to establish new coordination between ferry and transit service. The report includes a literature review and the results of a survey completed by 46 operators focused on gathering information regarding multimodal schedule coordination, fare coordination, facilities coordination, and passenger communications.
The first three of these reports provide a foundational overview of the physical elements and operations of various types of ferry services, while the fourth takes a focused look at one aspect of ferry service planning, the integration with land-based transit. TCRP Report 165: Transit Capacity and Quality of Service Manual, Third Edition (Ryus et al. 2013), introduces several concepts foundational to calculating the capacity of ferry systems (discussed further in the last section of this chapter, Quantitative Procedures). This report references and builds on the foundational information presented in these previous reports to provide discussion and guidance focused on capacity planning of specific ferry system elements as well as overall route and system capacity and the interconnections between ferry system elements. This report furthers the guidance available for planning and calculating the capacity of ferry systems by providing additional quantitative procedures for calculating capacity, identifying best practices for capacity planning and management currently in use by ferry operators, and conducting data collection and observation of passenger flows at terminals to validate and supplement previous guidance. This report also recommends key areas for additional research that would improve the guidance available for ferry system capacity planning.
Operator Questionnaire
As part of this project, a questionnaire was developed and distributed to ferry operators across the United States and internationally. The goals of the questionnaire were to gather data and best practices related to capacity planning and to gain an understanding of the elements of ferry operations and associated policies that contribute to system capacity. Operators were asked to provide data on and descriptions of how their ferry systems address the following topics:
- Types of data and tracking methods for ridership and terminal throughput
- Methods or technologies used for fare collection and location of fare collection within the terminal
- Queuing lane management and allocation of space (passengers and vehicles)
- Service and schedule planning
- Planning related to alternative vessel propulsion technologies
- Performance metrics and targets
- Long-term planning impacts of COVID-19
- Multimodal connections and impact on system capacity
Five vehicle ferry operators and five passenger-only ferry operators provided responses. The respondents included domestic and international operators.
Table 1 lists the operators that provided responses to the questionnaire.
The questions asked of the operators and summaries of responses are included in Appendix A. Findings from the operator questionnaire informed the quantitative procedures and capacity components and best practices that are included throughout this report.
Table 1. Ferry operator questionnaire respondents.
| Vehicle Ferry System/Respondent | Passenger-Only Ferry System/Respondent |
|---|---|
|
|
|
|
|
|
|
|
|
|
Terminal Throughput Observation
To identify how the design of terminal elements, such as queuing lanes and ramps, affects overall ferry system capacity, the research team conducted on-site observations and reviewed footage from security cameras mounted at selected domestic terminals of ferry operators who responded to the questionnaire. The observations and video footage were used to collect data on walking speed and overall passenger throughput. Observations and empirical data for walk speed and passenger throughput were collected at 11 passenger-only ferry locations:
Kitsap Transit Fast Ferries (Washington)
- Bremerton Passenger Ferry Terminal
- Kingston Passenger Ferry Terminal
- Seattle Pier 50
New York City Ferries (New York)
- Wall St/Pier 11
- East 34th Street
- Brooklyn Bridge Park/Pier 6
San Francisco Bay Ferries (California)
- San Francisco Ferry Building, Gate E
- San Francisco Ferry Building, Gate F
- San Francisco Ferry Building, Gate G
- Alameda Ferry Terminal
- Oakland, Jack London Square
Data collection included video and live observation. Walkways, including the gangways and ramps, were observed to identify the relationship of passenger throughput to the slope and width of the walkways. Additional terminal observations included fare collection operations, the dwell time between passenger embarking and disembarking, capacity constraint points (i.e., where queuing occurred), and total passenger counts. Egress time was calculated between two points along the path of travel and compared to the distance traveled to estimate the average walk time for each ferry terminal.
Once data were collected, they were imported into and analyzed using data analysis software to visualize passenger walk speed and passenger throughput for all terminals observed. Findings were compared to the ferry-capacity spreadsheet-based tool developed for the TCQSM (Ryus et al. 2013) to estimate overall ferry operational capacity. The research informed operating procedures for passenger-only facility capacity planning.
More information on the data collection and analysis for the throughput observation is provided in Appendix B.
How to Use This Report
This report builds on the research and guidance presented in previous ferry reports and the TCQSM, which serves as a reference work providing research-based guidance on evaluation of quality of service measuring transit capacity, speed, and reliability, and sizing elements of transit stations. References to background information presented in previous reports are provided within the text, and a list of references is included at the end of the main body of this report.
Report Organization
A summary of the report’s organization and topics included within each chapter is provided in the following:
- Chapter 2 – Fundamentals of Ferry Capacity. Building on background information presented in previous TCRP reports, this chapter outlines the components of a ferry system that relate to capacity, as well as the interconnections and dependencies of these components. Topics include:
- Vessel and fleet planning,
- Terminal capacity and design,
- Maximizing sailing frequency, and
- Governance and policy factors.
- Chapter 3 – Capacity Concepts and Analysis Methods: Passenger-Only Ferries. This chapter identifies specific system elements that are key drivers of capacity for passenger-only ferry systems. The chapter also includes procedures for calculating capacity and best practices for planning and operating services. The concepts related to passenger movement and terminal design presented relate to both passenger-only and vehicle ferry services.
- Chapter 4 – Capacity Concepts and Analysis Methods: Vehicle Ferries. This chapter identifies specific system elements that are key drivers of capacity for vehicle ferry systems. It also includes procedures for calculating capacity and best practices for planning and operating services. The chapter builds on the passenger movement and terminal design concepts presented in Chapter 3 to focus on capacity planning concepts for vehicles.
- Chapter 5 – Example Capacity Procedures Use. Two hypothetical scenarios, one related to passenger-only ferry service and one related to vehicle and passenger ferry service, present how the capacity concepts and quantitative procedures presented in this report could be used by operators/agencies to address capacity challenges.
- Chapter 6 – Suggested Further Research. The report concludes with a discussion of the topics suggested for further research and data collection.
Quantitative Procedures
Quantitative procedures addressing ferry system capacity are presented in previous reports, including the TCQSM (Ryus et al. 2013) and Habib et al. (1980). Those procedures are summarized in Table 2 (listed in the order in which they appear in each report).
This report builds on these previously developed quantitative procedures and includes several new procedures, which are summarized in Table 3.
Table 2. Summary of existing ferry capacity quantitative procedures.
| Capacity Concept | Reference | Procedure |
|---|---|---|
| Berth and dock capacity | TCQSM: Equation 9-1, Equation 9-5, Ferry Capacity Computational Engine | Maximum number of vessels per hour based on a given passenger demand that a berth or dock can accommodate |
| Vessel service time | TCQSM: Equation 9-2 | Design vessel service time |
| Dwell time (passengers) | TCQSM: Equation 9-3, Ferry Capacity Computational Engine | Passenger disembarking and embarking time |
| Dwell time (vehicles) | TCQSM: Equation 9-4, Ferry Capacity Computational Engine | Vehicle disembarking and embarking time |
| Schedule capacity | TCQSM: Equation 9-6 | Capacity on the route’s maximum load segment = vessel capacity × frequency × peak-hour factor |
| Passenger facility holding capacity and throughput | TCQSM, Chapter 10 | Doorway flow rates (Exhibit 10-25), number of required ticket vending machines (Equation 10-1), fare gate capacity (Exhibit 10-27), pedestrian flow/LOS (Equation 10-5) |
| Average park-and-ride discharge rate | Habib et al. 1980 | Average rate of vehicles exiting a terminal from the park and ride, based on passenger volume, walk time from the vessel, and average auto occupancy |
| Terminal seating requirements | Habib et al. 1980 | Method for estimating seating requirements based on service frequency |
| Vehicle facility holding capacity requirements | Habib et al. 1980 | Required holding lane capacity based on number of routes, destinations, and vessel capacity |
Note: LOS = level of service.
Table 3. Ferry capacity quantitative procedures included in this report.
| Capacity Concept | Description |
|---|---|
| Passenger-Only Ferries | |
| Equation 1: Calculating Operating Margin | Estimates the time needed to account for typical delays and longer-than-average dwell times |
| Equation 2: Passenger Boarding Station Throughput | Estimates the passenger throughput of a given vessel boarding station |
| Vehicle Ferries | |
| Equation 3: Using AEU to Calculate Vehicle Capacity of the Vessel | Applies AEUs to calculate the number of standard-sized vehicles that can be carried on a vessel |
| Equation 4: Estimating Vehicles Left Behind | Estimates vehicles left behind at the terminal |
| Equation 5: Sizing Vehicle Fare Collection Facilities | Estimates the number of toll booths needed to process vehicles at a targeted rate |


