Procuring Interoperability: Achieving High-Quality, Connected, and Person-Centered Care (2018)
Chapter: Technical Supplement - Section 2: N-Squared Diagram Approach to Identifying Interoperability Requirements
Technical Supplement—Section 2
N-SQUARED DIAGRAM APPROACH TO IDENTIFYING INTEROPERABILITY REQUIREMENTS
The field of engineering offers many diagramming tools that may help organizations grapple with understanding their respective interoperability challenges. These tools include diagrams such as flowcharts, block diagrams, and technical illustrations such as the family of diagrams defined by Unified Modeling Language (Object Management Group Unified Modeling Language, 2017) or SysML (Object Management Group Systems Modeling Language, 2017). The N-squared diagram is a tool used in systems engineering to help organize interaction complexity. The tool is routinely used in industries such as space and military system development to identify interactions between hardware or software systems (NASA, 2007). At the most basic level, the N-squared diagram can be a convening tool that an organization’s interoperability steering group uses to guide interoperability-focused conversations with clinical and operational stakeholders. Once the diagram is populated, the characteristic layout of the information can reveal interoperability needs and opportunities. The diagram is not only useful for understanding the organization’s interoperability needs for procurement planning purposes, but can also be used more specifically to evaluate interoperability requirements for proposed new purchases. Model-based tools similar to NIST’s prototype Architecture Development Facilitator (Fenves et al. 2007) can provide a framework for populating the N-squared diagram and visualizing the various interactions between the chosen set of components in the N-squared matrix. Further, several interaction and interoperability scenarios can be simulated using these model-based resources.
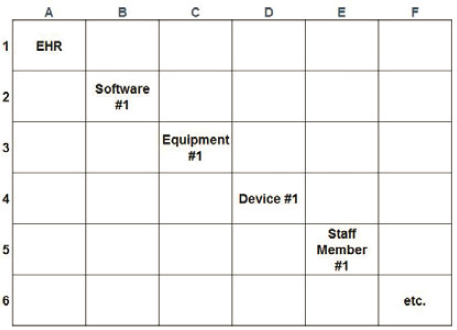
Figure A2-1 demonstrates the tabular layout of the N-squared diagram for a specific care unit (e.g., intensive care unit, or ICU). At the start, the table would have all blank fields. The first step is entering the diagonal elements as shown. These represent the entities (technologies, equipment, and people) that interact
in the unit, presuming the initial focus is on characterizing the current state. The nondiagonal elements are then filled in, representing the interactions between the various diagonal elements. There is no restriction on the type of interactions to be captured, but a typical first step is to include all manual (verbal and written) and electronic data transactions when possible. Although the description here focuses on a hospital unit, the diagonal elements entered could relate to interactions at any of the interoperability tiers discussed previously (macro-, meso-, or micro-tier).
SOURCE: Johns Hopkins University Applied Physics Lab, 2018
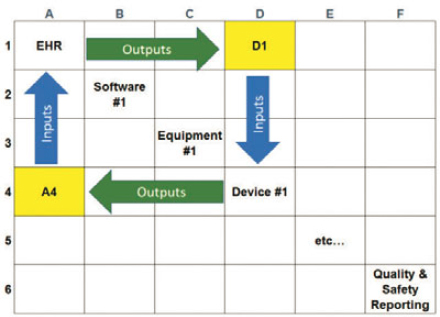
Figure A2-2 shows the convention for nondiagonal elements. An output of a diagonal element is marked across the corresponding row (shown by the green arrow), and an input of a diagonal element is marked across the corresponding column (shown by the blue arrow). Using the cell “D1” as an example, the content of this element would include any output data from the EHR that are input to Device 1 (such as patient height and weight data). Likewise, element “A4” shows output from Device 1 that becomes input to the EHR.
Once the diagram is filled, each intersecting point requires further details on how this document is exchanged and what the current interaction method is. Are clinical staff manually transferring the data, or is the process electronic/automated? Manual data interactions offer opportunities for improvement, but there may be several or even numerous incidences that are identified. The organization’s interoperability steering group can provide high-level guidance on prioritization over the short run and the long run. Factors to consider for prioritization may include patient safety and quality concerns, burden on efficiency and workflow, and costs. How an organization’s interoperability steering group
SOURCE: Johns Hopkins University Applied Physics Lab, 2018
weighs these prioritization factors will certainly be context specific. It is, therefore, important for the interoperability steering group to play a coordinating role, engaging relevant stakeholders to drive a collaborative outcome. At the organizational level, the interoperability steering group should establish a knowledge base and apply a coherent strategic direction on interoperability across various procurement activities.
The N-squared diagram may seem cumbersome, but most of the efforts are concentrated at the beginning. Once a baseline mapping of the current state of data exchanges is complete, future iterations are likely to require only incremental modifications.
N-SQUARED DIAGRAM APPLIED TO AN ENDOSCOPY SUITE
The following example applies the N-squared diagram to an endoscopy unit. The endoscopy suite, which provides diagnostic and therapeutic procedures like colonoscopy (both routine and emergency), is representative of the broader ambulatory procedure environment where numerous types of procedures and clinical scenarios take place. This example demonstrates the complex interactions among patients, technology, and staff and the need for tools to help understand and prioritize interoperability needs.
Building the framework
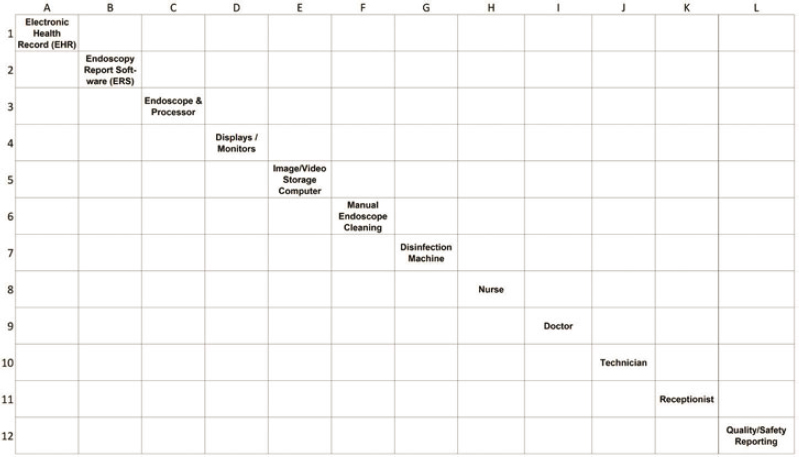
Step 1: Identify the entities that need to transfer information or data. These entities may include:
- IT systems (e.g., EHR, other clinical or administrative systems);
- equipment (e.g., radiology, anesthesiology, bedside monitoring);
- medical devices;
- people (e.g., patient, doctors, nurses, technicians); and
- reporting systems (e.g., quality or safety reporting, public health reporting).
Step 2: Place these systems along the diagonal of the table. Figure A2-3 shows an example within a hypothetical endoscopy suite.
SOURCE: Johns Hopkins University Applied Physics Lab, 2018
Step 3: Start in the upper left-hand corner, above the diagonal line (cell B1). This cell represents one of two interactions between the EHR and the endoscopy report software (ERS) systems. In this cell, enter the information coming from the EHR (output) and entering the ERS (input). In this example, patient orders and appointment information come from the EHR and enter the ERS system. Continue to fill out the remainder of the cells above the diagonal in a similar manner.
Step 4: Return to the upper left-hand corner, but now focus below the diagonal line, and repeat the process described in Step 3. This time, cell A2 represents the information coming from the ERS (output) and entering the EHR (input). For example, the ERS system needs to send procedure reports and endoscopic images to the EHR. Continue to complete the boxes below the diagonal line.
IDENTIFY KEY RELATIONSHIPS AND OPPORTUNITIES FOR IMPROVEMENT
Step 5: Once the key data interactions are completed, each box or interaction should be marked as a manual or automatic interaction. In Figure A2-4, manual interactions are marked in red, and automatic or electronically driven interactions are marked in green.
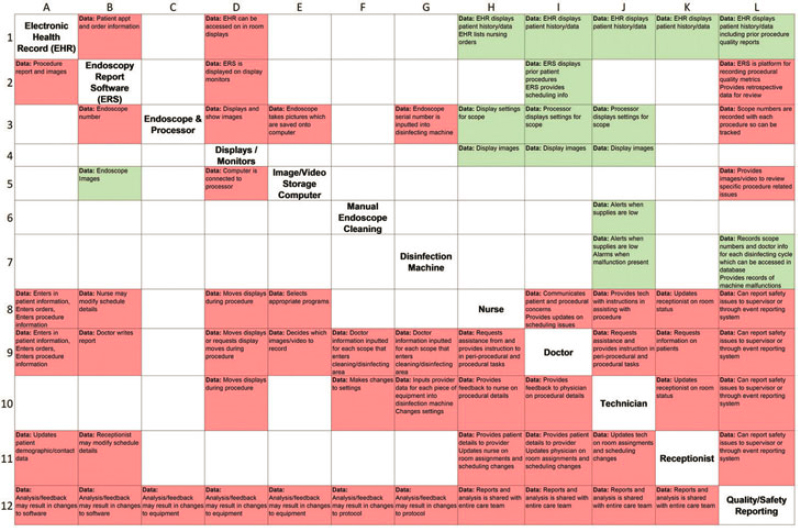
SOURCE: Johns Hopkins University Applied Physics Lab, 2018
Step 6: Identify manual interactions as possibilities for enhancing digital interoperability. With guidance from the interoperability steering group, prioritize among these interactions based on urgency or potential effects on safety, quality, or cost.
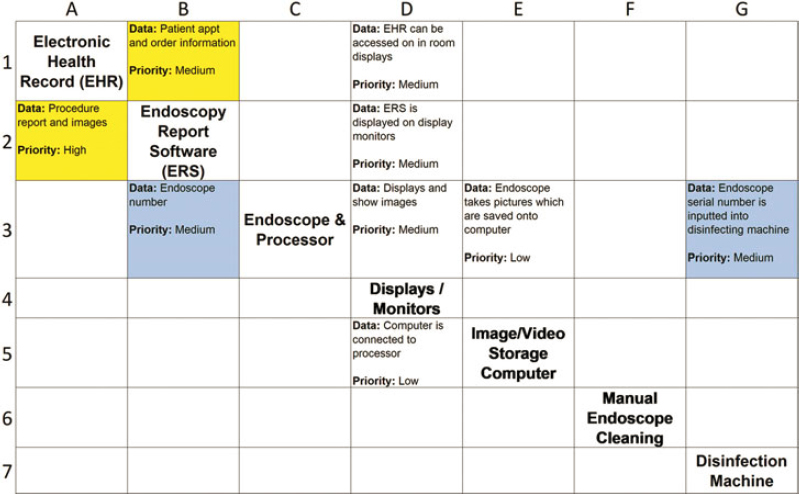
Step 7:Figure A2-5 focuses on a subsection of the N-squared diagram (cells A1 to G7). Assume the prioritization process highlights two specific areas for improving interoperability (marked yellow and blue):
- The yellow cells identify the need for the EHR to be more interoperable with the ERS system. After consulting with the interoperability steering group, the staff identifies this interaction as consistent with the IHE Endoscopy supplement, which are available for trial implementation.
- The blue cells represent the need to link the endoscope number from the ERS to a specific patient and to the disinfection system. This is a matter of patient safety, not just workflow efficiency. Unfortunately, the staff cannot identify any existing integration profile or implementation guide.
SOURCE: Johns Hopkins University Applied Physics Lab, 2018
SUMMARY
The N-squared diagram serves as a tool for clinical and engineering teams to take inventory, in order to align their interoperability vision and requirements. Health care organizations may use tools such as this to establish a baseline for a particular service unit or a care path. Completing the initial draft of the N-squared diagram requires more work, but modifying the baseline and tracking updates over time should be less time intensive. This assessment process should be teamwork, including clinical and IT/engineering staff. The involvement and guidance from the interoperability steering group ensures that high-level vision and mission are instilled in the process. The goal of the N-squared exercise is to understand the full requirements of the end user and facilitate communication between information technology, clinical staff, and patients.


