Assessing Equity in the Distribution of Fisheries Management Benefits: Data and Information Availability (2024)
Chapter: 3 Distributional Equity of Fishery Permit and Allocation Benefits
3
Distributional Equity of Fishery Permit and Allocation Benefits
In this chapter, the committee addresses its statement of task (see Box 1-1 in Chapter 1) by focusing its interpretation of “primary benefits” on the allocation of permits and quotas and taking a limited view of the benefits that derive from those allocations. This focused lens considers primary from a “first in order” perspective and is aligned with the directive given to the committee by the National Marine Fisheries Service (NMFS). Chapter 4 discusses a broader suite of fishery benefits and beneficiaries, and Chapter 5, expands on distributional equity to explore procedural, recognitional, and contextual dimensions of equity.
The first charge of the statement of task directs the committee to “determine the categories of information required to adequately assess where and to whom the primary benefits of commercial and for-hire fishery management accrue.” To address this element, the committee developed a stylized model fishery, in which comprehensive data on permit (or quota) holdings and transfers are augmented with information on characteristics of permit and quota holders for a developing fishery in which all permits (or quota) are held by individual owners. Using this stylized model fishery as an illustration, the committee highlights the opportunities and challenges in both measuring the distribution of ownership in fisheries across regions and assessing the distribution of the associated benefits; it also highlights how a focused reading of the statement of task yields a set of data and information that is necessary but insufficient for assessing equity in fisheries.
Second, the statement of task calls on the committee to “determine what information currently exists … and what additional information, if any, NMFS would need to collect.” To that end, this chapter discusses available data and identifies currently unavailable but desirable data across the nation and in specific regions. Examples from the Northeast, the Gulf of Mexico, and the North Pacific serve as case studies; these demonstrate how contextual, statistical, and practical considerations affect an understanding of the current distribution of benefits across demographic categories at fishery, regional, and national levels.
Third, the statement of task directs the committee to “identify potential obstacles to collecting this additional data.” In responding to this component, this chapter describes obstacles to collecting the data and information identified in response to the second question. These include, for example, the difficulty of collecting data and information related to where and to whom benefits accrue, given
the complexities of fishery participation; lack of historical data; issues regarding the collection and use of personal identifying information and business identifying information through time; and lack of social science capacity and funding.
Finally, the statement of task calls on the committee to “identify methodologies the agency could use to assess the relative distribution of benefits from federal commercial and for-hire fishery management based on available information.” In response to this component, the committee discusses possible methodologies for developing the categories of information that are inputs into an assessment of distributional equity. Given the heterogeneity across the management regions in terms of the definition and use of permits and quota, data available, and how data are collected, the methodology discussion focuses on the regional level, again using examples from the North Pacific, Northeast, and Gulf of Mexico. This section describes how to utilize data that are currently available in the regions to develop categories of information—which could entail simply summarizing the age distribution of ownership or could entail the challenging measurement of monetary and nonmonetary benefits tied to permit and quota ownership. The latter is challenging both because of the sophisticated scientific tools needed for measurement but also because the scope and scale of benefits is a political decision with potential equity and fairness implications (see, e.g., discussion in Chapters 2, 4, and 5). Specific methods to use in assessment of distributional equity, including the definition of the counterfactual, may be explored in a subsequent report (see Chapter 1 regarding a “Phase 2” study).
A STYLIZED MODEL FISHERY
A hypothetical stylized model fishery is a starting point from which to develop insight into the data and information required to determine the categories of information needed to adequately assess the distribution of benefits associated with permits and quota. It is intended to have characteristics that are similar in structure to current NMFS data but augmented to include comprehensive information on the characteristics of permit and quota holders. Specifically, a case of a developing fishery in which datasets on permits, quota, and quota transfers can be linked to comprehensive demographic and geographic information on individual fishers. The next section describes these two components of the stylized model fishery.
In this example, NMFS begins the management of a developing fishery in federal waters for a productive species. The aggregate annual catches are insufficient to trigger regulatory limits. NMFS issues permits for individuals to participate in the fishery on an annual basis. Each permit holder is an owner-operator and uses a single vessel in the fishery. Permits are issued only to individuals—not to vessels, firms, banks, or communities. To obtain a permit, each individual is required to provide a suite of demographic information to the management agency. These data could include age, gender, race/ethnicity, tribal affiliation, household income range, alignment with specific communities, language spoken, education level, and more. A physical home address and address of the vessel, if different from the home address, is also required. Once a permit is held by an individual, it may be sold or leased to another individual. Transfers of permits and quotas and their transfer prices must be reported, and the new owner must provide identical categories of information to the original permit holder. The transfer market is active and efficient. Applicants must provide a list of other permits and quotas that they hold or lease. When the fishery is operational, each permit holder is required to submit daily reports of catch and discards. The permit holder has to provide information on the disposition of the landings geographically. A dealer reporting system allows for verification of permit holder reports. The fishery management system is maintained consistently over several years with complete compliance, thereby developing a rich database of information.
What would this model system provide with regard to the question of assessing the distribution of permits and quotas over time? Such an idealized dataset has many attractive features that would
provide valuable information when considering management changes and their distributional effects that typically remain largely invisible in the real world (Calhoun et al., 2016; Donkersloot, 2021; Gerrard and Kleiber, 2019; Kleiber et al., 2014; Meredith, 2018; Petterson, 1984). Because the fishery is new, such information will be available from the start of the program. Additionally, because reporting is mandatory at the permit application stage, analysts have data on permit applicants and holders., allowing comparison of the characteristics of successful and unsuccessful applicants. This capability is not common in fisheries generally. A complete dataset is available with respect to fishing activity. The data represent a census. The monetary price of the permit, as expressed through arms-length transactions, provides a measure of the economic benefits of participating in the fishery as a permit and/or quota holder.
The union of the lists of permit applicants and holders with the demographic database would enable one to address the basic questions of where and to whom the benefits of permit and quota holdings accrue. Many of the resulting data summaries on personal identifying information would not necessitate statistical estimation or consideration of the representativeness of the sample, given the census. The data could be categorized along a number of demographic axes, including age, gender, race/ethnicity, income level, tribal participation, and involvement in other fisheries. Assignments to these categories would be based on self-reported information and not inferred. Having demographic information on permit and quota holders would allow managers to ascertain the level of fishery engagement among various groups—for example, Indigenous or young people, or women. Analyses could explore how demographic variables may interrelate (see, e.g., Calhoun et al., 2016; Donkersloot, 2021; Gerrard and Kleiber, 2019; Kleiber et al., 2014; Meredith, 2018; Petterson, 1984). It would be straightforward to produce maps of the distribution of access rights (i.e., permits, quota), income/employment (permit/quota holders), sales of product, or sales of permits if such transfers were outcomes. Spatially resolved data could be aggregated to provide community-level insights. Additionally, analyses could leverage other data sources including the American Community Survey and the NMFS Social Vulnerability Index to provide further interpretation and context.
What dimensions of equity and categories of information remain unaccounted for in this model system? For one, it considers simply “first in order” benefits related to the issuance of permits and the allocation of quota in a single fishery. The measured benefits correspond only to monetary benefits and quantitative indicators of participation. Furthermore, nothing in the data described includes information on how to determine whether “first in order” benefits are the same as “high in importance” benefits. For example, no information is gathered on crew who may have been on board the permit holder’s vessel. No information is gathered on shoreside facilities, other than dealer reports to serve as landing verification. No information is gathered on downstream benefits related to industries that support fishing, or on the contribution of the income of the permit holders to the well-being and resilience of the community. (Chapters 4 and 5 address some of these concerns.) No information is collected on whether applicants participated in other fisheries, and whether or how participation in this new fishery affect participation and harvests in other fisheries. Finally, analyses simply described the distribution of benefits. There is no discussion of the appropriate criteria for measuring whether a distribution is equitable or whether such criteria are seen as fair among participating fishers. The criteria, for example, could include the appropriate counterfactual to use to measure whether distributional equity is improving over time, and the process for determining the appropriate counterfactual. The process for determining the counterfactual entails agreeing on the baseline or baselines from which to start measuring changes in the distribution of permit and quota owners and/or identification of an alternative management structure or program that observed distributional outcomes could be compared to. These aspects of assessing equity go beyond the study statement of task. Additionally, the stylized model fishery includes nothing to highlight the
important role of recognitional, procedural, or contextual equity in shaping distributional outcomes. Chapter 5, however, considers these broader equity considerations for fisheries.
MOVING BEYOND THE STYLIZED MODEL FISHERY
To illustrate that how demographic information in the stylized fishery could be used to address the focused lens of the statement of task (i.e., characterizing the distribution of benefits derived from holding permits and quotas), the committee made a number of simplifying assumptions on the nature of the fishery. Specifically, we assumed that (1) the permit owner is an individual who also owned the vessel, (2) the geographic information corresponds to the permit owner’s community, (3) the permit market is efficient, (4) the permit and quota prices reflect monetary benefits, (5) monetary benefits are the only benefits derived from permit and quota holding, and (6) the fishery in question is commercial as opposed to a for-hire, charter fishery.
This section confronts each of these assumptions with the realities of U.S. federal fisheries. However, as discussed in Chapter 2 and illustrated in Chapter 4, this full suite of personal identifying information for quota holders is insufficient for addressing questions regarding distributional equity for the fishery overall. Moreover, many of the underlying assumptions in the model are not satisfied within the realities of U.S. federal fisheries. Thus, even measuring the current distribution of permits and quotas is challenging in reality.
Assumption 1: Permits are awarded to individuals active as on-board owner-operators. Awarding permits to an “on board” owner-operator guarantees the individual is actively engaged in the fishery. In federal fisheries, permits are not awarded consistently to individuals, and it is not immediately clear that the individual is the correct unit from which to measure distributional equity. Permits may be awarded to individuals, but an “on-board” requirement does not exist, and so the permit owner may be only passively involved in the fishery. Permits may also be owned by a limited liability corporation (LLC). In some cases, these are set up purely to protect a family’s investments outside of the fishery. In other cases, the LLC are independent legal entities that are investing in fisheries in the same way they would invest in other financial devices. In some regions, permits are awarded to vessels, and the ownership of the vessel can be legally complex. The awarding of permits to vessels is often justified as an approach to prevent overcapacity in the fishery.
Assumption 2: Home and port address information on the permit holder is required for permitting. In federal fisheries, this complete information is not always available. In some cases, addresses provided on permit applications are a corporate office, which may not be an appropriate foundation from which to assess “where” benefits accrue. The uncertainty around where an entity operates reduces the ability to confidently link permit and landings databases to data sources with a fuller suite of social, economic, housing, and demographic information.
Assumption 3: The fishery is a new developing fishery, and the allocation process of the scarce permits is omitted. This assumption enabled the committee to remove the contextual underpinnings of the current set of permit and quota owners. The current set of owners of permits and quotas in any fishery, however, is the result of a long process of fishery management decisions, such as fishery closures; restrictions of specific gear types, which exclude some communities; and the implementation of rebuilding plans. For example, the initial allocation in a fishery with a limited access privilege program might be limited to fishers fishing a specific combination of gear, species, and area. Some participants could be left without an allocation, even if they have a historical record of fishing for that species (e.g., with different gear). Such was the case when the Gulf of Mexico snapper and grouper limited access privilege program was established; it required documented catches above a certain threshold for a period of time. These qualification criteria can exclude specific, historical segments of the fishery. The West Coast groundfish limited access privilege program covered the trawl fleet, even though fixed-gear fishermen were targeting the same stocks in the same areas.
Being left out of the initial allocation, which often comes with a large economic gain, could lead to inequities among fishers many years after an initial allocation occurs (e.g., higher rates of exit). Simply measuring the demographic distribution of the current and future owners (by collecting these data on a regular basis) can lead to an inaccurate picture of the equity implications of federal fishery management decisions.
Assumption 4: Permit price reflects the economic benefit of ownership. In the stylized fishery, the committee did not consider the full suite of values and benefits associated with permit and quota ownership. The assumptions implied that permit prices reflect the economic returns from the fishery for the permit owner—whether that is true depends, for example, on the set of entitlements provided by the permit (e.g., tradable) and whether the permits are limited and observable. Even if it is possible to determine the economic value of holding an allocation, that does not necessarily equate to the economic benefits that accrue to the recipient of an allocation. For instance, quota or permit holders that purchased their allocation (e.g., entrants after an allocation is made) must also account for its monetary cost. In such cases, the benefits accruing to allocations are net of such costs and only exist if the quota/permit holder can generate a surplus over and above the cost of purchasing the allocation. Measuring such surplus requires not only knowledge of the purchase price of the allocation but also the operating costs of permit and quota holders, which are often unknown. Potential quota holders may also incur nonmonetary costs, such as the time costs associated with administrative forms that could be disproportionately born by individuals or groups, such as rural populations with poor Internet access, or those for whom English is not a first language.
Assumption 5: There are no non-monetary benefits associated with permit and quota holdings. At the level of the individual permit or quota owner, these benefits could include self-identity, mental and physical health, political empowerment, cultural knowledge and practices, job satisfaction, place attachments, food security, and individual well-being and quality of life (Breslow et al., 2017; Chan et al., 2012; Donatuto and Poe, 2015; García-Quijano et al., 2015; Gregory et al., 2023; Lyons et al., 2016; Norman et al., 2022; Picou, 2000; Pollnac and Poggie, 2006, 2008). Omitting these non-monetary benefits when characterizing benefits from permit ownership can result in an incomplete and potentially misleading interpretation of the distribution of the permit and quota owners.
Assumption 6: The stylized model fishery is commercial. However, federal fisheries include for-hire fisheries, which represent a different scenario from commercial fisheries, where permit owners are generally focused on providing desirable fishing experiences for customers or clients. Importantly, many for-hire fisheries remain open-access fisheries, which operate differently from the limited access, permit-based stylized fishery (Abbott and Willard, 2017; Abbott et al., 2018). In such fisheries, the need to control fishing mortality rates, as required by MSA, can lead to short seasons and/or reduced bag limits in individual fisheries. This means permit holders in the for-hire sector likely participate in multiple fisheries and the benefits become, accordingly, more dilute. Capturing only demographic information of permit owners in for-hire fisheries, as might have been the case if the stylized model used a for-hire fishery, would miss many of the elements discussed thus far. In addition, simple demographic information on permit holders would miss the diverse fishing motivations, avidity, and social and economic characteristics of the clients who fish on for-hire vessels (Arlinghaus and Mehner, 2005; Brinson and Wallmo, 2017).
The preceding discussion highlights some difficulties in determining who the primary beneficiaries are from permit and quota allocations in U.S. federal fisheries. The most immediate implication is that simply collecting a comprehensive database of permit and quota holders across all U.S. regions and fisheries is a necessary but not sufficient condition for determining the beneficiaries of allocations and the equity of those allocations in U.S. federal fisheries.
METHODOLOGY
This section provides a high-level overview of the permitting and quota allocation process in U.S. fisheries under the Magnuson-Stevens Act (MSA) and a review of data availability in three regions: the Northeast, Gulf of Mexico, and North Pacific. These regions were chosen because they illustrate a range of approaches to factors such as permitting, community characteristics, reliance on fisheries, and the importance of the for-hire sector. Data availability varies substantially by fishery, even within the same region, so this review focuses on data that are common across regions. The section then discusses methodological techniques and challenges for measuring monetary and nonmonetary benefits associated with permit and quota ownership.
Databases on Permit and Quota Ownership
Numerous data streams are available to NMFS to provide data relevant to assessing the distribution of benefits derived from permits and quota. However, these data streams are often incomplete, inconsistent, and incompatible. A recent review by NMFS staff found 565 different forms and surveys that collected information relevant to assessing distributional equity in the nation’s fisheries. Approximately 200 of these forms were applications for mandatory permits for specific fisheries. In most U.S. federal fisheries, a permit is the minimum requirement to operate. However, there is considerable variability in the information collected on each permit application. Permits can be granted through a vessel license, a permit to an individual or corporate entity, a defined share (or quota) to a total allowable catch, or a combination of these.
Most permit applications require the name and mailing address of the permit holder. In cases where multiple people share ownership, the list of owners is often required, but their share in the ownership is not generally specified. Some limited, voluntary information may also be collected on the permit application. The extent of demographic information requested is limited over concerns that such information should not be seen as in any way qualifying criteria for permit applications. Other data that could inform an assessment of the distribution of benefits come from voluntary survey instruments that have been periodically deployed by NMFS. The voluntary nature of these surveys raises questions about the initial sample frame, as well as the level and representativeness of respondents. However, these surveys do collect a wide spectrum of demographic, economic, and geographic data that can inform assessment of distributional equity.
Based on presentations to the committee, development of a national database of permit holders that provides a consistent, complete sample frame seems unlikely in the near future. Such a data collection program would have to account for and be responsive to substantial contextual variation among regional approaches to fisheries. To understand the distribution of permits and quota, the committee adopted a regional approach. Three regions—the Northeast, Gulf of Mexico, and North Pacific—are chosen to illustrate this approach because they differ in their approach to permitting as a result of structural, contextual, and cultural differences. In selecting these regions, the committee seeks to identify challenges and opportunities for NMFS to assess distributional equity at the regional level. The committee developed a general process for data and information collection that forms the basis of our regional fishery data reviews. The seven steps in the process are:
- Determine to whom permits and quotas are issued for each fishery managed within the region (e.g., individuals, vessels, corporate or community entities).
- Determine the rights associated with such allocations for each fishery (e.g., defined right to total allowable catch, access-right only, rights of transfer/alienation).
- Identify databases that record the recipient of these allocations and the “amount” of the allocation, if applicable (e.g., quota shares).
- Determine information associated with allocation recipients (e.g., demographics or place of residence, which may inform questions of where the benefits accrue; see Table 3-1 for examples).
- Identify other databases that contain information related to the monetary value and transfers of allocations (e.g., permit prices, quota prices), to the extent they are available.
- Determine records of landings as a measure of the direct economic benefit of the allocation.
Beyond these initial steps, however, substantially greater heterogeneity is found in the existence of, structure of, and data and information contained in additional currently available data. Thus, the final step is:
- Identify other databases and sources of information and whether they can be linked to permit and quota holders (e.g., surveys, ethnographic fieldwork). For example, the Bureau of Indian Affairs would be key to supporting NMFS in assessing Tribal citizen engagement in federal fisheries and change over time.
REGIONAL EXAMPLES
Northeast Fisheries
Fisheries in the Northeast have a venerable history (McFarland, 1911) that provides a context for the issuance of permits and quota. Today, the region falls under the jurisdiction of the Greater Atlantic Regional Fisheries Office (GARFO) of the National Oceanic and Atmospheric Administration (NOAA); GARFO serves both the New England Fishery Management Council (NEFMC) and the Mid-Atlantic Fishery Management Council (MAFMC). The NMFS Northeast Fisheries Science Center (NEFSC) undertakes natural and social science research and surveys to support fisheries management.
Working with partners, GARFO currently oversees 42 fish stocks and 14 fishery management plans (Table 3-1). A federal vessel operator permit is a minimum requirement to participate in any of GARFO’s commercial or for-hire fisheries. Application for a vessel operator permit requires the applicant to provide a physical mailing address. Other personal information, including eye color, hair color, height, and weight, together with a photo, are required. These are required for identification and compliance reasons and not for the collection of demographic information related to equity. Beyond this, specific annual permits are needed to operate in particular fisheries. Permits to participate in specific fisheries are assigned generally to fishing vessels. Applications for a permit require the vessel name, name of the owner or legally authorized agent, mailing address, home port, and principal fishing port. Detailed information on vessel size, construction, capacity, and power are also required. Additionally, the applicant identifies the open or limited access fisheries in which the vessel will operate. If the vessel is owned by an LLC or partnership, the applicant has to provide a list of all current owners or partners and their addresses. Details of the division of ownership is not required. No other data—including age, gender, ethnicity, and other demographic information—are required.
In general, permits may be transferred to a new owner on the sale of a vessel. However, vessels that sink, are destroyed, or are sold without the associated permit can be placed in a “confirmation of permit history” category, which preserves the landings and permit history of that vessel to be moved to a new vessel when the original is replaced. Vessel prices have escalated in recent years, driven largely by the value of the permit, which creates a barrier to entry. The price of vessels also creates a motivation for complex ownership structures, and the contribution of different owners
listed on the permit can be difficult to ascertain. There is no “onboard” requirement for the permit owner. This can uncouple ownership of permits from the communities in which shoreside capacity is based.
Table 3-1 summarizes the principal fisheries for the New England and Mid-Atlantic region, the required permits, and the rights associated with those permits, together with comments. Different permits provide different allocated catch limits within a fishery. The vast majority of fisheries in this region are associated with a limited access permit (Table 3-1). When and how these programs were implemented set the trajectory for the fishery and provides a context for understanding “to whom” benefits accrue. Many limited access permits for traditional fish species are bundled together (e.g., Northeast multispecies groundfish complex and the squid, mackerel and butterfish; Table 3-1). A key motivation for bundling of species into complexes appears to derive from efforts to manage over capacity following the expansion of management jurisdiction to 200 nm in the original Fishery Conservation and Management Act (1976). An important contextual detail is that fishers often qualified for multiple permits, and today they remain bundled together. Färe et al. (2017) report that steel-hulled vessels in the commercial fleet in the Northeast held an average of 4.1 permits per vessel. There are incidental take permits for nontargeted bycatch. Some of these incidental take permits are for small, open-access fisheries, mostly as a mechanism to reduce discarding levels. These are not intended to be economically viable by themselves. There are also four high-profile individual transferable quota fisheries: Atlantic scallop, ocean quahog, surfclam, and golden tilefish. Quotas are allocated annually in these fisheries. A “catch share” fishery exists within the Northeast Multispecies fishery. This portion of the multispecies fishery involves 17 groups of self-organized “sectors” whose permits have an associated annual catch entitlement (Clay et al., 2014). Finally, there are important for-hire sectors within the region for summer flounder, black sea bass, and other species that are managed cooperatively with coastal states.
The GARFO maintains a permit database for the region. Efforts are underway to improve the reliability and consistency of the data held. Hence, a cross tabulation of the permit holders and operator permits could provide a foundation for assessing the level of active versus passive investors in vessel permits.
The individual transferable quota fisheries provide public data that can be used to demonstrate the challenges that the pattern of bundled permits and assignment to vessels creates to assessing distribution of quota and permits in the Northeast. There were 63 allocations made to vessels in the surfclam fishery in 2022 in the Northeast. Data are available on these allocations on the GARFO website. GARFO has information on mailing address and ownership of vessels associated with each allocation. Seventeen of these allocations (about one-quarter) were made to vessels registered to six different financial institutions. Only one of those financial institutions appears to be based in a traditional fishing community. These financial institutions are permitted to hold quota as collateral on a loan.1 Other vessels appear to be owned by food processing companies, suggesting that vertical integration of fisheries and derived products is not uncommon. The committee offers this example not to single out the surfclam fishery—indeed the patterns are similar in other limited access fisheries—but rather to demonstrate the challenges that the vesting of permits in vessels creates in terms of tracing where and to whom the benefits of permits and allocations accrue in the Northeast.
GARFO does collect data on transfers of rights associated with permits and quota. Data for fisheries with individual transferable quotas (Atlantic scallop, surfclam, ocean quahog, and golden tilefish) and for transfers between sectors in the Northeast multispecies complex are the most detailed (see Brinson and Thunberg, 2016).
Important voluntary surveys have been conducted in the region that provide key demographic, economic, and geographic data on aspects of the region’s fisheries. A portion of these data relate
___________________
1 50 C.F.R. § 648.74 (a)(1)(C).
| Fishery | Permits | Rights | Comments |
|---|---|---|---|
| Shellfish | |||
| American Lobster | Vessel |
|
|
| Atlantic Sea Scallop | Vessel |
|
|
| Vessel |
|
|
|
| Atlantic Surfclam | Vessel |
|
|
| Deepsea Red Crab | Vessel |
|
|
|
|
||
| Ocean Quahog | Vessel |
|
|
| Finfish | |||
| Northeast Multispecies (13 species complex including cod, haddock, halibut, yellowtail flounder) | Vessel |
|
|
| Squid, Mackerel, Butterfish | Vessel |
|
|
| Atlantic Herring | Vessel |
|
|
| Atlantic Spiny Dogfish | Vessel |
|
|
| Black Sea Bass | Vessel |
|
|
| Fishery | Permits | Rights | Comments |
|---|---|---|---|
| Bluefish | Vessel |
|
|
|
|
||
| Golden Tilefish | Vessel |
|
|
|
|
||
| Scup | Vessel |
|
|
NOTES: Does not include species managed outside of the New England or Mid-Atlantic fishery management councils, such as those managed by NMFS Highly Migratory Species Branch. The table also does not include species whose management is chiefly under the Atlantic States Marine Fisheries Commission. Species are organized alphabetically within broad categories of shellfish and finfish. For each species, or species complex, the committee provided a summary of the permits, the rights associated with the permits, and any important factors related to the flow of benefits to permit and quota holders. ACL = Annual Catch Limit; ACT = Annual Catch Target; CPH = Confirmation of Permit History; eVTR = electronic Vessel Trip Report; IFQ = Individual Fishing Quota; ITQ = Individual Transferable Quota; VMS = Vessel Monitoring System; VTR = Vessel Trip Report.
directly to permit and quota holders. Voluntary surveys were conducted in 2011, 2012, and 2015 to estimate business costs. The original survey collected information on the primary landing and mooring ports, marital status, age, race, educational attainment, years in the fishery, and language at home, as well as a range of information on costs. However, NMFS staff indicated that there were negative reactions to the survey during pretesting in 2011, and many of the demographic data collection questions were removed. The constraints noted above have hampered efforts to undertake analyses of the socio-ecological fishery systems in the Northeast to assess where and to whom the benefits of fishery management actions accrue. The NOAA Voices Oral History Archive has also been used to provide data on where and to whom the benefits of fishery management action accrue.
As with other Councils and Regions, the NEFMC, the MAFMC, and GARFO are required by law to conduct impact assessments of their management actions, including the allocation of permits and quota. It has proven possible to integrate aspects of the permit database, with mandatory landings and dealer reports with social data streams for the region. Some of these data are available online.2 Although dominated by economic data (e.g., revenue, average price, days at sea) these analyses have expanded to move beyond economic data to include social impacts (Clay and Colburn, 2020). The site provides a “fishing engagement index score” which is estimated for each port, for each fishery, and overall (Jepson and Colburn, 2013). These data are based on vessel trip reports that are synthesized and aggregated to provide data at the annual level. The fishing engagement index score is a linear combination of factors resulting from a principal components analyses of vessel trip report data from each port. Variables included in the analyses were the value of landings, the number of commercial fishing permits, the number of dealers with landings, and the total amount of landings. The indices were then categorized based on their standard deviation from the
___________________
2 See https://apps-nefsc.fisheries.noaa.gov/socialsci/pm/index.php.
overall as High, Medium High, Medium, Medium Low, and Low. Communities with high engagement indices are considered more dependent on the commercial fishery or fisheries.
Gulf of Mexico Fisheries
The Gulf of Mexico provides another complex example of considering the distribution of commercial and for-hire fisheries benefits. NOAA’s Southeast region includes three regional fishery management councils (Gulf of Mexico, Caribbean, and South Atlantic) spanning from North Carolina through Texas, as well as Puerto Rico and the U.S. Virgin Islands. The Southeast region involves more than 160 federally managed species and 17 fishery management plans including some of the largest recreational fisheries in the country. The Gulf of Mexico Fishery Management Council (GMFMC) has nine distinct fishery management plans: reef fish, shrimp, coastal migratory pelagics, red drum, spiny lobster, stone crab, coral, essential fish habitat, and aquaculture. Within the reef fish fishery, red snapper and grouper-tilefish are both managed under individual fishing quotas. In both the South Atlantic and Gulf of Mexico, commercial fisheries for shrimp and both commercial and for-hire fisheries for reef fish and coastal migratory pelagic species are managed under limited access privilege programs with vessel permits required for federal waters.
Within the Gulf of Mexico, many entities including the NOAA Southeast Fisheries Science Center (SEFSC), NOAA Southeast Regional Office (SERO), GMFMC, state resource management agencies, and academic institutions have conducted social science research characterizing the regions fisheries. The Gulf of Mexico is a particularly useful region for considering the unique context and challenges of characterizing for-hire fisheries. Federal reef fish and for-hire permits have been under a moratorium since 2004 (GMFMC). For-hire fisheries are characterized by two general types of vessel and business models: charter boats and headboats. Charter boats typically carry fewer passengers and charge a single fee for the vessel, whereas headboats usually carry more passengers and charge per person. Previous social science studies of for-hire fisheries in the Southeast provide some insights on demographics within the fisheries. One of the oldest studies, conducted in 1987–1988, measured several demographic characteristics of fishing captains, including age, gender, race, education, income, and marital status (Gill et al., 1993). A key finding of the survey was that the average charter boat operator was a 45-year old male, with more than 13 years of operating experience and 12 of those years with the same home port, indicating high place attachment.
However, socioeconomic data on for-hire fisheries was also at the center of a recent legal conflict leading to the court-ordered suspension of the Southeast For-Hire Integrated Electronic Reporting program in the Gulf of Mexico. This program required vessel owners or operators with federal charter/headboat permits for Reef Fish or Coastal Migratory Pelagic Species to notify NMFS before departing on any trip; submit electronic fishing reports with GPS position data for each fishing trip; and “other details of the trip,” including socioeconomic data. A major issue in the court ruling was whether or not data such as charter fee, fuel price and use, number of paying passengers, and number of crew for each trip constituted socio-economic data; the overturning court ruling deemed that the costs and benefits of collecting these data were not sufficiently assessed and could negatively impact small fishing businesses. The current state of the program also highlights the debate over the value of voluntary data, which NOAA currently discourages voluntary reporting noting limited utility and potential confidentiality limitations. The southeast has conducted extensive social and economic profiles of the regions fishing communities. For instance, a 2006 report prepared for NOAA described a comprehensive mixed-methods assessment of Alabama and Mississippi fishing communities that involved compiling permit, license, landings, and census information, as well as conducting key informant interviews and observational fieldwork to characterize local fleets and infrastructure (Petterson, 2006). For each community, the report qualitatively described the fishing
environment, including primary fleets, species landed, shore-side infrastructure, and more. Census data were used to describe the demographics of each community and how they changed over a 10-year period between 1990 and 2000. These efforts and the report helped lay the groundwork for NOAA’s Fishing Community Profiles and Community Snapshots. However, updates are needed to characterize the current state of each community given the vast amount of change that has happened within the region and fisheries.
More recently, social science research has been focused on the regions IFQ fisheries. In the most recent review titled “Red Snapper and Grouper-Tilefish Individual Fishing Quota Programs,” (GMFMC, 2021), NOAA Social Indicators for Coastal Communities data were used to help characterize the social environment of fishing communities alongside individual fishing quota performance indicators (Table 3-2). The analyses were conducted by linking permit-level information to community-level indicators associated with the mailing address of each shareholder, which highlight some common challenges for assessing the distribution of permits or quota. For instance, individual fishing quota allocations linked to vessel accounts can be associated with individuals or businesses making it difficult to characterize the social implications for individual beneficiaries and communities. These analyses still helped characterize the current social environment of the fishery, with one key finding that 20.1–33.5% of shares were held by accounts that were not associated with fishing permits.
In summary, there is a long history of collecting social science data for characterizing the social and economic dimensions of Gulf of Mexico fisheries. There have also been efforts to integrate this information into management consideration, including detailed “Social Environment” or “Environmental Justice’’ sections within proposed management frameworks or reviews. While many social and economic analyses have focused on community-level and composite indicators, SERO has been collecting certain demographic data (race, ethnicity, sex) on commercial and for-hire vessel, dealer, and operator permit application forms since 2017.3 However, the Gulf of Mexico also illustrates many of the challenges for comprehensively assessing how the benefits of fisheries management are distributed. For instance, SERO was recently informed by OMB that they would no longer approve any mandatory data collection efforts for demographic or small business data (Travis, 2023).
TABLE 3-2 Individual Fishing Quota (IFQ) Performance Indicators
| Performance Indicator | Definition | Timeframe |
|---|---|---|
| Engagement Index | Index consisting of pounds and value of IFQ species, number of permitted reef fish vessels, number of IFQ species dealers within a community | 2012–2018 |
| Regional Quotient (pounds and value) | Community landings of IFQ species divided by total landings of IFQ species in the region | 2012–2018 |
| Catch Share Program Local Quotient (pounds and value) | Community landings IFQ species divided by total landings (all species) in the community | 2012–2018 |
| Community Social Vulnerability Indicators (CSVIs) | Social Vulnerability Indicators: Poverty Index, Population Composition Index, Personal Disruption Index, Housing Characteristics Index, Labor Force Structure Index Gentrification Pressure Vulnerability Indicators: Housing Disruption Index, Retiree Migration Index, Urban Sprawl Index |
2012–2016 American Community Survey 5-Year Estimate |
SOURCE: Gulf of Mexico Fishery Management Council.
___________________
3 Permits Applications and Forms in the Southeast | NOAA Fisheries, see https://www.fisheries.noaa.gov/southeast/resources-fishing/permits-applications-and-forms-southeast#dealer-application.
North Pacific Fisheries
The North Pacific region is generally considered “data rich” and comes close to the stylized model fishery described above. Information regarding allocations of permits and quotas is publicly available and, in many cases, extends back in time to the beginning of (and sometimes before) the initial allocations. However, the contextual underpinnings of the initial allocations and deficiencies in the information collected prevent a full accounting of the distribution of benefits derived from the allocation of permits and quotas in the North Pacific Region.
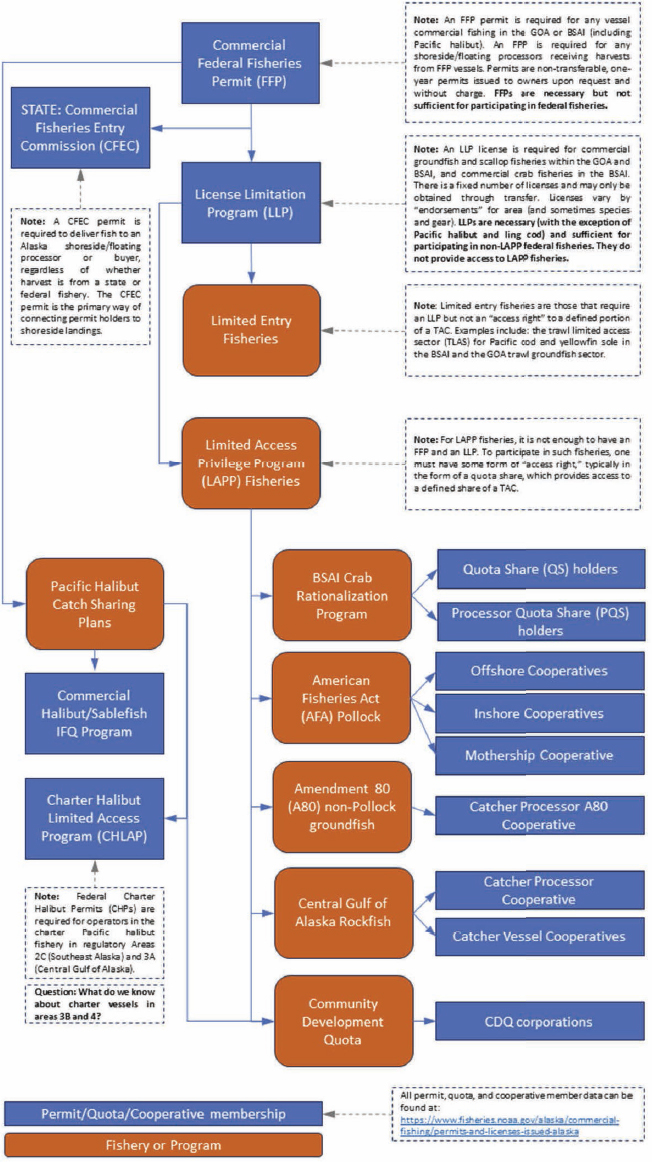
The North Pacific Fishery Management Council (NPFMC) is responsible for managing the fisheries in the Exclusive Economic Zone (EEZ) 3–200 miles off the coast of Alaska. Management of North Pacific fisheries is generally divided across four fishery management plans: Bering Sea and Aleutian Islands (BSAI) groundfish, Gulf of Alaska (GOA) groundfish, BSAI king and Tanner crab, and scallops. The management of such fisheries varies from harvester cooperatives to individual transferable quotas to limited and regulated open-access systems. Figure 3-1 lists the principal fisheries in the North Pacific region.
Commercial fishing vessels in the North Pacific must have a federal fisheries permit, which is nontransferable, 1 year in duration, and issued to vessel owners on request and without charge. Applications for a federal fisheries permit require the vessel’s name, Coast Guard number, State of Alaska registration number, and primary owner’s name and address. The permit is a necessary condition for fishing in federal waters but is insufficient on its own. Additional permissions (i.e., permits and/or quotas) must be obtained to participate in specific fisheries. Thus, a federal fisheries permit alone does not confer the right to access (or benefit from) a fishery in the North Pacific region.
In addition to a federal fisheries permit, a License Limitation Program (LLP) license is required (with some exceptions) onboard any vessel participating in commercial groundfish fisheries within the BSAI and GOA, crab fisheries in the BSAI, and scallop fisheries in the BSAI and GOA. In 1992, the NPFMC took action to limit participation in several commercial fisheries by adopting a moratorium on the entry of additional vessels. The moratorium on entry was eventually replaced by the LLP in 2000. While the moratorium placed a limit on the number of vessels that could participate, in practice, there were far more vessels than were necessary to efficiently harvest the total allowable catch for the target species. As such, vessels in the remaining fleet competed with each other to secure shares of the total allowable catch, both by racing for fish on the fishing grounds and by competing for apportionments of the total allowable catch within the council process itself. The result was an array of amendments to the fishery management plans that apportioned total allowable catch across gear, vessel sizes, and types.
LLP licenses are transferable and issued with endorsements, which provide permission to fish in particular areas or target particular species. For some limited-entry fisheries, an LLP license represents an access right as it permits the license owner to fish for an undefined share of the fishery’s total allowable catch. Examples include the trawl limited access sector for Pacific cod and yellowfin sole and the GOA groundfish trawl sector. For other fisheries, additional permissions are needed to participate. For example, in fisheries with limited access privilege programs, which provide members with a defined portion of a total allowable catch, participation requires an additional access right, usually in the form of a quota share. Examples include the BSAI Crab Rationalization fisheries, the American Fisheries Act pollock fishery, the Amendment 80 nonpollock groundfish fisheries, and the halibut/sablefish individual fishing quota fisheries.
The NPFMC also oversees the Charter Halibut Limited Access Program, a for-hire fishery for halibut in Southeast Alaska and the GOA. Starting in 2011, the program allocated a limited number of charter halibut permits, each of which are endorsed for a particular area and number of anglers. A permit confers the right to operate a for-hire halibut charter business within the endorsed area,
NOTE: BSAI = Bering Sea and Aleutian Islands; IFQ = individual fishing quota.
subject to annual harvest restrictions determined by the Halibut Catch Sharing Plan, which establishes harvest allocations between the charter and commercial halibut fisheries.
Unlike the stylized model fishery depicted previously, permits and quotas are allocated to a variety of entities, thereby complicating the assessment of where and to whom fishery benefits accrue. In many cases, permit and quota allocations can be held by either an individual owner or an LLC and may not be separable from a vessel. Furthermore, in addition to vessel owners, some programs also issue quotas to processers, captains, crew members, and communities. For example, the Crab Rationalization Program issues a small amount of quota share (3 percent) to captains and crew, in addition to processor shares, which requires harvesters to deliver a defined portion of their quota to shareholding processors (see, e.g., the economic report within the Crab Stock Assessment and Fishery Evaluation report in 2021 for a discussion of these challenges [Garber-Yonts and Lee, 2021]). In addition, the Community Development Quota (CDQ) Program allocates a portion (7.5–10 percent) of all BSAI quotas for groundfish, halibut, and crab fisheries to six CDQ entities representing 65 western Alaskan communities (see Box 3-1). Assessing where and to whom benefits accrue is further complicated in the for-hire charter halibut program, as the permit holder, vessel owner, guide, crew, and angler may all be different individuals.
NMFS maintains publicly available databases of all permit and quota allocations (see Table 3-3). Such databases generally include the name of the individual, company, or community entity to which the permit or quota is issued, the amount of quota issued (if applicable), the name or registration number of the vessel associated with the permit or quota (if applicable), and the address of the permit or quota owner. Aside from geographic residence, demographic data are often absent from these databases. Based on these databases alone, it is possible to determine the distribution of the number of permits and the size of quota allocations across communities (based on the registered address of the permit/quota/vessel owner) and how this distribution has changed over time.
Additionally, several confidential databases contain information regarding the monetary value of permits and quotas, although they are not comprehensive. For example, NMFS collects economic data reports (on a mandatory basis) for a subset of limited access privilege programs in the North Pacific. These reports contain detailed information on operating revenues and costs of the permit and quota holders. NMFS also maintains databases recording permanent transfers (and their values) of permits and quotas for several limited access privilege programs. The Alaska Department of Fish and Game
TABLE 3-3 Permits and Licenses Issued in Alaska by the National Marine Fisheries Service
| Quota or Permit Program | Quota/Permit Holder Information Available | ||||
|---|---|---|---|---|---|
| Name | Considerations for Linking to the Benefiting Individuals | Community Data (Registered Address) | Cost and Earnings Data | Demographic Data | |
| American Fisheries Act (AFA) pollock fishery | Yes |
|
Yes |
No
|
No |
| Crab Rationalization (CR) Program harvesters | Yes |
|
Yes |
Yes
|
No |
| CR Program processors (this program issues processing quota shares [PQS]) | Yes |
|
Yes |
Yes
|
No |
| Amendment 80 (A80) (Bering Sea and Aleutian Islands nonpollock flatfish) | Yes |
|
Yes |
Yes
|
No |
| Halibut and sablefish individual fishing quota (IFQ) program | Yes |
|
Yes |
No
|
No |
| Community Development Quota (CDQ) Program | Yes, for CDQ and can buy into the CR and IFQ programs |
|
Yes |
|
Some - At the community level |
| Charter Halibut Permit (CHP) holders | Yes |
|
Yes |
Yes
|
No |
| Gulf of Alaska (GOA) rockfish program | Yes |
|
Yes |
Some
|
No |
| LLP license holders | Yes |
|
Yes |
No
|
No |
| Federal fisheries/federal processing permit (issued freely and are not limited) | Yes |
|
Yes |
No
|
No |
| Pacific cod trawl cooperative program (new) | Yes |
|
Yes |
No
|
No |
NOTE: A80 = Amendment 80; AFA = American Fisheries Act; AFSC = Alaska Fisheries Science Center; CDQ = Community Development Quota; CHP = Charter Halibut Permit; CR = Crab Rationalization; EDRs = Economic Data Reports; GOA = Gulf of Alaska; IFQ = Individual Fishing Quota; LLP = License Limitation Program; PQS = Processing Quota Shares.
SOURCE: Modified from Marrinan (2023).
also maintains a comprehensive record of all commercial fishery landings, which can be linked to the permit/quota holder and the processor/buyer receiving the delivery. Thus, it is possible to distinguish between the geographic location of where harvests are landed from the geographic residence of the permit/quota holder, which has been shown to be important for tracking the flow of downstream benefits from fisheries (Watson et al., 2021).
MEASUREMENT OF CATEGORIES OF DATA AND INFORMATION
The regional examples highlight the heterogeneity in data available on federal fisheries and the importance of understanding the contextual underpinnings of the data-generating processes. Conditional on that understanding and the data available, researchers summarizing the different categories of data and information will generally consider two types of variables as they analyze the to whom and to where benefits accrue.
First, there are those variables that are observed whose distributions could be simply plotted in any year and across time, such as number of permit and quota owners, landings, and age as derived from birth year. These variables could also be mapped to fishing communities and aggregated across the entire region as long as they can be supplemented with geographic information. This type of tracking is consistent with MSA requirements to report on the social and economic status of fisheries in Stock Assessment and Fishery Evaluation (SAFE) reports. In this section, we also explore the quantitative and qualitative data necessary to measure the monetary and non-monetary benefits associated with permit and quota ownership.
The second set of variables requires additional computation; these variables approximate unobserved information, such as personal identifying information that is not generally collected (e.g., gender, ethnicity, race) and monetary and nonmonetary values associated with ownership. For example, if gender information is not collected, quantitative methods using machine learning techniques are available for associating names listed on the permit and quota ownership information with gender. For instance, Szymkowiak (2020) analyzed name and birth year on Alaska permit holdings data using algorithms trained on social security and other datasets that provide names and gender information. Other machine learning algorithms could be used to estimate ethnicity and race associated with ownership of permits and quotas (see, e.g., Wong et al., 2020). These techniques are obviously inferior to explicit data collection and there are important limitations to their use (see, e.g., Lockhart et al., 2023), but the methods do provide estimates of categories of information to be summarized within a fishery across time and across fisheries over time. Szymkowiak (2020) combined these quantitative data measures with qualitative methods (e.g., focus groups) to develop a more in-depth and informed picture of women’s participation in Alaska fisheries.
When measuring the monetary and nonmonetary benefits associated with an allocation, the nature of the rights associated with an allocation is critical. Conceptually, the most straightforward case for measuring the monetary value of an allocation is a single limited access fishery in which quota shareholders are allocated a right to a defined share of a total allowable catch. If quota shares are tradable and the market for quotas is well functioning, the quota prices reflect the (marginal) economic value of a quota allocation (see, e.g., Kroetz et al., 2015; Newell et al., 2007). In many respects, when these conditions apply, the quota price would be consistent with the first type of variables discussed above. If the quotas are not tradable and/or prices are not observable, however, then the net present value of the flow of fishing profits over the life of the allocated right would reflect the economic value of a quota allocation. Measuring fishing profits, however, is difficult given the paucity of cost data collected (Holland et al., 2015). Even in fisheries with a limited access privilege program, complications arise when the program covers multiple species that are jointly caught, as it becomes difficult to disentangle the value of any single fishery in the complex (Hatcher, 2022; Reimer et al., 2022).
In fisheries without a limited access privilege program, allocations do not confer the right to a defined portion of a total allowable catch. What is the (monetary) value associated with such an allocation? If permits are transferable (and limited) with a well-functioning market for the permits, then the permit price would reflect the (marginal) value of a permit allocation (Huppert et al., 1996). But what if permits are not transferable, not limited, or permit prices are not observed? What is the value associated with such an allocation, and how does one go about measuring it? There are no easy answers to these questions, and they are likely context dependent. Measurement of economic values in the fisheries will require additional data collection efforts on the costs of fishing.
The nature of rights associated with permit and quota ownership also impacts the non-monetary and sometimes non-quantifiable benefits associated with owning and participating in the fishery, such as identity, belonging, sense of place and place attachment, pride in work, continuation of subsistence practices, food sharing, status and social capital, and maintenance of social networks, among others (Donkersloot et al., 2020; Reedy and Maschner, 2014; Severence et al., 2013; Satterfield et al., 2013). A range of social science methodologies, and approaches utilizing quantitative and qualitative data and information has been developed to better measure specific non-monetary benefits. We return to the critical importance of multiple data types (and methods) in Chapter 5 both for fisheries management in general and an integrated approach to addressing equity in particular. Briefly, however, the committee highlights examples such as richly detailed ethnographic fieldwork, cultural content analysis, cultural model interviews, surveys, and focus groups as well as Indigenous methodologies that center relationality and reciprocity in research design and methods (Kovach, 2010). Moon et al. (2018) reviewed common social science research methodologies in conservation decision-making (see also Chan et al., 2012; Gregory et al., 2023). Recently, researchers have focused on developing indicators or metrics aiming to quantify (and rank or weight) difficult-to-measure, and sometimes nonquantifiable, social and cultural benefits and values (Breslow et al., 2017). Norman et al. (2022) provides an example of an approach that seeks to “groundtruth” secondary data—in this case, fishing community–level measures collected via summaries of Community Social Vulnerability Indicators (CSVIs), with primary individual-level collected survey data on fishers’ views on their livelihoods, social milieus, and community identities. Research also shows that it is possible to estimate quantitatively some of these nonmonetary (nonpecuniary) benefits, especially ones that are more uniform across permit and quota owners by decomposing permit prices into the component stemming from the economics of the fishery (e.g., prices, costs, stock sizes) and the component that is not described by the economics or the nonpecuniary benefits of owning and fishing a permit (Karpoff, 1985).
Regardless of which approach is pursued ultimately, methodological approaches have limitations and consequences, especially when it comes to attempting to develop policy-relevant “measures” of culture (Satterfield et al., 2013). Sterling et al. (2020) highlights important considerations in indicator development, such as scale- and place-based contexts, and identify well-known tradeoffs and measurement challenges in local contexts (see also Breslow et al., 2017). The authors note that “trade-offs arise when there are differing values across levels. Many indicators are based on social norms that may not be applicable in all cultural contexts, and good intentions about navigating tensions between policy priorities, power structures, and principles of equity can actually lead to trade-offs within a system that result in social harm (Fisher and Fukuda-Parr, 2019; Kulonen et al., 2019).”
OBSTACLES IN DATA AND INFORMATION COLLECTION AND MEASUREMENT
In a world where fisheries in each region had similar characteristics and similar data collection and management protocols, the committee might recommend wholesale change to the collection of socio-economic data by the agency. A comprehensive statistical survey of all qualified permit holders might be the preferred path, especially as NMFS moves toward operational approaches regarding equity rather than simply a collection of ad hoc efforts under the research aspects of the organization. However, the committee also understands the context within which socioeconomic data collection currently occurs. These make a single survey ill-suited to the task at hand and likely impossible given the Paperwork Reduction Act (PRA) and Privacy Act requirements. The committee applauds the social scientists within NMFS for their efforts to stitch together databases from the diverse array of permit programs, permit qualifications, and voluntary data collection programs.
This chapter focuses its discussion of obstacles for data collection and measurement on permit and quota owners and measuring the distribution of ownership benefits. Not all federal commercial fisheries require permits, so permit allocation cannot be used as a single measure of benefit distribution. In other cases, permits can be owned by vessels, publicly traded corporations, banks, or LLCs. In these cases, collecting the relevant demographic information on the individuals fishing the permit might require additional data collection efforts, which would be subject to the PRA and budgetary issues. This complex pattern of permit ownership complicates analyses of where and to whom benefits accrue. Even in fisheries where the permits are allocated to individuals, there are prohibitions on the mandatory, or perception of mandatory, collection of demographic information (e.g., asking for the information on the same page as the information required for a permit). Demographic information can be collected during the permit application process if it is made clear to the applicant that the information is voluntary, and no demographic status can be used as a precondition for the issuing of permit. According to the information provided to the committee, mandatory data collection of this personal or business identifying information is only permissible under the PRA, Systems of Records Notice (SORN), and Privacy Act if it is explicitly part of NMFS’s legislative mandate. Based on the current interpretation of rules on personal and business identifying information and the needs of NMFS to collect this information, a short-term solution could be to invest in partnerships with universities, think tanks, states, and nongovernment organizations to collect this information. In the long term, it will be important for NMFS invest in means of ensuring that the routine collection of this information is understood by all parties to be integral to meeting the National Standards of MSA in a similar spirit to that of biological data collection programs. These investments could be informed by looking at how other federal agencies, such as the U.S. Department of Agriculture (USDA), collect personal and business identifying information.
Voluntary data collection efforts can provide valuable information especially when response rates are high. With low response rates, the sample’s representativeness of the larger set of permit owners becomes an important question. Without a full sampling frame, even assessing the adequacy of the sample can be difficult. If, for example, this process only yields responses from less experienced fishers or from fishers residing in only a few communities, then analysts will receive an incomplete and potentially misleading picture of the distribution of permit ownership. The representativeness issue is true at the fishery scale (e.g., only a subset of permit owners for species Y in region X respond), at the regional scale (e.g., aggregating fishery-level data to the region to develop regional summaries), and at the national scale (e.g., developing national-level demographic information or comparing regions). The issue is also important for comparing changes across time, as it is not clear whether and how the representativeness of the sample will change from year to year.
Data on distribution have many potential uses within fishery governance, from surveillance, to predictive modeling of new fishery management actions, to assessing current and past actions.
Along with the representativeness of the sample, the frequency and method of collecting this information are important considerations that need to follow directly from its primary uses. For example, using a new survey instrument to collect information on a cycle of every 5 years might be acceptable for general surveillance of changing personal identifying information, which could be used alone (as reported, e.g., in SAFE documents) or developed in community summaries. A 5-year survey may also be useful in identifying emerging trends and/or research and policy priorities. There is precedent for this type of information to be collected by the U.S. government. For example, the USDA Census of Agriculture collects myriad demographic and economic data on the nation’s farmers, is mandatory, and provides important information that can inform the reauthorization of the Farm Bill, which occurs every 5 years. Yet, 5 years might not be sufficiently frequent for predictive modeling of a regulatory action or for assessing changes due to past fishery management actions. Utilizing permit applications, which are filled out each year, could provide higher-frequency data across more federal permitted fisheries than a new survey instrument—but with the caveats mentioned above. The combination of the diversity of needs across regions, the multitude of uses, and uncertainty on the means of and the frequency with which to collect the information are real challenges. At the same time, these conditions create a ripe environment for allowing experimentation that could lead to learning across the regions, but at the cost, at least in the short term, of developing a comprehensive national picture of ownership and participation of federally managed fisheries.
Another challenge with measurement of the distribution is matching the unit of analysis to the appropriate scale of the assessment of distributional equity. For example, permit and quota owners are by definition connected to a fishery, but the appropriate scale of assessment might be at the community level. The appropriate scale could be a region as entities often participate in multiple fisheries within a region, with changes in one fishery influencing outcomes in other fisheries (see, e.g., Kroetz et al., 2019).
With all the potential uses and challenges with collecting and measuring this information, the lack of a guidance document for the regional councils on how to interpret and utilize the information in the development of management plans can undermine support for these efforts and introduce friction that slows down adoption of best practices. A guidance document could include information on (1) how to present this information in SAFE reports; (2) how to utilize it in Fishery Management Plans or Fishery Ecosystem Plans beyond current efforts, which include reporting requirements related to the National Environmental Policy Act (NEPA) (e.g., social impact analysis and the impacts on small businesses); and (3) how to consider the equity implications of past management decisions when developing new management plans (see Chapter 5 for further discussion).
A significant obstacle in moving from acquiring and analyzing identifying information as a collection of ad hoc research outputs to implementing in operations is the lack of social science research expertise within the agency and the limited funding allocations. Simply stated, social science within the agency remains principally a small-scale research effort and not the operational system it needs to become if NMFS is to meet the commitments in the Equity and Environmental Justice Strategy. A number of NOAA Science Advisory Board reports have made similar arguments for increasing the human and financial capacity at NOAA to undertake social science (SAB SSRP, 2003; SSWG, 2009). For example, the 2003 report of the Social Science Review Panel of the NOAA Science Advisory Board concluded, “The capacity of National Oceanic and Atmospheric Administration (NOAA) to meet its mandates and mission is diminished by the underrepresentation and underutilization of social science” (SAB SSRP, 2003). While the motivations of those reports do not align precisely with measuring and assessing equity in fishery management, the arguments apply, maybe even more so, when considering NMFS’s mandates to account for the diversity of values, benefits, and impacts linked to fishery management (as outlined in Chapter 2; see also, e.g., Clay and Colburn, 2020, Gilden, 2005; Gregory et al., 2023; NPFMC, 2023).
Key to developing plans for expanding capacity is a needs assessment within each fishery management region and at the NMFS national offices, as there are many approaches from focusing on hiring entry-level staff social scientists, to hiring from the Senior Scientist level all the way to entry-level. The committee is not prescribing a plan but notes the potential importance of senior leadership (e.g., Lead Social Scientist position akin to the Lead Economist position in NMFS) on these issues. Furthermore, the committee recognizes that social science expertise and leadership should not be conflated with the need for investing in other areas of leadership and capacity. For example, the committee recognizes the high value of positions such as a NMFS Senior Advisor on fisheries and tribal engagement. While not social science, such positions represent inclusion and perspectives that are critical to appropriately conceptualizing and assessing equity. Champions are necessary to improve the visibility and emphasize importance of equity considerations within NMFS, and potential funding allocations.
WHAT CAN NMFS DO NOW?
In this chapter, the committee used a stylized model fishery in which all necessary data were collected for assessing the distribution (where and to whom) of benefits of permit and quota allocation. The committee noted that few, if any, federal fisheries meet this standard. In the section on methodology, the committee examined substantial regional variations in the approach to allocating permits and quotas that will hinder any standardized assessment of distributional equity in the nation’s fisheries. In combination, these observations indicate clearly that the data currently available are insufficient for conducting a comprehensive assessment of the distribution of benefits resulting from the issuance of permits and the allocation of quotas.
This is not to suggest, however, that until all such barriers and hurdles are overcome, no progress can be made in assessing the distribution of benefits arising from permits and quotas. Indeed, the committee heard from social scientists and senior agency staff who showcased the high-quality social science research being conducted within NMFS and with its partners. This section considers actions NMFS can take now and in the short term given its current capacity.
Continue to Expand on and Adapt Current Approaches
The committee appreciated the quality and range of analyses that have or are being undertaken by current NMFS and council staff. The nation’s regional approach to fisheries management creates challenges for standardization, but also provides a testbed for different methodologies for advancing equity considerations in data and information development.
Expand and Advance Dashboards
NMFS scientists are already making an increasing amount of their data available publicly. The agency deserves congratulations on these efforts. More could be done with existing data that would provide a greater context for assessing the flow of where and to whom benefits of the issuance of permits and the allocations of quotas accrue. Other elements of current dashboards could be updated with existing data that would represent important first steps to assessing multiple dimensions of equity. For example, NMFS goes to great length to encourage public input. The committee are of the opinion that currently such attendance lists are used primarily to drive mailing lists. However, these data do provide information on participation. Generating simple metrics of the distribution of public input by role for each fishery would begin to formalize efforts to report representational equity. The committee recognizes that such simple metrics are vulnerable to letter writing campaigns and likely have attending biases, but the simple act of seeing members of your group rec-
ognized is powerful in and of itself. Such data may also provide NMFS and Councils indications of which approaches to gathering public input are effective for particular groups and for which groups particular approaches are ineffective. NMFS and Councils already recognize that not all public meetings are fully accessible to all groups because of travel costs or time. Similar efforts could formalize participation beyond attendance and could try to capture the source of questions and feedback.
Similarly, NMFS can start to characterize the distribution of the primary benefits of fishery management decisions through enhancements to dashboards. The committee presents data in this chapter on the pattern of ownership in the Surfclam fishery in mid-Atlantic region. Such data are easily communicated in dashboards, similar to ones in existence currently. For example, it would be possible for NMFS staff to amend the Surfclam dashboard with a simple graph that shows patterns of ownership of permits by ownership category, and or by geographic region. Similar graphs could be added to dashboards for other species. These simple figures serve two important purposes. First, they provide information on the dynamics in individual fisheries. Second, they telegraph NMFS interest in and intent to measure distributional equity in fisheries. The committee recognizes that confidentiality concerns may limit the extent to which these recommendations are feasible within all regions and nationally.
One specific example that may serve as an example of enhancements to current dashboards relates to newly required periodic reviews of LAPP programs. Reviews are triggered by either public interest-based, time-based, or indicator-based triggers. When triggered, this policy requires NMFS and Councils to consider the various ways different user groups receive a benefit from that allocation. It is intended that these analyses are summarized in dashboards that are readily accessible to the public.
NMFS is making progress on integrating socioeconomic data into analyses and assessments of the nation’s fisheries as a means of informing an understanding of to whom and to where the benefits accrue. The CSVI Toolbox4 is a clear example of progress on the “to where” front. Some regions are beginning to apply these approaches.
As a clear example of NMFS’s progress, the NEFSC’s web application produces a dashboard of economic and social indicators.5 This site provides a number of economic and social metrics for the GARFO-managed fisheries, both separately and aggregated at the regional level. For each species, the site displays economic data including the number of vessels, the number of trips, and the number of days at sea, together with associated revenue. Data are derived from several sources, presumably. As permits are granted to vessels, which captures “to whom,” the number of vessels displayed could be drawn from the permit holder database. The number of trips and days at sea are derived presumably from mandatory vessel trip reports. Similarly, revenues are likely derived from mandatory vessel trip reports and dealer reports.
The dashboard includes a community-based Fisheries Engagement Index Score (Jepson and Colburn, 2013); currently, this largely summarizes economic data. It would be useful to expand the dashboard to include graphics that characterize the distribution of permit ownership (individual, multiple, corporate, vessel owner, or crew), and the geographic distribution of permits based on the zip code of the mailing address and on the principal port reported for the vessel landings. Once permit holdings are identified by zip code, these data can probably be linked to social metrics beyond those currently provided (see Chapter 4 on expanding the scope of beneficiaries and benefits). The committee encourages NMFS to integrate indices from its CSVI Toolbox into such dashboards, as has been achieved in the NEFSC State of the Ecosystem Report for 2022 (Figure 3-2; NEFSC, 2023).
___________________
4 See https://www.fisheries.noaa.gov/national/socioeconomics/social-indicators-coastal-communities.
5 See https://apps-nefsc.fisheries.noaa.gov/socialsci/pm/index.php/programs/ne.
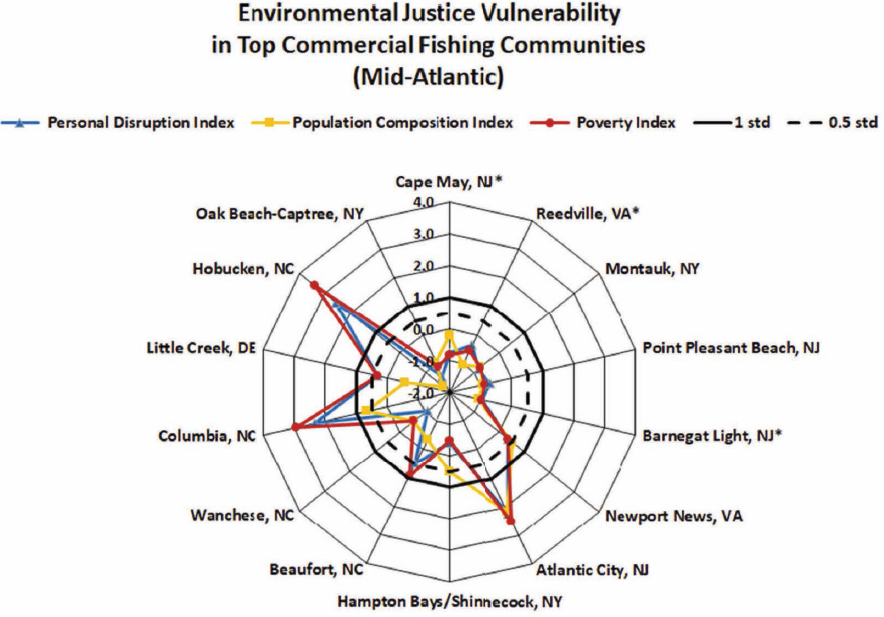
SOURCE: NEFSC (2023).
If NMFS chooses to expand and improve its dashboards, an important component will be developing processes for supporting continual updates to the dashboards to ensure information is current. The processes likely require work on database structures, data access, and development of repeatable code. It would be advantageous if these enhancements can adopt an Open Science/Open Data approach (Fredston and Lowndes, 2023). Additionally, adequate staff time on the part of database and website managers as well as staff with the contextual knowledge to identify problems with outputs will be critical. Organizing and making this data publicly accessible provides an avenue for improved decision-making and transparency. First, timely availability of these summary statistics will support council staff. Specifically, having this information on hand reduces the burden of integrating it into any proposed rulemakings. A second potential use in the management process is that timely and accessible information provides the public with an opportunity to review the information. To the extent that there are public comments related to aspects of analyses of socioeconomic outcomes, the public would have access to a version of the raw data to support comments.
Expand and Enhance Collaborations
Partnerships in equity-related work in fisheries are both necessary and powerful. This section covers partnerships within the agency and with external bodies and organizations. Partnerships have the potential to improve levels of engagement among traditional fishing communities, underserved communities, and Tribal Nations and Indigenous communities. Partnerships may also assist NMFS in accessing categories of data that are currently difficult to collect under federal authorities.
Given the continual challenges to increasing full-time positions, short-term ways for current social scientists to expand their reach, productivity, stature, and profile within NMFS could include institutionalizing support for communities of practice. These could include partners outside NMFS (e.g., academics, nongovernmental organizations, local community leaders, tribal representatives) and be developed within each region to focus on regional context, and across regions to develop best practices and foster learning. For example, communities of practice have made progress in the field of stock assessment, including national workshops that engage directly with regional fishery management councils. The councils’ science and statistical committees have convened nationally seven times since the first workshop in 2008. Most have focused on questions of stock assessment and stock status determination. The fourth workshop included a focus on social science, as a part of an overall focus on ecosystem-based approaches. However, discussions focused mostly on economic questions and not a broader perspective of social sciences (Seagraves and Collins, 2012). In a similar fashion, the social science communities of practice could formally work to address the obstacles to collecting distributional data, analyzing them, and synthesizing them for the regional councils. The committee heard testimony of noteworthy past and ongoing efforts, such as the social science workshop in 2014 hosted by the Western Pacific Regional Fishery Management Council, which provided an overview of the needs across the regions to consider equity through the NEPA social impact assessment reporting requirements. The committee sees the potential for current efforts along these lines to be used to develop a more robust national approach to operationalizing the development of communities of practice for the assessment of equity in fisheries management.
As a part of a community of practice, NMFS could consider further investments in the NMFS-Sea Grant Fellowship program, which currently supports graduate students training the areas of stock assessment, ecosystem dynamics and fisheries economics to include a fuller range of social sciences. The committee recognizes that the ecosystem dynamics area does call out social and human dimensions in describing areas of interest. However, expanding the program with additional resources to include parallel tracks in stock assessment and ecosystem dynamics, fishery economics, and fishery social sciences would have multiple benefits for NMFS. Students currently in this program contribute to communities of practice in each of the current disciplines by developing strong links between academic institutions and the agency. These Fellowships have been very successful in developing new methodologies, identifying and targeting potential future members of staff, and developing partnerships that often last long after the fellowship has ended. The committee would expect the expansion to include social sciences beyond economics relevant to NMFS’s work would have similar benefits to a social science community of practice. Partnerships may be one way to overcome constraints in collecting demographic and socioeconomic data within the federal system. Partnerships with state agencies, for example, may provide access to lists of permit and quota holders and associated demographic data that may be used to develop insights not currently possibly in the federal system. For example, Stoll et al. (2016) combined data on federal permit holders and those permitted by the Maine Department of Marine Resources to fish in state waters. These data were analyzed to quantify patterns of fishery specialization and diversification, and how coastal communities—as home communities of license holders—may be impacted by licensing changes intended to support fisher resilience. Stoll et al. (2016) were able to quantify how individuals’ access to Maine fisheries has changed over a 25-year period, as a result of past policy interventions. Available data on individual license holders also allowed the authors to map changes in fishers’ access portfolios in relation to fishing communities and to explore cumulative impacts of licensing changes on fisher access across fisheries. Similarly, Alaska’s Commercial Fisheries Entry Commission (CFEC) annually collects and publishes data on permit holders in state-managed fisheries since implementing a limited-entry management system in 1974. The CFEC issues permits to individual permit holders as in the committee’s stylized fishery. To track the geographic distribution of permit holdings by fishery, the CFEC created residency categories that designate communities
as rural or urban and local or nonlocal to a fishery. There is also a nonresident residency category. To understand the change in distribution of permit holdings in relation to these defined residency categories, CFEC tracks types of permit transfers (i.e., whether a permit was sold or gifted, whether a permit holder moved [e.g., from a rural local community to an urban nonlocal community], and permit cancellations). Other categories of information that are collected regularly at the fishery level and analyzed in relation to residency of permit holders include age of permit holder, rate of new entrants, and fishery earnings, among others.
CFEC data allow fishery managers and the public to understand who benefits from Alaska fisheries and how participation in Alaska fisheries changes over time. In 1984, CFEC published a report on Alaska Native participation in state-managed fisheries and how it had changed under limited entry (Kamali, 1984). This was possible at the time by linking CFEC data with the Bureau of Indian Affairs’s Alaska Native Roll. Since then, the rural local residency category is often used as a proxy for understanding Alaska Native participation. CFEC data has also been essential in identifying participation and aging trends across and within fisheries, such as rural permit loss and the “graying of the fleet” (Donkersloot and Carothers, 2016). It has also been utilized in understanding the flow of benefits from Alaska fisheries both across and beyond Alaska (Watson et al., 2021), and if and how fishery regulation or management changes impact local Alaska communities that depend on fisheries (Donkersloot, 2021; Koslow, 1986; Meredith, 2018; Reedy-Maschner, 2007). CFEC data has also been drawn on to understand how permit ownership provides non-monetary benefits to both individuals and communities more broadly by supporting social and cultural roles, obligations, and practices, such as food sharing networks, and the maintenance of social and community ties (see, e.g., Holen, 2014; Reedy and Maschner, 2014; Severence et al., 2013).
FINDINGS AND RECOMMENDATIONS
FINDING 3-1: Comprehensive demographic data related to characteristics of permit and quota holders and their geographic locations are required if NMFS is to determine where and to whom the benefits of the issuance of permits and allocations of quotas accrue and to meet the intent of Congress expressed in the MSA for fair and equitable distribution of benefits, as well as to meet commitments made in recent executive orders.
FINDING 3-2: Permits and quotas are not required in some fisheries and regions. Where they are required, comprehensive demographic data are often not collected. In some fisheries and regions, complex administrative, statistical, and legal restrictions currently prevent NMFS from collecting comprehensive data.
FINDING 3-3: Determining the distributions of demographic data to inform analysis of to whom benefits accrue is difficult when permits and quotas can be issued to individuals, or linked to vessels, legal entities, and corporations, as well as community groups. Ownership characteristics and requirements vary within and across regions.
FINDING 3-4: Determining the distributions of demographic data to inform analysis of where benefits accrue is challenging, since addresses provided on permit and quota documentation could represent a corporate office rather than an address or addresses that best represent where benefits accrue (e.g., home and port address). Uncertainty around where an entity operates reduces the ability to confidently link permit and landings databases to other data sources, including a fuller suite of social, economic, housing, and demographic information.
FINDING 3-5: Because permits and quotas convey both monetary and nonmonetary benefits, measurement and assessment of to whom and where benefits accrue needs to include both.
FINDING 3-6: Many fishers, communities, and other entities participate in multiple fisheries necessitating measurement at scales above the fishery scale (e.g., the ecosystem scale) to develop a full picture of the equity in the distribution of benefits derived from permit and quota holding.
FINDING 3-7: Strong regional differences exist with respect to the history and current issuance of permits and allocations of quota. Since consideration of equity needs to be contextual and place-based, it is challenging to develop a single, uniform, national (one-size-fits-all) approach to assessing where and to whom the benefits of the issuance of fishery permits and allocation of quotas accrue.
FINDING 3-8: The collection, analysis, and interpretation of comprehensive demographic and social data requires a greater capacity within NMFS Social Science branches within NOAA headquarters, regional offices, science centers, and councils than exists currently.
FINDING 3-9: The lack of a guidance document(s) to inform and establish a definition of equity and how it needs to be measured, assessed, and utilized by NMFS, regional science centers, and council staff is an obstacle to increasing investment in social science capacity, which will be necessary to expand the agency’s efforts in measuring equity.
FINDING 3-10: In spite of the challenges, NMFS scientists, in partnership with academics, council staff, and nongovernmental organizations, have made considerable advances in measuring and documenting analysis of to whom and where the benefits of permit and quota ownership accrue in particular case studies. Moving forward, the lessons learned from these regional case studies need to inform a national strategy for assessing the distribution of benefits and for increasing capacity for these efforts.
RECOMMENDATION 3-1: The National Marine Fisheries Service should take advantage of current opportunities both within the agency and in academia to expand work on equity by generating dashboards and data summaries that more fully express the distribution of permits and quota holdings in the nation’s fisheries. Progress on these activities need not await more comprehensive discussion of equity or wider availability of data.
RECOMMEDATION 3-2: The National Marine Fisheries Service (NMFS) should develop a guidance document(s) to inform and establish principles that lead to definitions of equity (see, e.g., Recommendation 2-1), and processes for measuring and assessing equity over time by NMFS, regional science centers, and Council staff. This document(s) should parallel guidance documents related to the Magnuson-Stevens Act. For example, NMFS has issued technical guidance that provides national, operational definitions of abundance and exploitation thresholds. Accordingly, even though regional methods for evaluating these thresholds may differ, an integrated, national summary of the status of fish stocks is possible. The committee views the suggested equity guidance documents as working in a similar fashion.
RECOMMENDATION 3-3: The National Marine Fisheries Service (NMFS) should undertake a needs assessment in each region and at the national level that can provide guidance on different investment strategies for developing social science capacity and leadership within the agency. These investments could include staffing focused on early-career scientists or a mix of scientists at different career stages with diverse disciplinary expertise and skill sets, including in research design and qualitative and quantitative data collection and analysis. The committee recommends that increasing capacity needs to include, but not be limited to, the leadership level, such as a Senior Scientist for Social Sciences within the NMFS Directorate.
RECOMMENDATION 3-4: Much of the current measurement and assessment work on equity in fisheries is conducted within a research framework within NMFS, academia, and change to nongovernmental organizations. If NMFS is to meet the legislative mandate for equity within MSA and recent executive orders, work on equity must transition to operational data collection and assessment programs, supported and analyzed by the increased social science capacity as recommended in Recommendation 3-3.


