Cannabis Policy Impacts Public Health and Health Equity (2024)
Chapter: 3 Cannabis Consumption and Markets in the United States
3
Cannabis Consumption and Markets in the United States
The public health impacts of consuming cannabis depend on many factors, such as the type of product and amount consumed, who is using it, and the legal environment in which they are using. Understanding the product is complicated: there are many cannabinoids, product types, and administration methods. It is also critical to understand the characteristics of who is using cannabis: youth? adults? those who have experience using it? people with health conditions? Finally, the legal environment in which cannabis is used is critical for many reasons. For example, it influences the size of the illegal market, where public health policies have less influence, although there is also less advertising, promotion, and product choice. This chapter provides an overview of the national trends in the perceived availability of cannabis, patterns of use, the types of products available, and who is using them. Some insights about cannabis markets follow. The discussion is based on information from two key data sources: the National Survey on Drug Use and Health (NSDUH) and the International Cannabis Policy Study (ICPS).
The NSDUH,1 administered by the Substance Abuse and Mental Health Services Administration (SAMHSA), is a nationally representative cross-sectional survey of the civilian, noninstitutionalized U.S. population aged 12 and older. State-specific estimates are available, but only from analyses of the restricted-use datasets. The committee sought to evaluate changes in use patterns over time, comparing states that have legalized cannabis with those that have not; however, the committee could not access the restricted-use data necessary for this purpose. The survey collects data on recency of use,
___________________
1Prior to 2002, the NSDUH was called the National Survey on Drug Abuse.
frequency of use, age of first use, and perceived risk and approval, as well as criteria in the Diagnostic and Statistical Manual of Mental Disorders, Fourth Edition (DSM-IV) on abuse and dependence and in the DSM-5 on cannabis use disorder. Respondents are also asked whether a doctor or other health professional recommended any or all of their use. NSDUH also captures many population characteristics. The committee evaluated changes in availability and use by race and ethnicity, age, sex, poverty status, veteran status, education level, and pregnancy status, to determine the impact of cannabis use patterns on marginalized or vulnerable groups. While the NSDUH remains a critical resource for understanding shifts in cannabis use geographically and over time, it has undergone important changes since 2014 that need to be considered when making comparisons over time:
- In 2014, SAMSHA changed the sampling design to improve the precision of national estimates and estimates in older adults. The changes included modifying the distribution of the sample across the 50 states and the District of Columbia and reducing the oversampling of youth and young adults (CBHSQ, 2015).
- In 2015, SAMHSA changed the survey administration methods. Changes were made to the data collection equipment, respondent materials, and the survey questionnaire (e.g., revised questions on prescription drugs, methamphetamine, hallucinogens, inhalants, and binge alcohol), and new questions were added (e.g., sexual orientation and attraction, disability status, identification of active-duty family members). The 2015 changes were aimed at improving the quality of data and addressing SAMHSA’s substance use and mental health policy and research needs (CBHSQ, 2015). The 2015 changes impact the following variables: co-use with alcohol and perception of the risk or availability of cannabis.
- In 2020, changes were made to the survey to address the methodological limitations of data collection posed by the COVID-19 pandemic. The primary methodological changes were (1) limited data collection from mid-March through September 2020; (2) the introduction of web data collection in October 2020, with limited in-person data collection; and (3) questionnaire changes beginning in October 2020. These changes affected the data collection mode effects and potentially had other effects on the estimates. Because these changes in data collection coincided with the COVID-19 pandemic, the effects of the methodological changes cannot be separated from actual changes in outcomes (SAMHSA, n.d.-a).
- In 2021, SAMHSA began using web-based interviewing, limiting comparisons between the 2021 data and data from previous years (SAMHSA, n.d.-b).
Throughout this chapter, series breaks in the trend data indicate changes in the NSDUH trend data.
One main limitation of the NSDUH is that information on the types of cannabis products consumed does not reflect the diversity of cannabis products available in the marketplace. The ICPS, an annual survey that began in 2018 in Canada and the United States, was explicitly designed to identify changes in cannabis use, particularly in the specific types and amounts of different products consumed, as well as the impact of different policy approaches to regulating cannabis in these countries (Hammond et al., 2020, 2022). The ICPS has expanded to include nationally representative samples of household members aged 18 years and older in Australia and New Zealand (2021) and in the United Kingdom and Germany (2022). Data from this survey provide some interesting details on the specific products consumed and mode of administration, and how these have changed in a relatively short period (Hammond et al., 2020, 2022).
TRENDS IN PERCEIVED AVAILABILITY OF CANNABIS AND CANNABIS USE PATTERNS
This section provides an overview of what is known about trends in the perceived availability of cannabis and use (e.g., prevalence of use, frequency of use, quantity consumed, and cannabis use disorder), as well as types of products used in the United States, based on data from the NSDUH and ICPS.
Perceived Availability
Studies have found that the perceived availability of cannabis is associated with its use. For example, a recent study found that individuals who perceived cannabis as being both low risk and available were 22 times more likely to have used it in the past year compared with those who perceived it to be both high risk and unavailable (Levy et al., 2021). Understanding individuals’ perceptions of cannabis availability is especially important among vulnerable populations as more states legalize the drug. A California study, for example, found that pregnant people perceived cannabis legalization as reducing barriers to prenatal cannabis use—that is, enabling access, increasing acceptance, and enhancing trust in cannabis retailers (Young-Wolff et al., 2022).
According to data from the NSDUH, the overall trend in the perceived availability of cannabis remained relatively flat from 2002 through 2014. Since 2014, however, there has been a detectable increase. The percentage of persons aged 12 or older who perceived cannabis to be “fairly easy” or “very easy” to obtain was 60.3 percent in 2014; by 2022, this percentage had

NOTES: Changes from solid, to dotted, to dashed lines represent the methodological changes to the NSDUH made in 2014, 2015, 2020, and 2021. NSDUH = National Survey on Drug Use and Health.
SOURCE: Generated by Seema Hemant Choksy Pessar, consultant to the committee.
grown to 65.6 percent (Figure 3-1). An increase in perceived availability is particularly pronounced among older adults—those 65 or older. In this age group, the perception that cannabis is “fairly easy” or “very easy” to obtain nearly doubled, increasing from 31.8 percent in 2002 to 54.9 percent in 2022. Notably, while the perception of cannabis availability among 18- to 25-year-olds decreased slightly over time—declining from 77.5 percent in 2002 to 75.0 percent in 2022—this age group consistently ranks highest in perceived availability. For those aged 12–17, there also appears to be a larger decrease in perceived cannabis availability relative to the other age groups.
Looking at perceived availability by race and ethnicity, a lower percentage of non-Hispanic Asian American, Native Hawaiian/Other Pacific Islander, and multiracial individuals reported perceiving cannabis as being “fairly easy” or “very easy” to obtain as compared with other racial subgroups; however, this percentage grew from 38.8 percent in 2002 to 51.2 percent in 2022 (Figure 3-2).2
Finally, while the availability of cannabis was perceived to be highest among respondents with some college, the most significant increase was seen among those with at least a college education—increasing from 56.8 percent in 2002 to 71.7 percent in 2022 (Figure 3-3).
___________________
2For these NSDUH trend analyses, non-Hispanic Asian American, Native Hawaiian/Other Pacific Islander, and multiracial individuals are placed in the same category. The committee recognizes that these are very different populations and acknowledges that the trends across and within these groups may vary. The committee urges that future epidemiological studies and policy analysis separate these groups if the data allow for such subgroup analyses.

NOTES: Changes from solid, to dotted, to dashed lines represent the methodological changes made to the NSDUH in 2014, 2015, 2020, and 2021. NSDUH = National Survey on Drug Use and Health.
SOURCE: Generated by Seema Hemant Choksy Pessar, consultant to the committee.
Prevalence
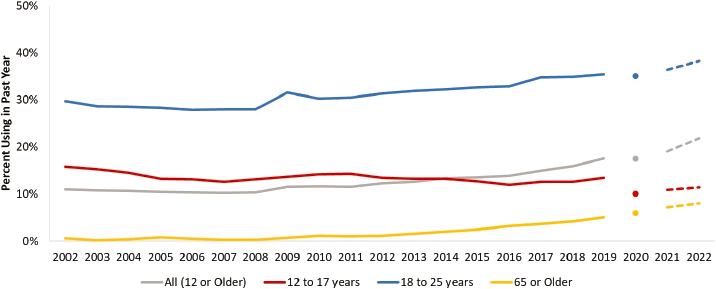
Overall, past-year cannabis use has nearly doubled over the last two decades. In 2002, according to the NSDUH, 11.0 percent of the noninstitutionalized U.S. population aged 12 or older reported past-year cannabis use. By 2022, this figure had grown to 21.9 percent.

NOTES: Changes from solid, to dotted, to dashed lines represent the methodological changes made to the NSDUH in 2014, 2015, 2020, and 2021. NSDUH = National Survey on Drug Use and Health.
SOURCE: Generated by Seema Hemant Choksy Pessar, consultant to the committee.
NOTES: Changes from solid, to dotted, to dashed lines represent the methodological changes made to the NSDUH in 2014, 2015, 2020, and 2021. NSDUH = National Survey on Drug Use and Health.
SOURCE: Generated by Seema Hemant Choksy Pessar, consultant to the committee.
While overall prevalence has increased, differences are evident by age, sex, race or ethnicity, and other sociodemographic factors. For example, Figure 3-4 shows that the percentage of teenagers (aged 12–17) who reported past-year prevalence fell from 15.8 percent in 2002 to 11.4 percent in 2022. However, past-year prevalence among young adults—those aged 18–25—was consistently the highest among all age cohorts. In 2002, 29.7 percent of young adults reported past-year use; by 2022, this percentage had grown to 38.3 percent. The trendline was also positive for adults aged 65 and older, in whom past-year cannabis prevalence increased from 0.6 percent to 8.0 percent, more than a 12-fold increase.
Notable differences in past-year cannabis use are also evident by race or ethnicity (Figure 3-5). In 2022, past-year use was highest among non-Hispanic American Indian/Alaska Native people, 28.4 percent of whom reported past-year use, compared with non-Hispanic White people (22.9 percent); non-Hispanic Black people (22.9 percent); non-Hispanic Native Hawaiian people, Other Pacific Islanders, and multiracial individuals (16.3 percent); and Hispanic people (20.3 percent). Note that the precision of the estimates among the racial groups varies, and prevalence estimates for the non-Hispanic American Indian/Alaska Native population are less precise than those for other races.
While self-reported past-year cannabis use was consistently higher among men than among women—24.3 percent versus 19.6 percent, respectively, in 2022—women experienced a more significant 20-year increase

NOTES: Changes from solid, to dotted, to dashed lines represent the methodological changes made to the NSDUH in 2014, 2015, 2020, and 2021. NSDUH = National Survey on Drug Use and Health.
SOURCE: Generated by Seema Hemant Choksy Pessar, consultant to the committee.
compared with men (Figure 3-6). Specifically, in 2002, 8.5 percent of women reported past-year cannabis use, while in 2022, that percentage was 19.6 percent.
As illustrated in Figure 3-7, the percentage of pregnant persons who reported past-year cannabis use—which ranged from 12.6 percent in 2002 to 21.9 percent in 2022—was similar to that for the overall population of persons aged 12 or older.

NOTES: Changes from solid, to dotted, to dashed lines represent the methodological changes made to the NSDUH in 2014, 2015, 2020, and 2021. NSDUH = National Survey on Drug Use and Health.
SOURCE: Generated by Seema Hemant Choksy Pessar, consultant to the committee.

NOTES: Changes from solid, to dotted, to dashed lines represent the methodological changes made to the NSDUH in 2014, 2015, 2020, and 2021. NSDUH = National Survey on Drug Use and Health.
SOURCE: Generated by Seema Hemant Choksy Pessar, consultant to the committee.
While 6.1 percent of veterans reported past-year cannabis use in 2002—a percentage nearly half of that reported by the population aged 12 and older—that rate had more than tripled by 2022, reaching 18.4 percent (Figure 3-8).
Small and much more subtle differences in past-year cannabis use were seen by poverty status. A higher percentage of those living in poverty (at or below the federal poverty level) consistently reported more past-year use (15.3% in 2002; 24.9% in 2022), and the gap between those in poverty and

NOTES: Changes from solid, to dotted, to dashed lines represent the methodological changes made to the NSDUH in 2014, 2015, 2020, and 2021. NSDUH = National Survey on Drug Use and Health.
SOURCE: Generated by Seema Hemant Choksy Pessar, consultant to the committee.

NOTES: Changes from solid, to dotted, to dashed lines represent the methodological changes made to the NSDUH in 2014, 2015, 2020, and 2021. Living in poverty = family income below the federal poverty level (FPL); family income 2x the FPL = income less than 2x the FPL but above the FPL; more than 2x the FPL = 2x the FPL or greater.
SOURCE: Generated by Seema Hemant Choksy Pessar, consultant to the committee.
those with family incomes of more than twice the federal poverty level has remained somewhat stable over time. There was a difference of 5.2 percentage points in 2002 and 4.0 percentage points by 2022 (Figure 3-9).
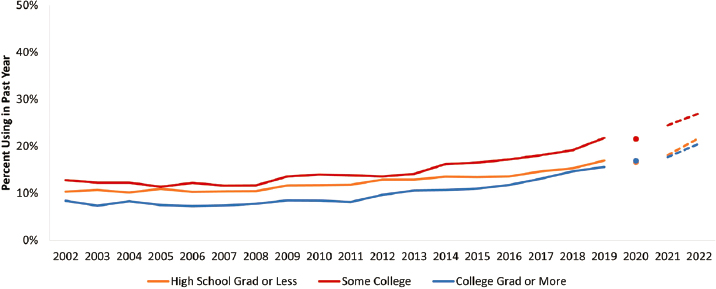
The percentage of respondents reporting past-year use was lowest among the most educated—that is, among those with at least a college degree (Figure 3-10). In 2022, 27.0 percent of those with some college
NOTES: Changes from solid, to dotted, to dashed lines represent the methodological changes made to the NSDUH in 2014, 2015, 2020, and 2021.
SOURCE: Generated by Seema Hemant Choksy Pessar, consultant to the committee.
NOTES: Changes from solid, to dotted, to dashed lines represent the methodological changes made to the NSDUH in 2014, 2015, 2020, and 2021. NSDUH = National Survey on Drug Use and Health.
SOURCE: Generated by Seema Hemant Choksy Pessar, consultant to the committee.
reported past-year use, compared with 21.8 percent among those with a high school degree or less and 20.6 percent among those with a college degree or higher. In all cases, past-year prevalence rates more than doubled from 2002 to 2022.
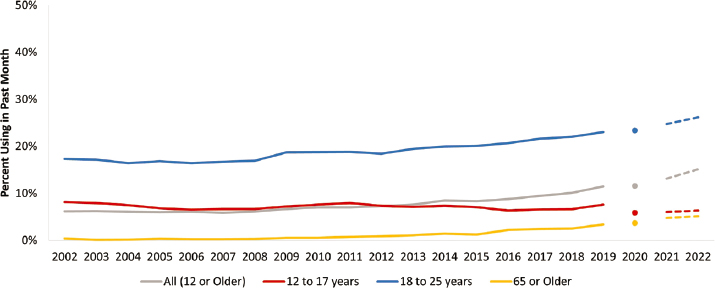
Past-month cannabis use by age is presented in Figure 3-11. Overall, 6.2 percent of the population aged 12 or older reported past-month cannabis use in 2002. This percentage more than doubled and rose to 15.1 percent in 2022—a greater increase than was seen in past-year cannabis use over the same period. Other trends and differences by race or ethnicity, sex, pregnancy status, veteran status, poverty status, and education closely mirror those previously described. Even so, graphs depicting trends in past-month prevalence rates from 2002 to 2022 are reported in the online Appendix E.3
Frequency of Use
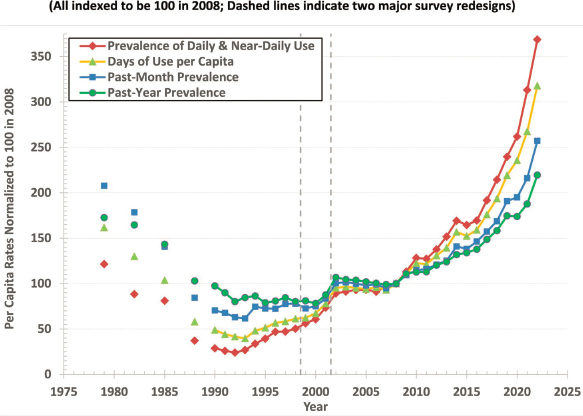
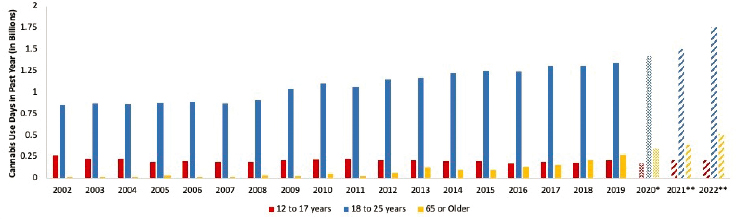
Focusing on prevalence helps in understanding how the population of people who use cannabis is changing, but from a health and market perspective, it is important to also assess how frequently cannabis is being used (e.g., in terms of total use days). Indeed, the trends in these measures can be quite different. As displayed in Figure 3-12, Caulkins (2024) shows that while there has been a notable increase in the past-year and past-month prevalence of cannabis since the early 1990s, the increase was much larger for two other measures focused on frequency of use: total cannabis use days
___________________
3Appendix E can be found online at https://nap.nationalacademies.org/27766.
NOTES: NSDUH = National Survey on Drug Use and Health; PM = past month.
SOURCE: Reproduced from Caulkins, 2024. CC BY-NC 4.0.
in the past month and number of people who reported using cannabis daily or near-daily (DND; 21+ days in the past month).4 In fact, Caulkins (2024) also shows that as of 2022, more people in the United States reported using cannabis than alcohol on a DND basis (see Figure 3-13) (Caulkins, 2024).
The next two figures in this section focus on total use days in the past year for specific demographic groups. Figure 3-14 examines total use days by sex, showing that males use cannabis more frequently than females.5 In 2002, males reported 1.42 billion use days in the past year, while females reported 0.69 billion use days. By 2022, both males and females reported more use days: 4.8 billion for males and 3.3 billion for females. Thus, while females accounted for slightly less than one-third of total use days in 2002, this proportion increased to slightly more than 40 percent in 2022. DND use was consistently higher among males than females. In 2022, with 7.8 percent of males reporting DND use compared with 5.0 percent of females (based on NSDUH data analyzed Seema Hemant Choksy Pessar, consultant to the committee; figure not shown).
___________________
4Of course, one must be mindful that even among very frequent users, there can be important variation in the quantity of cannabis consumed per use day, as discussed later in this chapter.
5The sex-specific figures in this chapter and the online Appendix E are based on the NSDUH question: “Are you male or female?” Starting in 2015, questions were added to the NSDUH about sexual orientation and identity for those aged 18 and older (CMS, n.d.). Sexual minorities are an important subpopulation when one is considering cannabis use patterns and reasons for use.

NOTES: Data presented are based on the NSDUH, which underwent methodological changes in 2020 and 2021. NSDUH = National Survey on Drug Use and Health.
SOURCE: Reproduced from Caulkins, 2024. CC BY-NC 4.0.

NOTES: Asterisks and changes from solid, to dotted, to dashed shading represent methodological changes to the NSDUH. NSDUH = National Survey on Drug Use and Health.
SOURCE: Generated by Seema Hemant Choksy Pessar, consultant to the committee.
NOTES: Asterisks and changes from solid, to dotted, to dashed shading represent methodological changes to the NSDUH. NSDUH = National Survey on Drug Use and Health.
SOURCE: Generated by Seema Hemant Choksy Pessar, consultant to the committee.
Figure 3-15 shows total use days for three age groups of interest: those under age 18, those aged 18–25, and those aged 65 and older. Whereas total use days for those under age 18 remained fairly stable over the 2002–2022 time period, there were notable increases for young adults (aged 18–25) starting in 2009 and for those aged 65 and older starting in 2012.
It is commonly asserted that the prevalence of cannabis use is similar across racial and ethnic groups, although Black people are four times more likely than White people to be arrested for cannabis-related reasons (Resing, 2019).6 However, it may be more important to account for frequency of use (Burns et al., 2013). As seen in Figure 3-16, the highest prevalence of DND cannabis use are reported by American Indian and Alaska Native people, followed by non-Hispanic Black people. Non-Hispanic White people have a lower rate of DND use than Black people, while Hispanic people have an even lower rate of use than White people. Each trend has been rising over time, but unlike simple 30-day prevalence, the prevalence estimates for DND do not have a clear pattern of differences among racial and ethnic groups. The American Indian and Alaska Native estimates are the least precise of the racial ethnic groups, so the differences (particularly prior to 2021) are unlikely to be statistically significant.
The frequency of cannabis use is also socially stratified. Whereas cannabis use was often associated with college campuses in the 1960s (see, e.g., Goldstein, 1966), college grads today have the lowest rates of DND use.
___________________
6Insights about racial disparities in cannabis arrests are described in Chapter 5.
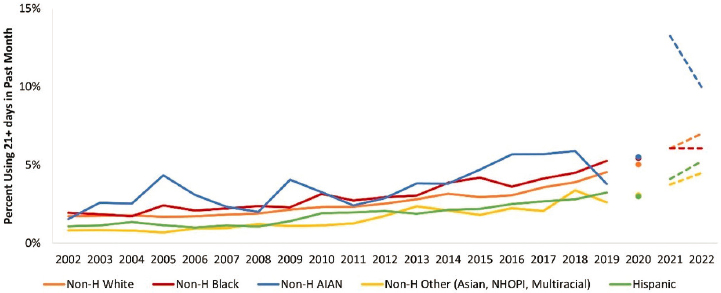
NOTES: Changes from solid, to dotted, to dashed lines represent methodological changes to the NSDUH. NHOPI = Native Hawaiian or Other Pacific Islander; non-H = non-Hispanic; NSDUH = National Survey on Drug Use and Health.
SOURCE: Generated by Seema Hemant Choksy Pessar, consultant to the committee.
As seen in Figure 3-17, the rate of DND cannabis use for college grads in 2022 is about half of that for those with some college or a high school education or less.
Another important trend observed when examining shifts in total use days is found among pregnant people. Estimated cannabis use days in

NOTES: Changes from solid, to dotted, to dashed lines represent methodological changes to the NSDUH. NSDUH = National Survey on Drug Use and Health.
SOURCE: Generated by Seema Hemant Choksy Pessar, consultant to the committee.

NOTES: Changes from solid, to dotted, to dashed lines represent methodological changes to the NSDUH. NSDUH = National Survey on Drug Use and Health.
SOURCE: Generated by Seema Hemant Choksy Pessar, consultant to the committee.
the past year for this population increased from 10.2 million in 2002 to 36.5 million in 2022. Furthermore, the percentage of pregnant persons with DND use increased from 1.0 percent in 2002 to 4.3 percent in 2022 (Figure 3-18).
Product Types and Mode of Administration
Dried flower is still the most commonly consumed cannabis product, but over time, fewer people have reported consuming dried flower. Among people who reported using any cannabis product in the past year, the share that reported past-year use of any dried flower decreased from 80 percent in 2018 to 70 percent in 2023 (Figure 3-19). By 2023, 3 in 10 people who had used cannabis in the past year had exclusively used a product processed from cannabis, not the plant itself. The use of every other type of cannabis product has increased; the share of people that used edibles in the past year increased by more than 40 percent between 2018 and 2023, from 41 percent to 59 percent; use of vape oils increased by 27.3 percent, from 33 percent in 2018 to 42%; and use of concentrates was up 47.1 percent, from 17 percent in 2018 to 25 percent in 2023.
The ICPS can also be used to evaluate whether consumers use a single cannabis product or a variety of products (see the description of the ICPS in the introduction to this chapter). Figure 3-20 shows the share of people who reported using one, two, three, or even more products in the past month during 2023. Fewer than half (41.4 percent) reported using a single

SOURCE: Generated by David Hammond, consultant to the committee.
cannabis product, more than a quarter (28.8 percent) using two products, and just under 30 percent (29.7 percent) using three or more products.
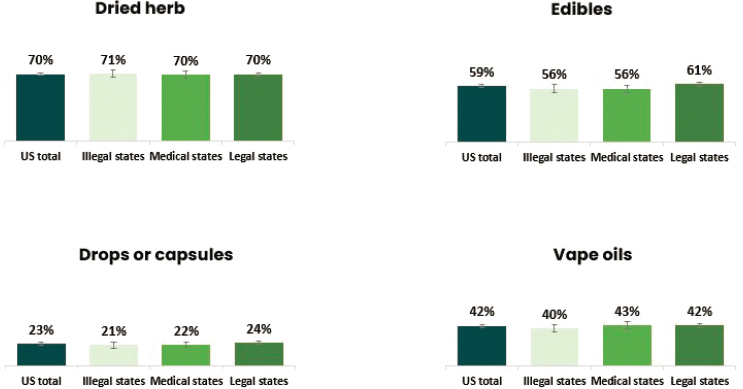
Use of different types of products is similar regardless of the legal status of cannabis. Figure 3-21 displays state cannabis legalization status in 2023 the types of cannabis products used by people who reported past-year cannabis use. Dried herb dominates in all states, followed by edibles and vape oils; least common is use of cannabis in drop or capsule form. The use rates for each product type are similar regardless of the legal status of cannabis where people live.
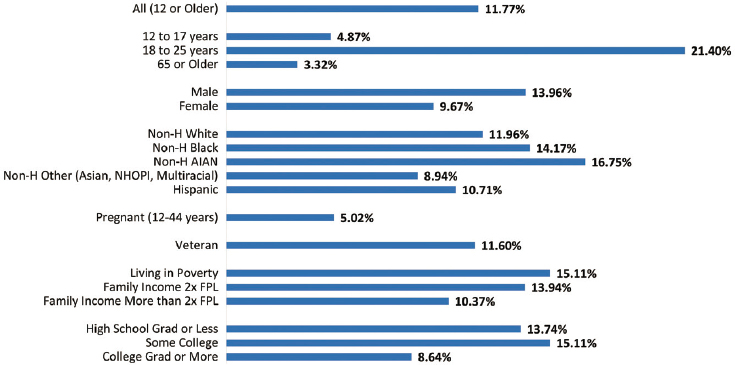
The NSDUH estimates past-year rates of vaping, dabbing, smoking, and eating or drinking cannabis products in people aged 12 and older (Figure 3-22). In 2022, smoking was reported as the most common route of administration in the past month (11.8 percent), followed by eating/drinking (5.4 percent), vaping (5.2 percent), and dabbing (2.4 percent).

SOURCE: Generated by David Hammond, consultant to the committee.
SOURCE: Generated by David Hammond, consultant to the committee.

NOTES: Changes from solid, to dotted, to dashed lines represent methodological changes to the NSDUH. NSDUH = National Survey on Drug Use and Health.
SOURCE: Generated by Seema Hemant Choksy Pessar, consultant to the committee.
Young adults (aged 18–25) accounted for the highest proportion of past-month cannabis smokers (21.4 percent). Smoking was also common among males (14.0 percent) and females (9.7 percent), people living in poverty (15.1 percent), and those who had some college (15.1 percent) (Figure 3-23).
NOTES: FPL = federal poverty level; NHOPI = Native Hawaiian and Other Pacific Islander; non-H = non-Hispanic; NSDUH = National Survey on Drug Use and Health.
SOURCE: Generated by Seema Hemant Choksy Pessar, consultant to the committee.

NOTES: FPL = federal poverty level; NHOPI = Native Hawaiian and Other Pacific Islander; non-H = non-Hispanic; NSDUH = National Survey on Drug Use and Health.
SOURCES: Generated by Seema Hemant Choksy Pessar, consultant to the committee.
Eating and drinking of cannabis was also most prevalent among young adults (aged 18–25) (9.3 percent), with modest rates among males (5.9 percent), females (5.0 percent), non-Hispanic Whites (6.3 percent), American Indians/Alaska Natives (6.2 percent), more affluent populations (5.8 percent), and those with some college (7.1 percent) or a college degree (6.75 percent) (Figure 3-24). Vaping (12.6 percent) and dabbing (7.1 percent) were also most prevalent among those aged 18–25 (Figures 3-25 and 3-26).
Among pregnant persons, the most prevalent modes of administration for the past 30 days were smoking (5.0 percent), vaping (3.5 percent), eating/drinking (2.4 percent), and dabbing (2.0 percent). Among veterans, those rates were smoking (11.6 percent), vaping (3.6 percent), eating/drinking (3.5 percent), and dabbing (1.4 percent).
Quantity Consumed
When examining the health consequences of using cannabis, knowing the frequency of use, types of products used, and how they are used is necessary but insufficient. One must also know how much of each product is consumed and, ideally, the THC concentration of the product, so a dose could be estimated. As noted earlier, one would expect the consequences of daily use to differ for those who smoke cannabis multiple times per day versus those who have a puff or two from a cannabis vape pen every night before going to sleep. While the NSDUH does not ask about the quantity

NOTES: FPL = federal poverty level; NHOPI = Native Hawaiian and Other Pacific Islander; non-H = non-Hispanic; NSDUH = National Survey on Drug Use and Health.
SOURCE: Generated by Seema Hemant Choksy Pessar, consultant to the committee.

NOTES: FPL = federal poverty level; NHOPI = Native Hawaiian and Other Pacific Islander; non-H = non-Hispanic; NSDUH = National Survey on Drug Use and Health.
SOURCE: Generated by Seema Hemant Choksy Pessar, consultant to the committee.
consumed for any cannabis products, other surveys have attempted to collect this information; however, this is still very much an emerging field of study.
Early research on the quantity of cannabis consumed focused primarily on flower (which dominated consumption at that time), and on estimating the total amount of cannabis consumed in a jurisdiction. These estimates were based mainly on internet convenience samples from the 2010s and were used mainly for generating reasonable ranges for heavy cannabis users, who account for most consumption and expenditure (Kilmer et al., 2014). For these samples, it was common for the median amount of flower used by daily users per use day to be approximately 1.5 g; those using fewer days per month generally consumed less per use day (Caulkins et al., 2020; Kilmer et al., 2013).
More recent surveys have focused on collecting information on quantity consumed for multiple types of cannabis products, not just flower—especially in Canada (Callaghan et al., 2019; Hammond and Goodman, 2020). Within the United States, the ICPS does collect this information, and Wadsworth and colleagues (2023) reported the mean (with standard deviation) and median amounts used during a use day by product, frequency of use, and state legal status. For people living in states that had enacted legalization in 2020 and used dried flower, evidence shows that frequency of use is positively correlated with amount used (Table 3-1). Table 3-2 presents similar data for some other cannabis products, but only for two groups: all past-year users who used the product and those who used it on a DND basis.
While converting these quantity estimates into the amount of delta-9tetrahydrocannabinol (THC) consumed would be useful, there are important challenges to doing so. First, research from Hammond and Goodman (2020) finds that consumer knowledge of THC levels is low, and that there were only modest differences between consumers living in jurisdictions that had and had not legalized nonmedical cannabis. Second, even if consumers remember what was on the label of the product they consumed, serious
| Used Less Than Monthly in the Past Year | Used Monthly in the Past Year | Used Weekly in the Past Year | Used Daily or Near Daily in the Past Year | |
| Mean (SD) | 0.64 (1.04) | 0.97 (1.24) | 1.13 (1.34) | 2.05 (1.94) |
| Median | 0.25 | 0.5 | 0.6 | 1.2 |
SOURCE: Hammond et al., 2022.
| Product | Unit of Measure | All Past 12-Month Consumers | Used Daily or Near Daily in the Past Year |
|---|---|---|---|
| Mean (SD) Dried flower Median | Grams | 1.35 (1.64) 0.75 (N = 4,126) | 2.05 (1.94) 1.20 (N = 1,508) |
| Mean (SD) Cannabis oil—vaped Median | Times per day | 3.66 (3.05) 3.00 (N = 1,862) | 5.02 (3.59) 4.00 (N = 377) |
| Mean (SD) Edibles/foods Median | Number per day | 1.49 (1.39) 1.00 (N = 3,595) | 1.92 (1.56) 1.00 (N = 248) |
| Mean (SD) Concentrates Median | Grams | 1.18 (1.60) 0.50 (N = 987) | 1.26 (1.59) 0.50 (N = 233) |
SOURCE: Hammond et al., 2022.
questions exist about the accuracy of THC levels reported on labels in the United States (Geweda, 2024, further discussed later in this chapter; Schwabe, 2023). Third, the amount of THC that reaches the bloodstream varies with the product consumed (e.g., smoking leads to THC loss in sidestream smoke, and not all THC is destroyed by pyrolysis [Perez-Reyes, 1990]). Furthermore, some products can be consumed in multiple ways (e.g., flower can be smoked or vaped). Fortunately, important research is focused on improving and standardizing measures of THC consumption (Borodovsky et al., 2022; Freeman and Lorenzetti, 2020, 2023; Wood et al., 2024).
Cannabis Use Disorder
In addition to general cannabis use patterns, cannabis use is evaluated with respect to clinical DSM criteria of abuse, dependence, or cannabis use disorder. Use of the terms “cannabis abuse” and “cannabis dependence” in DSM-IV was based on seven criteria related to symptoms, duration, and impact on daily functioning. A diagnosis of cannabis abuse required meeting one or more of four criteria; a diagnosis of cannabis dependence required meeting three or more of the seven total criteria. DSM-5, which replaced DSM-IV in 2013, includes 11 criteria that incorporate six of the seven former DSM-IV abuse and dependence criteria (with the legal problem criterion removed), as well as new craving and withdrawal criteria.
Moreover, DSM-5 combines elements of abuse and dependence into a single category of “cannabis use disorder” with varying degrees of severity—mild (presence of two or three criteria), moderate (four or five criteria), and severe (six or more criteria). Changes in the DSM diagnostic criteria would be expected to affect the classification and prevalence of cannabis use disorders, but studies examining the concordance between DSM-IV and DSM-5 have generally found high levels of agreement (Compton et al., 2013; Hasin et al., 2016). There are nevertheless some nuances, including slight variations in prevalence rates of cannabis use disorder when DSM-5 rather than DSM-IV criteria are applied. For example, DSM-5 criteria appear to yield slightly higher prevalence rates because of the integration of abuse and dependence into a single disorder, and the prevalence of moderate to severe DSM-5 cannabis use disorder is higher than that of DSM-IV cannabis dependence that may also be attributed to the cannabis withdrawal criterion (Compton et al., 2013; Goldstein et al., 2015; Hasin et al., 2016).
Based on NSDUH estimates, rates of cannabis abuse and dependence remained relatively stable from 2002 to 2019, with the highest rates of abuse and dependence among young adults (aged 18–25) (Figure 3-27). For 2020, except for youth (aged 12–17), for whom the data suggest a slight decline in rates of cannabis abuse and dependence, the data are generally consistent with the longer-term trends for the other age groups. In 2021, the NSDUH introduced the diagnostic category of cannabis use disorder to better accord with DSM-5 criteria for classifying substance use disorders. The frequency of the disorder is higher than previous estimates of cannabis

NOTE: Changes from solid, to dotted, to dashed lines represent methodological changes to the NSDUH. NSDUH = National Survey on Drug Use and Health.
SOURCE: Generated by Seema Hemant Choksy Pessar, consultant to the committee.
use and dependence (online Appendix E). Given that cannabis use disorder has only been measured for 2 years using the new DSM-5 criteria, it is challenging to determine how this has changed over the full 20-year time period. It follows a similar pattern as that of cannabis use and dependence, with the highest rates of the disorder among young adults (aged 18–25), males, non-Hispanic American Indians/Alaska Natives, people living in poverty, and people with some college education. In 2022, cannabis use disorder was less common in pregnant persons than in the general population but was increasing in both populations (Figure 3-28, online Appendix E).
Perceived Availability and Cannabis Use: Findings
The overall trend in the perceived availability of cannabis remained relatively flat from 2002 through 2014 but then began to increase, consistent with the opening of adult-use retail markets in a few U.S. states. There was a large increase in perceived availability among those aged 65 or older, but a noteworthy decrease for those aged 12–17.
Over the past 20 years, the number of people who use cannabis in the United States has seen a large increase. More important, however, the share of people using cannabis on a DND basis has risen even faster—in fact, much faster; 2022 was the first year when the number of Americans using cannabis on a DND basis was larger than the number of Americans

NOTE: Changes from solid, to dotted, to dashed lines represent methodological changes to the NSDUH. NSDUH = National Survey on Drug Use and Health.
SOURCE: Generated by Seema Hemant Choksy Pessar, consultant to the committee.
using alcohol on a DND basis. Perhaps of even greater significance from a public health perspective is the enormous rise in frequent use among those aged 65 and older as well as pregnant persons, two particularly vulnerable populations.
The number of cannabis products consumed has also grown, with a greater number of Americans reporting use of concentrates, edibles, and vape oils, while dried flower (still the most commonly used product) has declined. Smoking is the most common route of administration, followed by eating and drinking, vaping, and dabbing.
NSDUH estimates for cannabis use disorder has only been measured for 2 years using the new DSM-5 definition, making it challenging to determine whether there have been changes over time. Still, the demographic characteristics for the disorder follow patterns similar to those for cannabis use, with the highest rates among young adults (aged 18–25), males, non-Hispanic American Indians/Alaska Natives, people living in poverty, and with those with some college education.
TRENDS IN CANNABIS CONCENTRATION AND PRICES
Consumption patterns alone form an incomplete picture of the cannabis landscape, in part because the core intoxicant contained in cannabis has changed dramatically during this time and differentially across different product forms. Examining the trends in delta-9-THC concentration and prices over time therefore provides important additional insights as to whether the cannabis marketplace is evolving in a manner that supports public health. This section describes current trends in these two areas, recognizing the limitations of the available data sources.
Concentration of THC in Products
As reported earlier, the concentration of delta-9-THC and other active ingredients in cannabis products has been increasing. However, data do not exist on the delta-9 THC levels consumed over time. The increase in the average THC levels over time can be seen in data from seized cannabis flower in the United States (Figure 3-29). In the late 1990s, the average THC level for seized cannabis flower was less than 5 percent; by 2010, this figure had increased to roughly 10 percent, and by 2019, it was closer to 14 percent (ElSohly et al., 2021). Seized products do not represent what is available in state-legal markets or is being consumed (e.g., enforcement could have prioritized trafficking of higher-concentration products). Of interest, ElSohly and colleagues (2021) observed that cannabidiol (CBD) concentrations do not follow the same trends as those for delta-9-THC, having declined from

NOTE: THC = tetrahydrocannabinol.
SOURCE: Generated by the committee based on ElSohly and colleagues, 2016, 2021.
0.4 percent in 2009 to 0.14 percent in 2017 and climbed to approximately 0.6 percent in 2019 (see also ElSohly et al., 1984).
State-level “track-and-trace” data systems can also be used to assess the concentration levels of products purchased in the state-legal market. While these data do not elucidate the concentration of products obtained from the illegal market, they become more representative of total consumption as legal sales displace illegal sales over time.
Generally, trend data from track-and-trace data systems show increases in the labeled delta-9-THC content of products sold, but these content figures are not always accurate. A study in Washington state found that the average THC levels of the flower sold increased from 16.5 percent in 2014 to 21.4 percent in 2017 (Kilmer et al., 2019). The study also found that the THC levels of the extracts sold increased from roughly 40 percent to 70 percent over the same period. In Colorado, the average THC levels for the flower sold increased from roughly 14 percent in 2014 to 19 percent in 2020; for concentrates, the THC level was in the 40–50 percent range in 2014, increasing to close to 70 percent over time (MPG Consulting and Leeds School of Business, 2021).
As noted, however, questions arise about the accuracy of THC levels on the labels of products sold in state-legal markets. Indeed, multiple media
investigations have focused on the prevalence of THC-level inflation by testing labs (Roberts et al., 2023; Schoenberg, 2023). These issues have also been documented in the scientific literature. For example, Zoorob (2021) examined the THC test results for flower products in Nevada and Washington, finding:
There is a statistically unusual spike in the frequency of products reporting just higher than 20% THC in both states consistent with economic incentives for products to contain at least 20% THC. This “bunching” of reported THC levels exists among some, but not all, cannabis testing labs, suggesting that laboratory differences (rather than precise manipulation by growers) drive this potential manipulation in reported THC content. (p. 1)
A more recent analysis tested 23 packages of cannabis flower from 10 dispensaries in Colorado. The THC concentrations reported on the package labels were lower than those in recent reports by retail outlets. Overall, about 70 percent of the samples contained more than 15 percent less THC than reported on the label (Schwabe et al., 2023). This finding is especially noteworthy since Colorado has the longest-running nonmedical market in the United States. Geweda and colleagues (2024) conducted a similar exercise, focused on 107 flower samples collected by law enforcement from state-legal adult-use commercial dispensaries in California, Colorado, and Oregon (Geweda et al., 2024). Of the 107 products, only 32 (30 percent) had a delta-9-THC content within +/−20 percent of the labeled content.
These studies, which focused on three different states and various media reports, suggest caution when using the THC data on labels or what is available in seed-to-sale tracking systems.7 While there are ways to address some discrepancies statistically, these findings highlight the need to improve accuracy and reduce fraud in the cannabis testing industry (see Chapter 4 for discussion of product testing). Findings on the inconsistency of product labeling of THC content within a given product category (e.g., flower, oil, tincture) are important for understanding trends in THC concentration within a product category but do not negate the point that, overall, total THC available in products in the marketplace is rising as products with a much higher THC concentration (vape pens, edibles, oils) displace products with lower concentration (flower products).
Prices
The price of cannabis has implications for many of the outcomes discussed in cannabis policy debates—consumption of cannabis, consumption
___________________
7This is not just an issue for delta-9-THC. Spindle and colleagues (2022) analyzed 105 topical cannabinoid products and found that 18 percent were overlabeled for CBD (>10 percent less CBD than advertised), and 58 percent were underlabeled (>10 percent CBD than advertised).
of other substances, size of the illegal market, tax revenues, and the profitability of licensed cannabis businesses—implications that can affect the viability of cannabis-related social equity programs (see Chapter 5) (Kilmer et al., 2014, 2019). This section reviews the theoretical reasons why legalization could decrease prices and then presents evidence of these price declines.
There are multiple reasons why the legalization of cannabis supply may reduce the production and distribution costs dramatically. First is the reduction in risk compensation (Reuter and Mark, 1986). When people buy drugs from the illegal market, they are typically compensating the seller and everyone along the supply chain for their risk of arrest, incarceration, and sometimes violence. This risk is reduced, if not eliminated, with legalization. Second, production in the illegal market can be very inefficient, a phenomenon that Reuter (1983) refers to as structural consequences of product illegality. Once an industry no longer hides its activities, transactions become less costly. It becomes easier to acquire and use cost-saving technologies (e.g., trimming machines, extraction materials, packaging technologies). This increase in efficiency should reduce costs. Third, if large producers can supply the market, they can take advantage of economies of scale, reducing the price per unit produced.
In the early 2000s, it was typical for sinsemilla (cannabis grown without seeds) in the wholesale illegal market to be sold for more than $3,000 per pound (Caulkins and Kilmer, 2016; Kilmer et al., 2010). As theory would predict, these wholesale prices have dropped dramatically post legalization. Here, the committee focuses on two of the first four states to legalize—Colorado and Oregon, which have regularly published wholesale price information. Figure 3-30 presents the median market price for a pound of cannabis in Colorado from January 2014 to April 2024.8 When this series started, the median price per pound was slightly less than $2,000; as of early 2024, it was $750 (unadjusted for inflation) (CDOR, 2023). This decrease has not been consistent; there has been fluctuation. In April 2023, the price was as low as $649 per pound.
Oregon observed a similar decrease (Figure 3-31). Based on wholesale prices obtained from the state’s seed-to-sale tracking data, the price per pound at the wholesale level went from roughly $1,800 in early 2016 to roughly $750 in late 2023, with the price as low as $550 in late 2022 (unadjusted for inflation) (OLCC, 2023).
___________________
8Each quarter, Colorado’s Department of Revenue reports the “average market rates” for cannabis, which are defined as “the median market prices per pound or count of each category of unprocessed retail marijuana that is sold or transferred from retail marijuana cultivation facilities to retail marijuana product manufacturing facilities or retail marijuana stores” (CDOR, 2024, para. 1).

SOURCE: Generated by the committee based on CDOR, 2023.
However, just because there is a massive price drop at the wholesale level does not necessarily mean there will be a similar decrease in retail prices. In principle, governments can set minimum prices or can set prices directly in government-run stores (see Chapters 2 and 4) to discourage purchases, but these approaches have not been implemented in state-legal markets in

SOURCE: OLCC, 2023.
the United States. States that have legalized marijuana have allowed profit-maximizing companies to sell cannabis, and this competition has resulted in reductions in the legal retail prices. In Washington, the median price per gram of flower was close to $25 when the stores opened in July 2014 but had fallen below $10 nearly 2 years later (Smart et al., 2017). The price per gram of flower sold at the retail level in Colorado fell from approximately $14 in January 2014 to roughly $5 in September 2020 (MPG Consulting and Leeds School of Business, 2021). In Oregon, the median price per gram of flower was more than $10 in late 2016 and had decreased to under $4 by the end of 2023. Even in one of the more recent legalization states—Michigan—it was reported that the price per ounce of flower dropped 40 percent, from roughly $9 per gram in early 2021 to $5 per gram in early 2022 (Semmler, 2022). Of course, the size of these price drops depends on the regulatory decisions made by the states (e.g., the number of cannabis business licenses issued), and they take time to go into effect (Hunt and Pacula, 2017).
When making these price comparisons over time and across markets, it is critical to compare similar products. The increase in the average THC concentration of flower products over time would suggest that the price per unit of THC is falling even faster than the declines described above. Furthermore, most of these price series do not adjust for inflation, which would show an even larger decrease. However, very few analyses incorporate THC concentration into their price analyses (Davenport, 2020; Hansen et al., 2020; Smart et al., 2017). One notable exception is Davenport’s (2020) analysis of Washington state’s seed-to-sale data, which generates model-based estimates of the price per 10-mg dose of THC for various products over time (Figure 3-32). Not only is a general decline observed over the 3 years examined, but there is also a variation in the price per unit of THC by product. Flower was the cheapest, which was unsurprising since it requires less processing than the other products (Davenport, 2020). The extent to which these price differentials have continued since 2018 and whether they are similar in other states is unclear.
Thus far, this section has focused on trends in administrative price data from the early adoption of legalization states. There have also been analyses of self-reported prices via surveys, not focused exclusively on legalization states. For example, a cross-sectional study using ICPS data found that respondents living in U.S. states with operating adult-use stores paid less per gram of flower than those living in states where cannabis is illegal entirely or is allowed only for medical purposes, or in states that had legalized but where retail stores had not yet opened (Wadsworth et al., 2023). Another ICPS analysis of Canadian data found that self-reported prices per gram of flower fell in both the legal and illegal markets from 2018 to 2022 (Hammond, 2023). However, it is vital to ensure that similar products are being compared in surveys and other data sources.

NOTE: THC = tetrahydrocannabinol.
SOURCE: Davenport, 2020. Permission was expressly granted by RAND, Santa Monica, CA. RAND is the original source and copyright holder of Public Health and Safety Consequences of Liberalizing Drug Laws: Insights from Cannabis Legalization, reprinted with permission.
Notably, price declines are occurring while cannabis supply and possession are still prohibited under federal law. If federal law changed and it was no longer illegal to move cannabis across state lines, production could concentrate in a few places in the United States.9 According to one estimate, all the cannabis consumed nationwide could be produced on a few dozen average-sized (450-acre) farms (Kilmer et al., 2022; USDA, 2020). If a change in federal policy allowed large corporations (e.g., tobacco, alcohol, or food companies) to participate in the cannabis market and cannabis were sold in grocery stores or by national online retailers, retail prices would likely be depressed even more (Caulkins and Kilmer, 2016). Some presenters at the committee’s public meetings argued that a federal change in cannabis policy should prioritize smaller companies over large corporations; a related question is the sustainability of a policy prioritizing small businesses.
Concentration and Price: Findings
The concentration of delta-9-THC in cannabis flower has been increasing, while prices have been declining. Changes in federal cannabis laws
___________________
9It has also been argued that state-level restrictions on interstate commerce could be challenged even without federal legalization. For example, Mikos (2021) asserts “that the restrictions legalization states now impose on interstate commerce in cannabis likely violate the Dormant Commerce Clause” (p. 857).
could further reduce prices by allowing interstate commerce and potentially attracting larger corporations to the cannabis industry (Caulkins and Kilmer, 2016; Kilmer et al., 2021). The potential impact of increased corporate involvement on market dynamics and social equity goals requires further consideration.
WHAT IS HAPPENING WITH THE ILLEGAL CANNABIS MARKET?
Understanding of the illegal cannabis market in the United States is complicated by poor data and the sizable unregulated market resulting from the 2018 Farm Bill (discussed in Chapter 2). The source for cannabis has shifted from Mexico, which was the dominant source for the United States through the year 2000 (Kilmer et al., 2010). As state-legal production ramped up and sinsemilla came to dominate the U.S. flower market, there was less demand for Mexican-grown cannabis, as it tended to have a lower THC concentration. The amount of cannabis seized at the U.S. southwest border has declined more than 97 percent10—from 2.4 million pounds in 2013 to 61,000 pounds in 2023 (based on data from U.S. Customs and Border Protection; Figure 3-33) (Grillo, 2024). Some cannabis in the U.S. market likely comes from Mexico, but the Drug Enforcement Administration’s 2020 National Threat Assessment also supports the finding of an increase in domestic production.
The size of the illegal market could be estimated by taking the total delta-9-THC consumed11 in the United States and subtracting the total amount sold in state-legal stores, with adjustments for cannabis derived from home cultivation. However, credible, peer-reviewed estimates of the national cannabis market do not exist. The Office of National Drug Control Policy used to include such estimates in its What America’s Users Spend on Illegal Drugs series. However, the most recent data from this report are from 2016 (Midgette et al., 2019).
Another challenge is that different components of the illegal market have different harms and require different policy responses. For example, cannabis grown in another country and imported to the United States requires a different policy response than does an adult’s legally purchasing cannabis and then selling it to someone under age 21. There could also be unlicensed production in the United States, as well as movement of legally
___________________
10There are limits to drawing inferences from seizure data (Reuter and MacCoun, 1995), and there was an increased focus on seizing fentanyl and methamphetamine from Mexico during this period. Still, the size of the drop is consistent with the massive increase in production throughout the United States.
11It is important to note that data from state traceability systems capture the amount of delta-9-THC obtained from legal sources, not necessarily consumed.

SOURCE: Reproduced from Grillo, Crashout Media, 2024.
produced or purchased cannabis products to other states (Hansen et al., 2020). Analyzing all the different types of illegal markets is infeasible. Instead, the committee examined how much cannabis comes from licensed markets in states where it is legal and the extent to which legalization displaced or reduced illegal cannabis cultivation within the United States.
How Much Cannabis Comes from Licensed Markets in States Where It Is Legal?
While some information is available on this question, it varies across states, time periods, measures, and the quality of the methodology used. In the first 3 years of retail cannabis sales in Washington (Kilmer, 2019), an estimated 40–60 percent of the THC obtained by state residents came from the state-licensed cannabis market. A study by the Oregon Liquor and Cannabis Commission (OLCC, 2019) estimated that circa 2018, “an estimated 55% of total statewide marijuana consumption among Oregonians aged 21 or older is procured from OLCC Recreational Retailers” (p. 1). More recent figures from industry sources suggest that the vast majority of cannabis consumed by state residents in Colorado and Oregon comes from the legal
market, but there is very little information about the methodologies used to generate these industry estimates (e.g., see Barcott, 2022).
In addition to variation across states and over time, there is within-state variation in the share of cannabis consumed that comes from the legal market. Some states allow localities to opt out of allowing licensed cannabis retail stores and sometimes deliveries (Chapter 2). Indeed, allowing jurisdictions to choose whether to license stores has been offered as one explanation for why the illegal market remains so robust in California. Still, other arguments exist, such as lax enforcement and minimal penalties for participating in the illegal market (see, e.g., Kaste, 2024).12
Other measures of illegal market activity have been published, but the extent to which they provide insights about the size of the illegal market varies. For example, reporting the share of people who used cannabis obtained from illegal and legal sources in the past year is not the same as knowing what share of total expenditures or total consumption came from the illegal market, although these surveys collect rich demographic information that could provide helpful information about the people participating in illegal and legal markets.
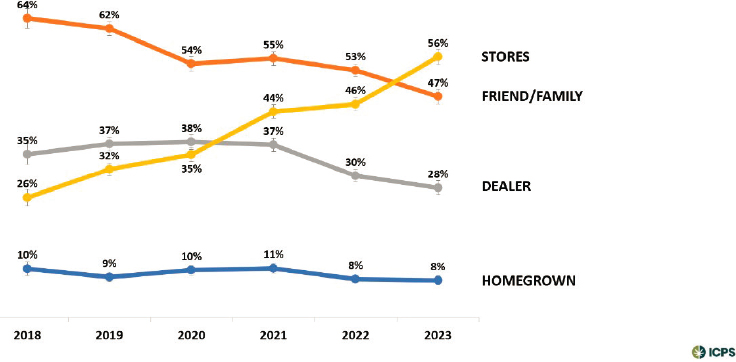
Some surveys collect information about where cannabis was purchased, which provides some insight into whether individuals are purchasing from legal or illegal sources. Since 2018, for example, the ICPS has been asking respondents who report past-year use of cannabis to identify all the sources for each type of cannabis they used. Responses include home grown or from a family or friend, dealer, internet delivery service or mail order, retailer, or other. Figure 3-34 reports trends in the sources of all cannabis obtained in the past 12 months for respondents answering this question in the ICPS. As more states have liberalized their policies and allowed either medical dispensaries or retail stores to open, a growing share of people who used cannabis in the past year have reported purchasing it from a store (from 26 percent in 2018 to 56 percent in 2023, a doubling in just 6 years). This finding is consistent with an insight from Figure 3-34 that the shares of those reporting purchasing from a dealer and a friend have both declined.
___________________
12This point about enforcement—which is discussed further in Chapter 5—is especially important for understanding the struggles New York has experienced with cannabis legalization. Indeed, the governor has referred to the transition as “a disaster” (Kaste, 2024). When an increasing number of bodegas and other outlets started selling cannabis illegally after legalization passed but before legal stores had been licensed, authorities did not prioritize stopping these illegal sales. The number of illegal outlets exploded because sellers believed there was little legal risk; some estimated that New York City alone had roughly 1,500 illegal cannabis outlets operating circa November 2023 (Bisram, 2023). There are reports of increased enforcement activity against these unlicensed sellers (often civil instead of criminal; see Hart, 2024), but this creates massive challenges for the initial licensed retailers who were equity licensees and nonprofit organizations.
SOURCE: Generated by David Hammond, consultant to the committee.
Figure 3-35 shows the same results broken down by whether the respondent lived in a state that has legalized adult-use cannabis, medical cannabis, or neither. Importantly, it shows that the share of respondents reporting that they purchased their cannabis at a store is significantly higher (64 percent) among people living in an adult-use state than among those who reported living in a state where cannabis is illegal (39 percent). In comparison, the share of people living in a legalization state who reported purchasing from
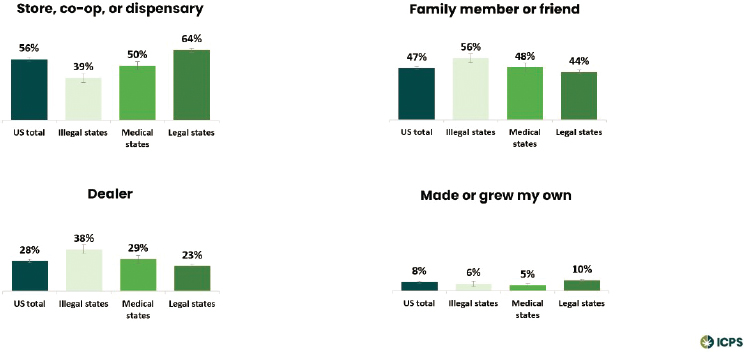
SOURCE: Generated by David Hammond, consultant to the committee.
a dealer (23 percent) is considerably lower than that of individuals living in a state where cannabis is illegal (38 percent). Individuals living in legalization states are also less likely to report obtaining cannabis from a friend or family member (44 percent) compared with those living in states without legalization (56 percent). Still, the differences are smaller than those from other sources.
To What Extent Has Legalization Displaced or Reduced Illegal Cannabis Cultivation within the United States?
Given the patchwork of cannabis laws, variation in enforcement, and the fact that cross-state shipping has always been a staple of the U.S. cannabis market, it is entirely possible that (1) overall illegal production has decreased, and (2) illegal production has increased in some states that have legalized. Some early-adopting legalization states had robust illegal markets before legalization that helped supply other parts of the country. If legalization made it easier for these illegal producers to operate (e.g., cheaper and easier to access production materials) and more difficult to identify while also decreasing enforcement risk, it is entirely plausible that illegal production could have increased in these states.13
However, empirically assessing this relationship is complex. A census of illegal cultivation operations over time does not exist, and simply focusing on seizures or reported cultivation can be problematic. As Reuter (1995) notes, seizure figures are a function of three phenomena: (1) the amount of illegal activity occurring, (2) efforts made to hide these illegal activities, and (3) detection and enforcement efforts by law enforcement officials. There have been attempts to use satellite imaging and thermal cameras to detect outdoor and indoor cannabis cultivation, but the committee is unaware of efforts to do this systematically over time to measure the impact of legalization. St. John’s (2022) exposé in the Los Angeles Times about illegal cultivation in California does include satellite photos of one area in 2014 and 2021, documenting the proliferation of illegal cannabis greenhouses in Mount Shasta Vista and reporting that in nearby Juniper Flat greenhouses covered more than 10 million square feet, a 4,200% increase since 2018 (St. John, 2022). The piece, which also includes several interviews with
___________________
13There may also be concern about where illegal growing is occurring given its potential damage to the environment. For example, a study by Prestemon and colleagues (2019) examines reports of illegal growing on U.S. national forests from 2004 to 2016, reporting that nonmedical legalization was associated with a decrease in reports of illegal growing operations. However, since the study is based on reports rather than a more objective measures, such as satellite images of cannabis grows, legalization could have affected the probability that someone reported what was believed to be illegal growing (one could imagine bias in both directions). The study also does not control for time-invariant characteristics of each state (i.e., state-level fixed effects), which could affect the estimates.
law enforcement officials and community members, concludes that illegal cultivation in California has proliferated since legalization. However, the article includes a quote about illegal cultivation from the director of the California Department of Cannabis Control: “Do I think it’s worse? I honestly couldn’t say one way or another” (St. John, 2022).
CONCLUSIONS
Since 2002, the number of people using cannabis has increased. The frequency of use has increased at a much faster rate, with more people reporting daily or near-daily use of cannabis than of alcohol in 2022. While dried flower remains the most common product, concentrates, edibles, and vape oils are gaining popularity, with people who use cannabis often employing multiple routes of administration. Measures of delta-9-THC concentrations suggest an increase since 2002, and the prices for cannabis products in many legalization states have declined.
Conclusion 3-1: The price per unit of delta-9-THC is declining, with implications for many outcomes discussed in cannabis legalization debates, such as consumption, the size of the illegal market, tax revenues, and the profitability of businesses (which can affect social equity efforts). These declines would likely be accelerated with federal legalization.
Understanding the dynamics of the legal versus illegal cannabis market is complicated by the lack of data on total cannabis (and delta-9 THC) consumption in the United States and the confusion created by the 2018 Farm Bill. There is evidence that in states that have legalized cannabis, an increasing number of state residents are getting their cannabis from state-legal sources; however, this evolution can take time.
Conclusion 3-2: Reduction in the size of the illegal cannabis market is shaped by multiple factors, ranging from the regulatory environment to enforcement activities.
REFERENCES
Barcott, B., and Whitney, B. 2022. Opt-out report 2022. https://www.leafly.com/news/politics/leafly-report-opt-out-towns-are-encouraging-illegal-marijuana-sales (accessed July 4, 2024).
Bisram, J. 2023. New York City could give NYPD instant power to shut down illegal marijuana shops. CBS News, November 3. https://www.cbsnews.com/newyork/news/nycillegal-marijuana-shops-nypd-shut-down-bill/ (accessed May 5, 2024).
Borodovsky, J. T., D. S. Hasin, D. Shmulewitz, C. Walsh, O. Livne, E. Aharonovich, C. A. Struble, M. I. Habib, and A. J. Budney. 2022. Typical hits, grams, or joints: Evaluating cannabis survey measurement strategies for quantifying consumption. Cannabis and Cannabinoid Research 9(2):646–658.
Burns, R. M., J. P. Caulkins, S. S. Everingham, and B. Kilmer. 2013. Statistics on cannabis users skew perceptions of cannabis use. Frontiers in Psychiatry 4.
Callaghan, R. C., M. Sanches, C. Benny, T. Stockwell, A. Sherk, and S. J. Kish. 2019. Who consumes most of the cannabis in Canada? Profiles of cannabis consumption by quantity. Drug and Alcohol Dependence 205:107587.
Caulkins, J. P. 2024. Changes in self-reported cannabis use in the United States from 1979 to 2022. Addiction. Advance online publication.
Caulkins, J. P., and B. Kilmer. 2016. Considering marijuana legalization carefully: Insights for other jurisdictions from analysis for vermont. Addiction 111(12):2082–2089.
Caulkins, J. P., B. Pardo, and B. Kilmer. 2020. Intensity of cannabis use: Findings from three online surveys. International Journal of Drug Policy 79:102740.
CBHSQ (Center for Behavioral Health Statistics and Quality). 2015. National survey on drug use and health: 2014 and 2015 redesign changes. Substance Abuse and Mental Health Services Administration, Rockville, MD. https://www.samhsa.gov/data/sites/default/files/NSDUH-RedesignChanges-2015.pdf (accessed July 14, 2024).
CDOR (Colorado Department of Revenue). 2023. Current and prior retail marijuana average market rates. https://tax.colorado.gov/sites/tax/files/AMR_PriorRates_Jul2023.pdf (accessed July 25, 2024).
CDOR. 2024. Average market rates (median market prices): April 1 through June 30, 2024. https://tax.colorado.gov/sites/tax/files/AverageMarketRate_Apr2024.pdf (accessed May 4, 2024).
CMS (Centers for Medicare & Medicaid Services) n.d. National Survey on Drug Use and Health (NSDUH). Years Survey Included Sexual and Gender Minority (SGM)-related Questions 2015 – Present. https://www.cms.gov/About-CMS/Agency-Information/OMH/Downloads/SGM-Clearinghouse-NSDUH.pdf (accessed July 4, 2024).
Compton, W. M., D. A. Dawson, R. B. Goldstein, and B. F. Grant. 2013. Crosswalk between DSM-IV dependence and DSM-5 substance use disorders for opioids, cannabis, cocaine and alcohol. Drug and Alcohol Dependence 132(1-2):387–390.
Davenport, S. 2020. Public health and safety consequences of liberalizing drug laws, public policy and analysis. [Doctoral dissertation, Pardee RAND Graduate School], RAND Corporation.
ElSohly, M., J. Holley, G. Lewis, M. Russell, and C. Turner. 1984. Constituents of cannabis sativa L. XXIV: The potency of confiscated marijuana, hashish, and hash oil over a ten-year period. Journal of Forensic Sciences 29(2):500–514.
ElSohly, M. A., S. Chandra, M. Radwan, C. G. Majumdar, and J. C. Church. 2021. A comprehensive review of cannabis potency in the United States in the last decade. Biological Psychiatry: Cognitive Neuroscience and Neuroimaging 6(6):603–606.
ElSohly, M. A., Z. Mehmedic, S. Foster, C. Gon, S. Chandra, and J. C. Church. 2016. Changes in cannabis potency over the last 2 decades (1995–2014): Analysis of current data in the United States. Biological Psychiatry 79(7):613–619.
Freeman, T. P., and V. Lorenzetti. 2020. ‘Standard THC units’: A proposal to standardize dose across all cannabis products and methods of administration. Addiction 115(7): 1207–1216.
Freeman, T. P., and V. Lorenzetti. 2023. Using the standard THC unit to regulate THC content in legal cannabis markets. Addiction 118(6):1007–1009.
Geweda, M. M., C. G. Majumdar, M. N. Moore, M. A. Elhendawy, M. M. Radwan, S. Chandra, and M. A. ElSohly. 2024. Evaluation of dispensaries’ cannabis flowers for accuracy of labeling of cannabinoids content. Journal of Cannabis Research 6(1):11.
Goldstein, R. 1966. Drugs on the campus. Saturday Evening Post. May 21, 1966. https://www.saturdayeveningpost.com/reprints/drugs-on-campus/ (accessed July 5, 2024).
Goldstein, R. B., S. P. Chou, S. M. Smith, J. Jung, H. Zhang, T. D. Saha, R. P. Pickering, W. J. Ruan, B. Huang, and B. F. Grant. 2015. Nosologic comparisons of DSM-IV and DSM-5 alcohol and drug use disorders: Results from the National Epidemiologic Survey on Alcohol and Related Conditions-III. Journal of Studies on Alcohol and Drugs 76(3):378–388.
Grillo, I. 2024. U.S. marijuana legalization smashed Mexico’s weed exports - as intended: But I was wrong. It didn’t, as many of us hoped, weaken cartels. CrashOut, May 2.
Hammond, D. 2023. What the U.S. can learn from the changes in cannabis use across Canada. Paper presented at Committee on Public Health Consequences of Changes in the Cannabis Policy Landscape: Committee meeting 2, virtual.
Hammond, D., and S. Goodman. 2020. Knowledge of tetrahydrocannabinol and cannabidiol levels among cannabis consumers in the United States and Canada. Cannabis and Cannabinoid Research 7(3):345–354.
Hammond, D., S. Goodman, E. Wadsworth, T. P. Freeman, B. Kilmer, G. Schauer, R. L. Pacula, and W. Hall. 2022. Trends in the use of cannabis products in Canada and the USA, 2018–2020: Findings from the International Cannabis Policy Study. The International Journal on Drug Policy 105:103716.
Hammond D, Goodman S, Wadsworth E, Freeman TP, Kilmer B, Schauer G, Pacula RL, Hall W. 2022. Trends in the use of cannabis products in Canada and the USA, 2018–2020: Findings from the International Cannabis Policy Study. International Journal of Drug Policy 105(Jul 1):103716.
Hammond, D., S. Goodman, E. Wadsworth, V. Rynard, C. Boudreau, and W. Hall. 2020. Evaluating the impacts of cannabis legalization: The International Cannabis Policy Study. International Journal of Drug Policy 77:102698.
Hansen, B., K. Miller, and C. Weber. 2020. Federalism, partial prohibition, and cross-border sales: Evidence from recreational marijuana. Journal of Public Economics 187:104159.
Hart, B. 2024. Why are there still illegal weed stores all over the city? Intelligencer, February 20. https://nymag.com/intelligencer/article/why-are-there-still-illegal-weed-stores-all-over-new-york.html (accessed May 5, 2024).
Hasin, D. S., B. T. Kerridge, T. D. Saha, B. Huang, R. Pickering, S. M. Smith, J. Jung, H. Zhang, and B. F. Grant. 2016. Prevalence and correlates of DSM-5 cannabis use disorder, 2012–2013: Findings from the National Epidemiologic Survey on Alcohol and Related Conditions-III. American Journal of Psychiatry 173(6):588–599.
Hunt, P., and R. L. Pacula. 2017. Early impacts of marijuana legalization: An evaluation of prices in Colorado and Washington. Journal of Primary Prevention 38(3):221–248.
Kaste, M. 2024. Black market cannabis thrives in California despite legalization. NPR, April 5. https://www.npr.org/2024/04/05/1242165136/black-market-cannabis-california-legalization-marijuana-recreational-illegal (accessed May 5, 2024).
Kilmer, B., J. P. Caulkins, B. M. Bond, and P. Reuter. 2010. Reducing drug trafficking revenues and violence in Mexico: Would legalizing marijuana in California help? Santa Monica, CA: RAND Corporation. https://www.rand.org/pubs/occasional_papers/OP325.html (accessed April 1, 2024).
Kilmer, B., J. P. Caulkins, G. Midgette, L. Dahlkemper, R. J. MacCoun, and R. L. Pacula. 2013. Before the grand opening: Measuring Washington state’s marijuana market in the last year before legalized commercial sales. Santa Monica, CA: RAND Corporation.
Kilmer, B., J. P. Caulkins, and S. S. Everingham. 2014. What America’s users spend on illegal drugs, 2000–2010. Santa Monica, CA: RAND Corporation. https://www.rand.org/pubs/research_reports/RR534.html (accessed July 5, 2024).
Kilmer, B., S. Davenport, R. Smart, J. P. Caulkins, and G. Midgette. 2019. After the grand opening: Assessing cannabis supply and demand in Washington state. Santa Monica, CA: RAND Corporation.
Kilmer, B., J. P. Caulkins, M. Kilborn, M. Priest, and K. Warren. 2021. Cannabis legalization and social equity: Some opportunities, puzzles, and trade-offs. Boston University Law Review 111(3).
Kilmer, J. R., I. C. Rhew, K. Guttmannova, C. B. Fleming, B. A. Hultgren, M. S. Gilson, R. L. Cooper, J. Dilley, and M. E. Larimer. 2022. Cannabis use among young adults in Washington state after legalization of nonmedical cannabis. American Journal of Public Health 112(4):638–645.
Levy, N. S., P. M. Mauro, C. M. Mauro, L. E. Segura, and S. S. Martins. 2021. Joint perceptions of the risk and availability of cannabis in the United States, 2002–2018. Drug and Alcohol Dependence 226.
Mikos, R. A. 2021. Interstate commerce in cannabis. 101 Boston University Law Review 857. Vanderbilt Law Research Paper 21-09. https://ssrn.com/abstract=3796262 (accessed April 1, 2024).
Midgette, G., S. Davenport, J. P. Caulkins, and B. Kilmer. 2019. What America’s users spend on illegal drugs, 2006–2016. Santa Monica, CA: RAND Corporation.
MPG Consulting and Leeds School of Business. 2021. Regulated marijuana market update. Commissioned by the Colorado Department of Revenue’s Marijuana Enforcement Division.
OLCC (Oregon Liquor and Cannabis Commission). 2019. Recreational marijuana supply and demand legislative report. https://www.oregon.gov/olcc/marijuana/Documents/Bulletins/2019%20Supply%20and%20Demand%20Legislative%20Report%20FINAL%20for%20Publication(PDFA).pdf (accessed July 4, 2024).
OLCC. 2023. Recreational marijuana supply and demand legislative report. https://www.oregon.gov/olcc/Docs/reports/2023-Supply-and-Demand-Report.pdf (accessed July 4, 2024).
Perez-Reyes, M. 1990. Marijuana smoking: Factors that influence the bioavailability of tetrahydrocannabinol. NIDA Research Monograph 99:42–62.
Prestemon, J. P., F. H. Koch, G. H. Donovan, and M. T. Lihou. 2019. Cannabis legalization by states reduces illegal growing on US national forests. Ecological Economics 164:106366.
Resing, C. 2019. Marijuana legalization is a racial justice issue. American Civil Liberties Union. https://www.aclu.org/news/criminal-law-reform/marijuana-legalization-racial-justice-issue (accessed April 22, 2024).
Reuter, P. 1983. Disorganized crime: Economics of the visible hand. Cambridge, MA: MIT Press.
Reuter, P., and A. R. K. Mark. 1986. Risks and prices: An economic analysis of drug enforcement. Crime and Justice 7:289–340.
Roberts, S. C. M., C. Zaugg, and M. A. Biggs. 2023. Association of mandatory warning signs for cannabis use during pregnancy with cannabis use beliefs and behaviors. JAMA Network Open 6(6):E2317138.
SAMHSA (Substance Abuse and Mental Health Services Administration). n.d.-a. 2020 National Survey on Drug Use and Health (NSDUH) Releases. https://www.samhsa.gov/data/release/2020-national-survey-drug-use-and-health-nsduh-releases (accessed July 14, 2024).
SAMHSA. n.d.-b. National Survey on Drug Use and Health (NSDUH) population data. https://www.datafiles.samhsa.gov/dataset/national-survey-drug-use-and-health-2020-nsduh-2020-ds0001#:~:text=In%202020%2C%20NSDUH%20began%20using,interviews%20in%20the%20fourth%20quarter (accessed July 14, 2024).
Schoenberg, S. 2023. Marijuana content labels can’t be trusted. Commonwealth Beacon, December 18. https://commonwealthbeacon.org/marijuana/marijuana-content-labels-cant-be-trusted/ (accessed. May 15, 2024).
Schwabe, A. L., V. Johnson, J. Harrelson, and M. E. McGlaughlin. 2023. Uncomfortably high: Testing reveals inflated THC potency on retail cannabis labels. PLoS ONE 18(4): e0282396.
Semmler, E. 2022. Marijuana prices likely to keep falling in Niles, Buchanan and other Michigan towns. South Bend Tribune, March 21. https://www.southbendtribune.com/story/news/2022/03/21/legal-pot-marijuana-cannabis-prices-fall-michigan-niles-buchanan/7089651001/ (accessed May 15, 2024).
Smart, R., J. P. Caulkins, B. Kilmer, S. Davenport, and G. Midgette. 2017. Variation in cannabis potency and prices in a newly legal market: Evidence from 30 million cannabis sales in Washington state. Addiction 112(12):2167–2177.
Spindle, T. R., D. J. Sholler, E. J. Cone, T. P. Murphy, M. ElSohly, R. E. Winecker, R. R. Flegel, M. O. Bonn-Miller, and R. Vandrey. 2022. Cannabinoid content and label accuracy of hemp-derived topical products available online and at national retail stores. JAMA Network Open 5(7):e2223019–e2223019.
St. John, P. 2022. The reality of legal weed in California: Huge illegal grows, violence, worker exploitation and deaths. LA Times, September 8. https://www.latimes.com/california/story/2022-09-08/reality-of-legal-weed-in-california-illegal-grows-deaths (accessed May 15, 2024).
USDA (United States Department of Agriculture). 2020. Farms and land in farms 2019 summary. National Agricultural Statistics Service. https://www.nass.usda.gov/Publications/Todays_Reports/reports/fnlo0220.pdf (accessed April 30, 2024).
Wadsworth, E., P. Driezen, R. L. Pacula, B. Kilmer, and D. Hammond. 2023. Prices and purchase sources for dried cannabis flower in the United States, 2019-2020. Cannabis and Cannabinoid Research 8(5):923–932.
Wood, S., R. Gabrys, T. Freeman, and D. Hammond. 2024. Canada’s THC unit: Applications for the legal cannabis market. International Journal of Drug Policy 128:104457.
Young-Wolff, K. C., T. R. Foti, A. Green, A. Altschuler, M. B. Does, M. Jackson-Morris, S. R. Adams, D. Ansley, A. Conway, N. Goler, M. N. Mian, and E. Iturralde. 2022. Perceptions about cannabis following legalization among pregnant individuals with prenatal cannabis use in California. JAMA Network Open 5(12):E2246912.
Zoorob, M. J. 2021. The frequency distribution of reported THC concentrations of legal cannabis flower products increases discontinuously around the 20% THC threshold in Nevada and Washington state. Journal of Cannabis Research 3(1):6.
This page intentionally left blank.


