Tactile Wayfinding in Transportation Settings for Travelers Who Are Blind or Visually Impaired: Volume 1: Conduct of Research (2025)
Chapter: 4 Experiment 1: Detection and Identification Trials in a Controlled Environment
CHAPTER 4
Experiment 1: Detection and Identification Trials in a Controlled Environment
There were two main objectives for this experiment:
- Determine the relative detectability of two TDI (i.e., bars) geometries and two DWSs (i.e., truncated domes) geometries when approached from various angles.
- Determine the relative identifiability of these TDI and DWS surfaces by foot.
Setting
An outdoor asphalt parking lot in moderate condition with some cracking and variable slopes that was adjacent to a surplus warehouse owned and operated by the University of North Carolina at Chapel Hill served as the lab setting for the first experiment. An area of approximately 55 × 95 ft (17 × 29 m) was marked off with cones and caution tape to ensure vehicles remained outside the study area in the large open lot, while a series of TWSIs were temporarily installed (see Figure 1).
Surfaces Tested
The five surfaces listed in Table 2 were tested for detectability and identifiability. The Table 2 TDI and DWS surfaces varied in dimensions and spacing of the raised elements. All surfaces were provided by the same manufacturer as surface-applied polymer panels to allow for temporary installation and reuse in different configurations in the subsequent experiments. The fifth “blank surface” represents the base panel material alone, which is 0.13 in. (3.2 mm) high with no raised elements atop the panel. All surfaces with raised elements were a nominal 0.22 in. (5.6 mm) high.
Design drawings showing these specific dimensions laid out in both an aerial and a profile view for each TWSI to be tested are given in Figures 2 and 3.
While the gap between the edges of tops of raised elements is not a typically provided dimension, a hypothesis tested through experiment 1 is that larger gaps between these elements are associated with better identifiability and better discriminability between TWSI types. Therefore, this study helped to determine whether the gap distance is critical to identifiability and discriminability between DWSs and TDIs. The gaps are a function of dome top diameter (or raised bar top width) and center spacing, and are computed as:
(Spacing between center points of elements) − (top width or dilameter element)
= gap between top edges of elements
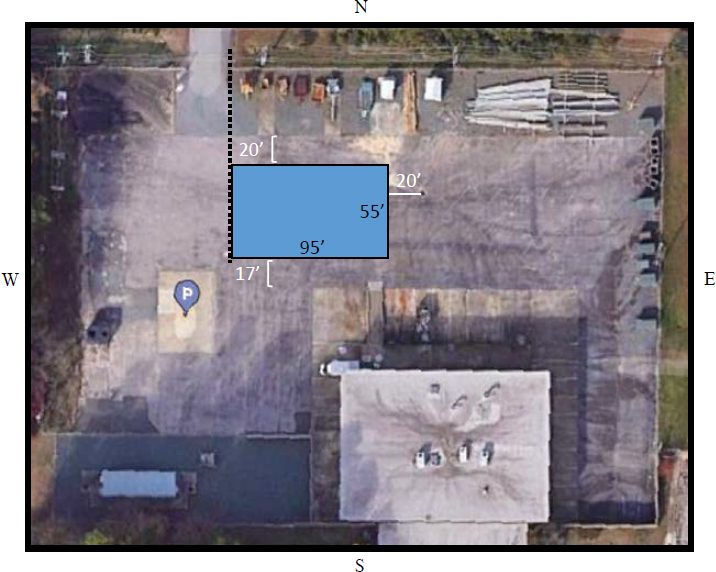
Note: Treatment installation occurred in the 55 × 95 ft (17 × 29 m) area indicated in blue.
Figure 1. Aerial image of 2700 Homestead Road’s rear parking lot used as the laboratory for Experiment 1.
Selection of the geometry for the two DWS types was based on existing product choices of extreme differences in center-to-center spacing between the domes in the U.S. market that comply with the 2010 ADA standards. The known dimensions of a large majority of DWSs on the market have dome base diameters of 0.9 to 0.94 in. (22.8 to 24 mm). Dome top diameter and center-to-center spacing is more variable, resulting in gap spacings in DWSs currently used in the United States of 1.2 to 1.9 in. (30.9 to 49.5 mm). Due to working with a specific vendor’s product, the gap spacings tested were 1.2 in. (30.2 mm) for DWS-1 and 1.9 in. (47.5 mm) for DWS-2.
Variations in TDI geometries were selected for testing based on their emerging use in the United States, in combination with Japanese research. TDI-1 (“typical bars”) is one of the few on the market in the United States. The dimensions are similar to those in one of the two TDIs found to be most discriminable from truncated domes in Japanese research. TDI-2 (“narrow bars”) is not commercially available in the United States. It is, however, the other surface that was found to be most discriminable from truncated domes in Japanese research. Each bar is narrower and the gap between bars is wider than TDI-1. This was desirable to help establish the range of TDI geometry that will provide good detectability and discriminability from DWSs.
The detectability of the blank surface panel was also evaluated to determine how much of a role the material or nature of the application may have played in the detection of the test surfaces.
Table 2. Test surfaces and the dimension specifications of their raised elements.
| Surface Type | Top Width/Diam. of Element (mm) | Base Width/Diam. of Element (mm) | Spacing between Center Points of Elements (mm) | Gap between Top Edges of Elements (mm) |
|---|---|---|---|---|
| DWS-1: narrow spacing | 12.20 | 22.90 | 42.40 | 30.20 |
| DWS-2: wide spacing | 12.20 | 22.90 | 59.70 | 47.50 |
| TDI-1: typical bar | 22.20 | 33.40 | 76.20 | 53.99 |
| TDI-2: narrow bar | 8.00 | 18.00 | 76.20 | 68.20 |
| Blank surface: base material | n/a | n/a | n/a | n/a |
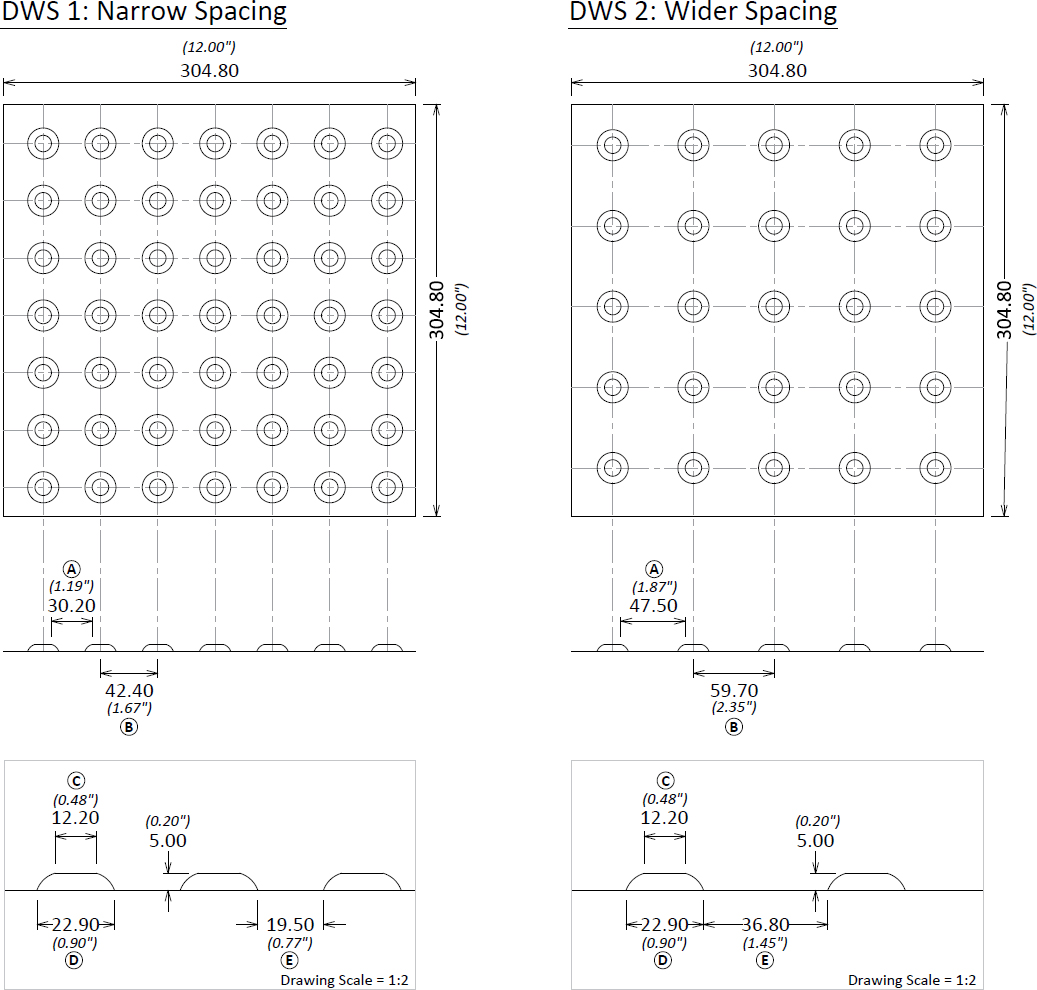
Figure 2. Dimensions for each DWS geometry tested.
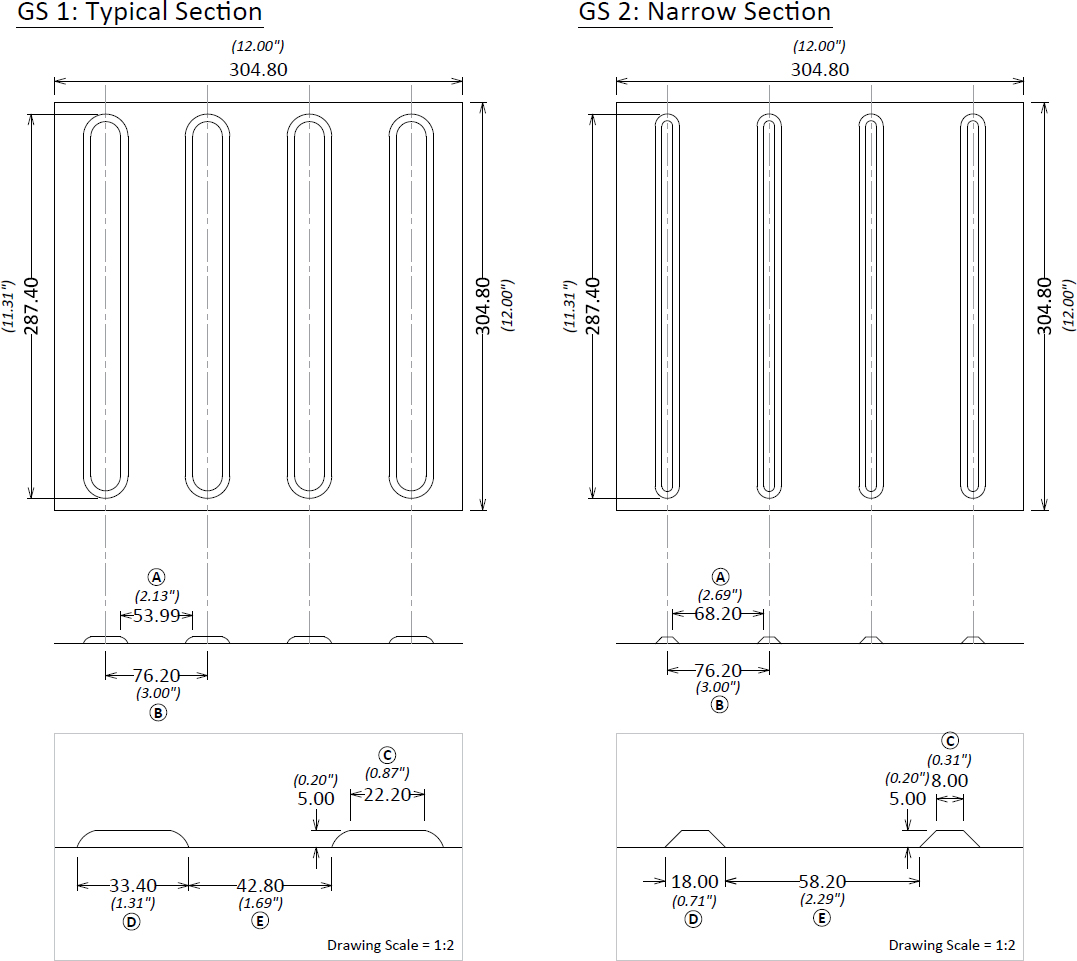
Figure 3. Dimensions for each TDI geometry tested.
Configurations Tested
For the detection trials, all five surface types (the TWSIs and the blank surface) were laid out in the parking lot before the trials began and temporarily affixed to the asphalt with tape to ensure they remained in place throughout the study. Each surface type was laid out in a straight 20 × 2 ft (6.1 × 0.6 m) strip, avoiding noticeable cracks or significant areas of sloping in the lot. TWSI strips were spaced such that there was a minimum of 22 ft (6.7 m) of clear approach to each surface from a wide range of angles (approximate layout of surfaces and approaches used are shown in Figure 4).
For the identification trials, a 2 ft × 2 ft (0.6 m × 0.6 m) square of each of the four TWSI surfaces was installed (shown at the northwest corner of the test area; top left of Figure 4).
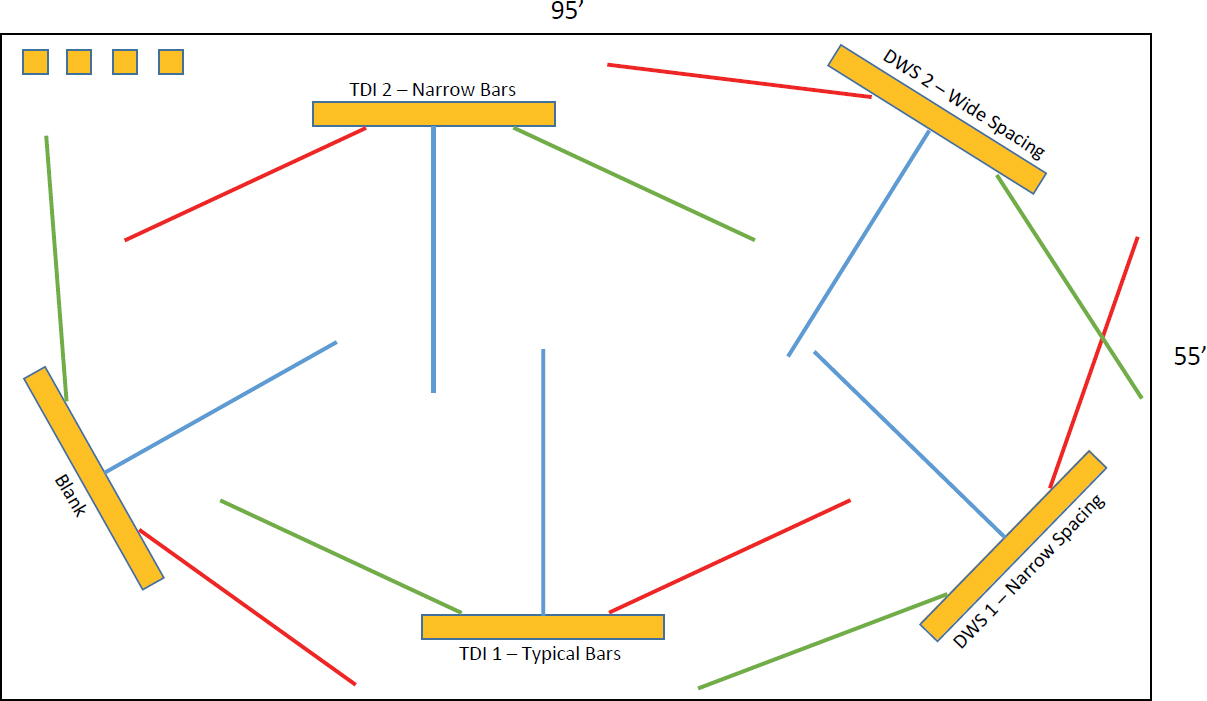
Figure 4. Schematic layout for testing detectability and identifiability of TWSIs for experiment 1.
Procedure
A COMS familiarized the participant with each of the five surfaces. Participants were given a sound-occluding headset to be worn during detection trials, so they were unable to use auditory cues produced by contacting the surfaces with a long cane or with their feet. Such auditory cues might be highly evident in the controlled environment but would likely be far less evident or available in noisy transportation environments or to people who have reduced hearing.
Participants completed all experimental tasks individually. They were guided from one starting location to the next and given instructions for each trial by the COMS, who also monitored their safety using customary verbal or physical techniques. A second researcher recorded directly observed data.
For the detection task, participants were asked to approach each of the five surfaces eight times for a total of 40 trials, and to stop when they detected a surface either in front of them or beside them on the left or right, and to say that they found a surface. Participants approached each surface straight on (90 degrees) four times, from the left twice, and from the right twice (approximately 25-degree angles to the left and to the right). Four approach distances were used—approximately 10, 14, 18, and 22 ft (3, 4, 5.5, and 6.7 m)—and perpendicular and angled approaches were interwoven so participants were not able to predict the distance they would need to walk before reaching a surface or whether the surface would be in front of them or to their left or right. Surfaces, approach angle, and approach distance were counterbalanced across participants (see Figure 5).
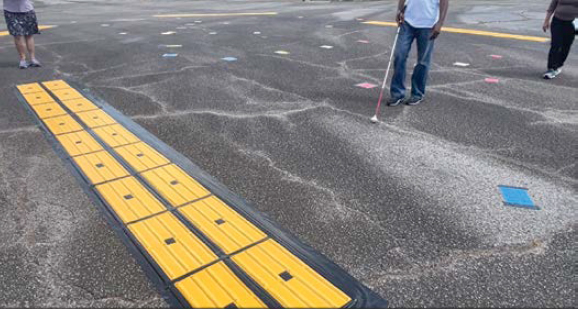
Figure 5. Example of participant approaching the TDI-2 (narrow bars) surface from a 90-degree angle during a detection trial.
For the identification task, participants were guided onto each of the four textured surfaces (not including the blank surface) from 90 degrees and from random angles (approximately 25–45 degrees) to the left or the right, and then guided off the surfaces after no more than 3 seconds. For the 90-degree approach, the TDIs were oriented such that the bars were perpendicular underfoot to the participants’ direction of travel. They did not use a long cane for this task; identification was based solely on information perceived through the feet for these trials. This was done eight times for each surface type for a total of 32 trials: four trials with a 90-degree approach and four with a 25-to-45-degree approach. Each time participants stepped onto and then off a surface they were asked to say whether they thought they had just been on domes or bars. They were not asked to discriminate between the two types of domes or the two types of bars. Within the 3-second period on top of the TWSI, participants could rock back and forth or shuffle their feet to explore the test surface. After identifying each surface, they were asked to rate their confidence in their identification. Surfaces and approach angles were randomized across the 32 identification trials per participant (see Figure 6).
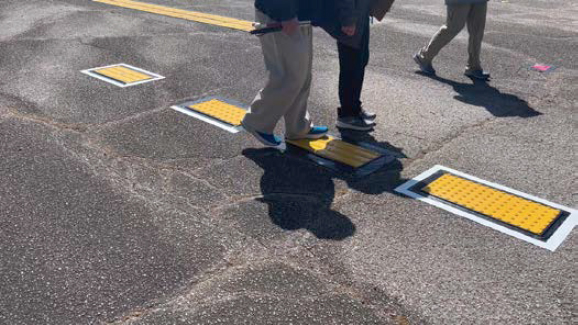
Figure 6. Example of participant stepping onto the TDI-1 (typical bars) surface during an identification trial.
Data Collected
Data collected by the research team through observation was used to understand the performance of the different surfaces tested for detection and identification (see Appendix C for a few sample components of the data collection form used to record observations). Measures included whether, when, and/or how the participant:
- Accomplished detection tasks:
- – When the TWSI detection was announced: after the cane contacted the TWSI and before their feet contacted it, after one foot contacted the TWSI, after having crossed the surface completely, or they never detected the TWSI
- – How far onto the surface was the participant when detection was announced: within the first half (12 in./0.3 m) of the TWSI, or within the second half of the TWSI
- Accomplished identification tasks:
- – Identified the surface type (domes or bars)
- – Confidence in identification (very unsure, somewhat sure, or very sure)
Participant interviews were conducted following detection and identification trials to provide a deeper understanding of participants’ experience. Participants were asked:
- Which DWS they preferred and why
- Which TDI they preferred and why
- Whether they felt there was any TWSI that should not be used and why
- For any other suggestions or comments
Analysis and Results
Twenty participants, who self-reported being unable to ever see crosswalk lines, curbs, or poles, were recruited to conduct the detection and identification trials. Participants ranged in age from 32 to 75 years with an average age of 60 years. Twelve of the participants were male (60%). Seven participants used a guide dog as their primary travel aid, though all were skilled at traveling with a long cane. All participants had been traveling independently for at least 4 years, with an average of 30 years of independent travel experience among them.
The analysis plan for all dependent variables (measures of detection, identification, and identification confidence) involved conducting two-way repeated-measures analyses of variance (ANOVAs) that included two independent variables: the surface type (5 levels) and the angle of approach (2 levels: perpendicular, not perpendicular). The results were reviewed for interaction effects of the two variables. Where interactions were present, analysis then focused on the simple main effects; where interactions were not present, analysis focused on the main effects of each variable. Greenhouse-Geisser corrections were employed where there were violations of sphericity, and Bonferroni corrections for multiple comparisons were performed when considering paired comparisons between individual conditions/levels.
Detection Trials
This experiment was designed to evaluate whether two geometric designs/specifications for truncated domes and for raised bars resulted in different detectability. The detection data includes 800 trials in total (40 trials by each of 20 participants). The analysis focuses on the rates of detection by cane only (participants announced that they had detected the surface after their cane contacted it, and before they contacted it with their feet), as well as by cane or foot (participants announced detection after their cane and feet had contacted the surface). For each participant, the percentage of each trial type (e.g., perpendicular approaches to DWS-1) detected in a particular
manner (e.g., the participant detected DWS-1 by cane contact on 75% of such trials) was computed. These percentages were then subjected to inferential analyses. The summary statistics of the mean values for detection rates (and identification and identification confidence) by surface type are shown in Table 3.
It was recorded on each trial if the participant announced having detected the surface after they contacted it with their cane and before they contacted it with their feet. To consider whether certain surfaces were more readily detectable by cane contact alone, a two-way repeated-measures ANOVA was conducted. There was no significant interaction between the effects of angle of approach and surface type on the likelihood to detect the surface with the cane alone [F(4,76) = 1.568, p > .05], nor was there a main effect of either surface type [F(4,76) = 2.403, p > 0.05] or angle of approach [F(1,19) = 1.690, p > 0.05]. As a result of the lack of significant effects, no further comparisons were performed. Detectability by cane was statistically equivalent for all surfaces, including the blank surface, with participants announcing detection of the surface after contacting it with their cane and prior to contacting it with their foot in 65% of individual trials on average.
As a measure of total detection, it was recorded on each trial if the participant announced having detected the surface before fully crossing over the surface. These detections could thus have occurred based on cane contact only or based on a combination of cane contact followed by foot contact with the surface. To consider whether certain surfaces were overall more readily detectable, be it by cane or foot contact, a two-way repeated-measures ANOVA was conducted. There was no significant interaction between the effects of angle of approach and surface type on the likelihood to detect the surface with the cane or foot [F(2.3,44.0) < 1.0]. There was no significant effect of the angle of approach [F(1,19) < 1.0] or surface type [F(2.4,46.4) = 2.556, p > 0.05] on total detection. The average total detection rate (i.e., detection by cane or foot) was 95% or greater for all five test surfaces, including for the blank surface. When considering only those trials where participants announced detection after making foot contact with the surface, 70% of the time that detection came while their feet were within the first 12 in. (30.5 cm), while the other 30% of the time their feet had reached the second half of the surface but were still in contact with the surface when detection was announced. For all trials and all surfaces, participants announced detection once their feet were into the second half of the TWSI on 9.6% of trials (77 of 800). With the four TWSI surfaces, participants only ever fully crossed the surface prior to stating that they detected it, or without ever detecting it, on 2.2% of trials (14 of 640 trials).
Identification Trials
On each trial, it was recorded whether the participant correctly identified the surface as having domes or bars, and the confidence score they assigned to each individual judgment. Summary statistics are shown in Table 3.
Table 3. Experiment 1 results.
| Average percentage of trials where surface detection was announced based on cane contact only | Average percentage of trials where surface detection occurred after cane and foot contact | Average percentage of trials where surface was identified correctly | Average confidence rating for identification judgments (scale 1–3, 3 being high confidence) | |
| DWS-1 | 63.1% | 98.1% | 73.3% | 2.25 |
| DWS-2 | 60.6% | 98.8% | 74.4% | 2.45 |
| TDI-1 | 61.9% | 95.6% | 79.4% | 2.57 |
| TDI-2 | 73.1% | 98.8% | 75.6% | 2.52 |
| Blank | 66.2% | 95.0% | NA | NA |
Note: There were no statistically significant effects of surface type for any of the variables reported here.
To consider whether certain surfaces were more readily identifiable by relatively short (maximum 3 s) foot contact, a two-way repeated-measures ANOVA was conducted. There was no significant interaction between the effects of angle of approach and surface type on the likelihood to correctly identify the surface [F(3,57) < 1.0], nor was there a main effect of either surface type [F(3,57) < 1.0] or angle of approach [F(1,19) < 1.0]. As a result of the lack of significant effects, no further comparisons were performed. While the average rate for correct identification of all surfaces was around 75%, participants expressed a degree of confidence in their judgement. The overall confidence score averaged around 2.45 (scale of 1–3, 3 being high confidence), and there were no significant differences in the average confidence ratings for the identifications of the different surfaces [F(1.6,29.9) = 2.500, p > 0.05].
When asked which bar geometry they thought might work best for guidance, half the participants liked the wide flat-topped bars. When asked if one type of bar would not be good for guidance, four participants felt the narrow bars would not be good, while 75% felt either could work.
Experiment 1 Conclusion
There was no statistically significant difference in detectability performance between any of the five surfaces tested, including the blank surface with no raised elements. Participants announced having detected the surface based on cane contact alone on average in 65% of individual trials, while all five test surfaces were detected 95% of the time or more by cane or foot. This demonstrates that each surface was highly detectable. The similarity in detectability of the blank and TWSI surfaces does raise a concern that the detectability in this experiment might have to do with the specific material (fiberglass polymer panels), the nature of the temporary surface application, and/or the application being atop somewhat rough asphalt. However, Bentzen, Scott, and Myers (2020) performed somewhat similar detection trials for one DWS and two TDI geometries using TWSIs made of a different material (high-polymer concrete) and installed differently (cast in place in a thick mortar base). Despite different materials and installations, rates of detection by cane of the TWSIs in that study were in fact higher than those reported here (84% vs. 65%), while the total detection rate by cane or foot was likewise very high in both studies (around 98%). The combined results of both studies suggest that DWSs and TDIs with raised elements that are a nominal 0.2 in. (5.6 mm) high are highly detectable, and that detectability remains high for surfaces that vary some with regard to the exact geometries of the surface elements and their positioning (see Figures 2 and 3 and Bentzen, Scott, and Myers 2020 for details on geometries tested).
There were also no statistically significant differences in participants’ ability to correctly identify the four TWSI surfaces as either domes or bars. The average rate of correct identification was around 75%, a rate similar to the 81% correct identification reported for the three different TWSI surfaces (one DWS and two TDIs) tested by Bentzen, Scott, and Myers.
When considering the results of both detection and identification trials, neither TDI surface significantly outperformed the other. Participants generally felt that either TDI surface could be used effectively for guidance, but 20% thought the narrow bars (TDI-2) would not be as effective. Though Bentzen, Scott, and Myers also found no significant differences in the detectability of two TDI geometries that compared wider and narrower bars, in that research, the wider bars were identified accurately at a significantly higher rate than narrower bars. Therefore, the combination of these findings with previous research resulted in selecting TDI-1, with the wider flat-topped bars, as the surface type to be used in experiments 2 and 3.
Similarly, neither DWS surface stood out as significantly or consistently outperforming the other in the research reported here. Therefore, since the wider dome spacing of DWS-2 is the most common geometry sold in the United States, DWS-2 is the surface type used in experiments 2 and 3.


