Mobile Devices as a Tool for Digitized Project Documentation and Inspection (2024)
Chapter: 3 State of the Practice

CHAPTER 3
State of the Practice
As noted in Chapter 1, an online survey questionnaire and a fillable PDF were built and distributed by email to the voting members of the AASHTO COC. A total of 43 responses across 50 state DOTs and the District of Columbia DOT (84% responding) were received (Figure 3-1). The survey was broken down into seven sections:
- Demographic Information for Respondents
- Mobile Device Use, Including Overview
- Where Mobile Devices Are Used
- How Mobile Devices Are Used
- What Policies Are in Place
- Mobile Device Data Storage
- Mobile Device Challenges and Implications
Responses to questions are visualized in horizontal bar charts or heatmaps. The term n refers to the sample size; the term n = x in the figure captions refers to the total number (x) of responses (i.e., the basis of the percentages shown in the figure). Percentages in figures are rounded up or down for each response. For the responses of questions that are visualized as heatmaps, blue represents cells with values greater than 75% of the most frequent response; green represents cells with values between 50% and 75% of the most frequent response; yellow represents cells with values between 25% and 50% of the most frequent response; and gray represents cells with values less than 25% of the most frequent response. Appendix B details the DOTs’ responses to every question asked in the survey. Respondents were asked to share documentation or resources on mobile device policies, which are included in Appendix D. This chapter reports on results from key survey questions.
In Question 4 of the survey questionnaire in Appendix A, respondents were asked what division(s) they worked for within their DOT, with the option for multiple selections, from the following list: “Innovation,” “Highway Design,” “Planning Directory,” “CADD/Support,” “Surveying/Support,” “Construction,” “Inspection,” “Maintenance/Preservation,” “Geographic Information Division,” “Project Delivery Management,” “Asset Data Management,” “Materials/Pavements,” or” Other.” As represented in Figure 3-2, 86% (or 37) of the respondents work in the “Construction” division; 12% (or five) of the respondents work in the “Materials/Pavements” division; and 9% (or four) work in the “Project Delivery Management” division. Moreover, 7% (or three) of the respondents work in each of the “Inspection,” “Asset Data Management,” and “Innovation” divisions. Also, 5% (or two) of the respondents work in each of the “Maintenance/Preservation” and “Highway Design” divisions.
The total n in Figure 3-2 and subsequent figures with multiple selections will exceed the total n shown in the figure captions. However, in all cases, the n = x in the figure caption is the basis for calculating the percentages shown in the figure. Several survey questions offered respondents options and allowed for multiple selections.


One response was collected each from respondents who work in the “Geographic Information,” “Planning Directory,” “CADD/Support,” and “Surveying/Support” divisions.
3.1 Mobile Device Use
This section provides information on the use of mobile devices (Questions 5 through 14 of the survey questionnaire in Appendix A). It covers an overview of the use of mobile devices, the level of reliance on mobile devices within an agency, the usage of mobile devices for 21 inspection functions, and the availability of policies for the use of mobile devices.
3.1.1 Overview of Mobile Device Use
This section provides information on the overall use of mobile devices (Questions 5 through 9 of the survey questionnaire in Appendix A). It covers (1) the use of mobile devices within an agency, (2) the use of mobile devices among inspectors, (3) an overview of inspectors’ use of business and personal devices, (4) the means to provide mobile devices to inspectors, and (5) the methods to administer and update mobile devices provided by contractors.
3.1.1.1 Level of Mobile Device Use Within Agency
Respondents were asked to indicate all the levels within their DOT to which mobile devices are issued (Question 5 of the survey questionnaire in Appendix A). The survey offered respondents options and allowed for multiple selections. The following results are shown in Figure 3-3:
- 91% (or 39 of 43 respondents) indicated mobile devices are issued to “In-House Inspectors” and “Engineer.”
- 84% (or 36 respondents) indicated their agency issues mobile devices to the “Manager or Equivalent.”
- 81% (or 35 of 43 respondents) indicated their agency issues mobile devices to the “Division Director” and “Upper Executive Management.”
- 53% (or 23 of 43 respondents) indicated mobile devices are issued to “Superintendent.”

- 49% (or 21 of 43 respondents) indicated mobile devices are issued to “Construction Engineering and Inspection (CEI) consultants.”
- 14% (or six of 43 respondents) reported “Other,” and the following responses were provided: “Project Engineers - Construction Resident Engineer,” “Central Office Construction Support,” and “All field assigned individuals, Maintenance Staff; Technologists.”
3.1.1.2 Level of Mobile Devices Used by Inspectors and CEI Consultants
Respondents who indicated that mobile devices are issued to in-house inspectors or CEI consultants were asked to indicate the percentage of their agency’s in-house inspectors and CEI consultants that use mobile devices to perform their work (Question 6a of the survey questionnaire in Appendix A). The following results are shown in Figure 3-4:
- 72% (or 28 of 39 respondents) indicated that “75–100%” of their agency’s in-house inspectors use mobile devices to perform their work.
- 15% (or six of 39 respondents) noted that “50–75%” of their agency’s in-house inspectors use mobile devices to perform their work.
- 5% (or two of 39 respondents) said that “25–50%” of their agency’s in-house inspectors use mobile devices to perform their work.
- 8% (or three of 39 respondents) reported that “0–25%” of their agency’s in-house inspectors use mobile devices to perform their work.
Respondents who indicated that their agency issues mobile devices to CEI consultants were asked to indicate the percentage of their agency’s CEI consultants that use mobile devices to perform their work (Question 6b of the survey questionnaire in Appendix A). As noted in Figure 3-5, 90% (or 19 of 21 respondents) indicated that “75–100%” of their CEI consultants use mobile devices to perform their work. Ten percent (or two of 21 respondents) reported that “25–50%” of their CEI consultants use mobile devices to perform their work.
3.1.1.3 Type of Mobile Devices Used by Inspectors and CEI Consultants
Respondents who indicated that mobile devices are issued to in-house inspectors or CEI consultants were asked to indicate on a sliding scale (between 0% and 100%) the percentage of inspectors who use business mobile devices and the percentage of inspectors who use personal mobile devices to perform their work (Question 7 of the survey questionnaire in Appendix A).


As shown in Figure 3-6, the 37 responding DOTs indicating that their in-house inspectors use mobile devices reported that, on average, 84% (or 31 of 37 respondents) of their in-house inspectors are issued “business mobile devices,” and 16% (or six of 37 respondents) of their in-house inspectors use “personal mobile devices.”
As shown in Figure 3-7, the 20 responding DOTs indicating that their CEI consultants use mobile devices reported that, on average, 75% (or 15 of 20 respondents) of their CEI consultants are issued “business mobile devices,” and 21% (or four of 20 respondents) of their CEI consultants use “personal mobile devices.”
3.1.1.4 Providing Inspectors with Mobile Devices
Respondents who indicated that mobile devices are issued to in-house inspectors or CEI consultants were asked to indicate how mobile devices are provided to inspectors (Question 8a of the survey questionnaire in Appendix A). The survey offered respondents options and allowed for multiple selections. The following results are shown in Figure 3-8:
- 91% (or 39 of 43 respondents) stated that mobile devices are “provided by the agency” to inspectors.
- 12% (or five of 43 respondents) indicated mobile devices are “provided by the contractor” to inspectors.
- 23% (or 10 of 43 respondents) selected “Other”; they were asked to elaborate on this selection.

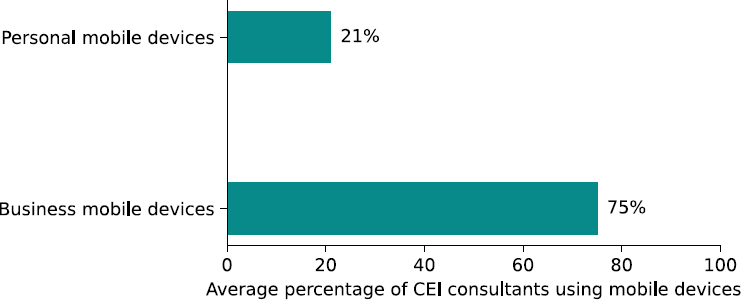
Figure 3-7. Average percentage of CEI consultants using business mobile devices and personal devices to perform their work (n = 20) (Q7).
“Other” respondents offered the following responses:
- “Stipend for personnel mobile phones offered”
- “Paid Expense for CEI; Not provided for in-house inspectors”
- “Stipend to use Personal Mobile Device”
- “CEI Consultant”
- “Consultant provides the devices for their employee”
- “Inspectors are not issued mobile devices at this time”
- “Department devices provided to department inspectors. Consultants provide their inspectors with their company’s devices.”
- “We provide all in house inspectors with mobile equipment. Require all CEI to provide their own.”
- “Stipend Provided to Employees for using personal devices”
3.1.1.5 Administering Mobile Devices Provided by Contractors
Respondents who indicated that mobile devices are provided to inspectors by contractors were asked to indicate how mobile devices are administered and updated (Question 8b of the survey questionnaire in Appendix A). The survey offered respondents options and allowed for multiple selections (Figure 3-9). Four of five of respondents indicated that mobile devices provided by the

Figure 3-8. Mobile devices provided to inspectors (n = 43) (Q8a).
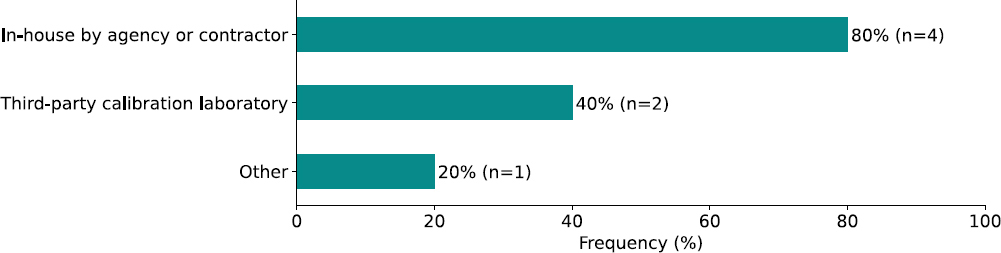
Figure 3-9. Administration and update of mobile devices provided by the contractor (n = 5) (Q8b).
contractor are administered and updated “In-house by agency or contractor,” and two of five respondents reported that mobile devices provided by the contractor are administered and updated by a “Third-party calibration laboratory.” One of five respondents stated that they have other methods for administration or updating of mobile devices, but no elaboration was provided.
3.1.2 Where Mobile Devices Are Used
Respondents were asked to indicate the level of reliance on mobile devices to perform work in planning, construction, and maintenance phases (Question 9 of the survey questionnaire in Appendix A). The following results are shown in Figure 3-10:
- 5% (or two of 42) of the respondents reported a “Very High” level of reliance on mobile devices during the planning phase.
- 2% (or one of 42) of the respondents indicated a “High” level of reliance on mobile devices.
- 24% (or 10 of 42) of the respondents indicated a “Moderate” level of reliance on mobile devices.
- 31% (or 13 of 42) of the respondents reported a “Low” level of reliance on mobile devices.
- 19% (or eight of 42) of the respondents said that their agency has a “Very Low” level of reliance on mobile devices.
- 19% (or eight of 42) of the respondents reported that they are “Uncertain” about the level of reliance of their agency on mobile devices.

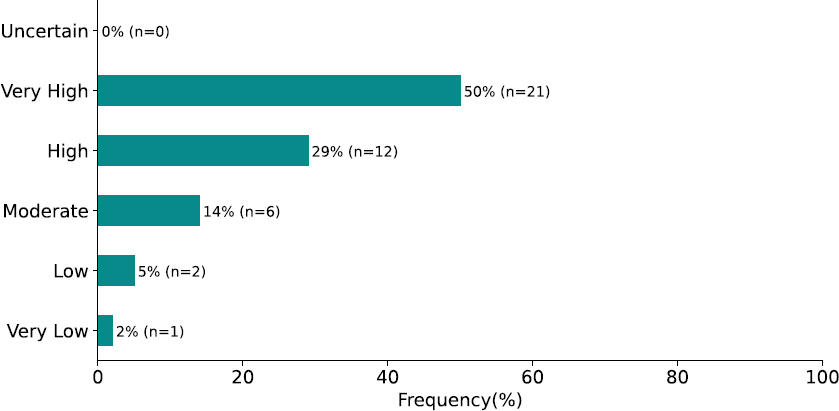
For the construction phase, Figure 3-11 shows the following results:
- 50% (or 21 of 42) of the respondents reported a “Very High” level of reliance on mobile devices.
- 29% (or 12 of 42) of the respondents indicated a “High” level of reliance on mobile devices.
- 14% (or six of 42) of the respondents indicated a “Moderate” level of reliance on mobile devices.
- 5% (or two of 42) of the respondents reported a “Low” level of reliance on mobile devices.
- 2% (or one of 42) of the respondents said that their agency has a “Very Low” level of reliance on mobile devices.
No respondents indicated that they are “Uncertain” about the level of reliance of their agency on mobile devices during construction.
For the maintenance phase, Figure 3-12 shows the following results:
- 14% (or six) of the respondents reported a “Very High” level of reliance on mobile devices.
- 17% (or seven) of the respondents indicated a “High” level of reliance on mobile devices.
- 28% (or 12) of the respondents indicated a “Moderate” level of reliance on mobile devices.

- 12% (or five) of the respondents reported a “Low” level of reliance on mobile devices.
- 5% (or two) of the respondents said that their agency has a “Very Low” level of reliance on mobile devices.
- 24% (or 10) of the respondents responded “Uncertain” about the level of reliance of their agency on mobile devices.
3.1.3 How Mobile Devices Are Used
This section provides information on how mobile devices are used for 21 inspection functions (Questions 10 through 12 of the survey questionnaire in Appendix A). It covers the mobile device applications used for the 21 inspection functions, the type of mobile device used, the mobile device capabilities to support the inspection functions and their mobile applications, the systems with which each of the 21 inspection functions and their mobile applications integrate, the technology they utilize, and the level of IT support needed to use the applications.
3.1.3.1 Applicability of Mobile Application/Software for Inspection Functions
Respondents were asked, for each of the 21 inspection functions supported through mobile devices, to indicate which mobile application/software is used and to select the mobile device capabilities supported by the application (Question 10 of the survey questionnaire in Appendix A). The heatmap in Figure 3-13 shows the responses of the responding DOTs per inspection function.
3.1.3.2 Mobile Device Applications and Capabilities Across Inspection Functions
Respondents were asked to indicate, for each of the 21 inspection functions, which mobile application/software is used on mobile devices (Question 10 of the survey questionnaire in Appendix A). Table 3-1 shows the mobile device applications used for inspection functions. The applications identified by the survey respondents for most inspection functions were mentioned only once (frequency 1); therefore, they are listed in alphabetical order in the table. However, applications for “Tracking: Tracking the position of bulk materials,” “Tracking: Tracking material delivery,” and “Access: Retrieving project documents” were mentioned more than once; therefore, these applications are reported in the order of their frequency rather than in alphabetical order.
3.1.3.3 Mobile Devices Used for Applications and Capabilities and Across Inspection Functions
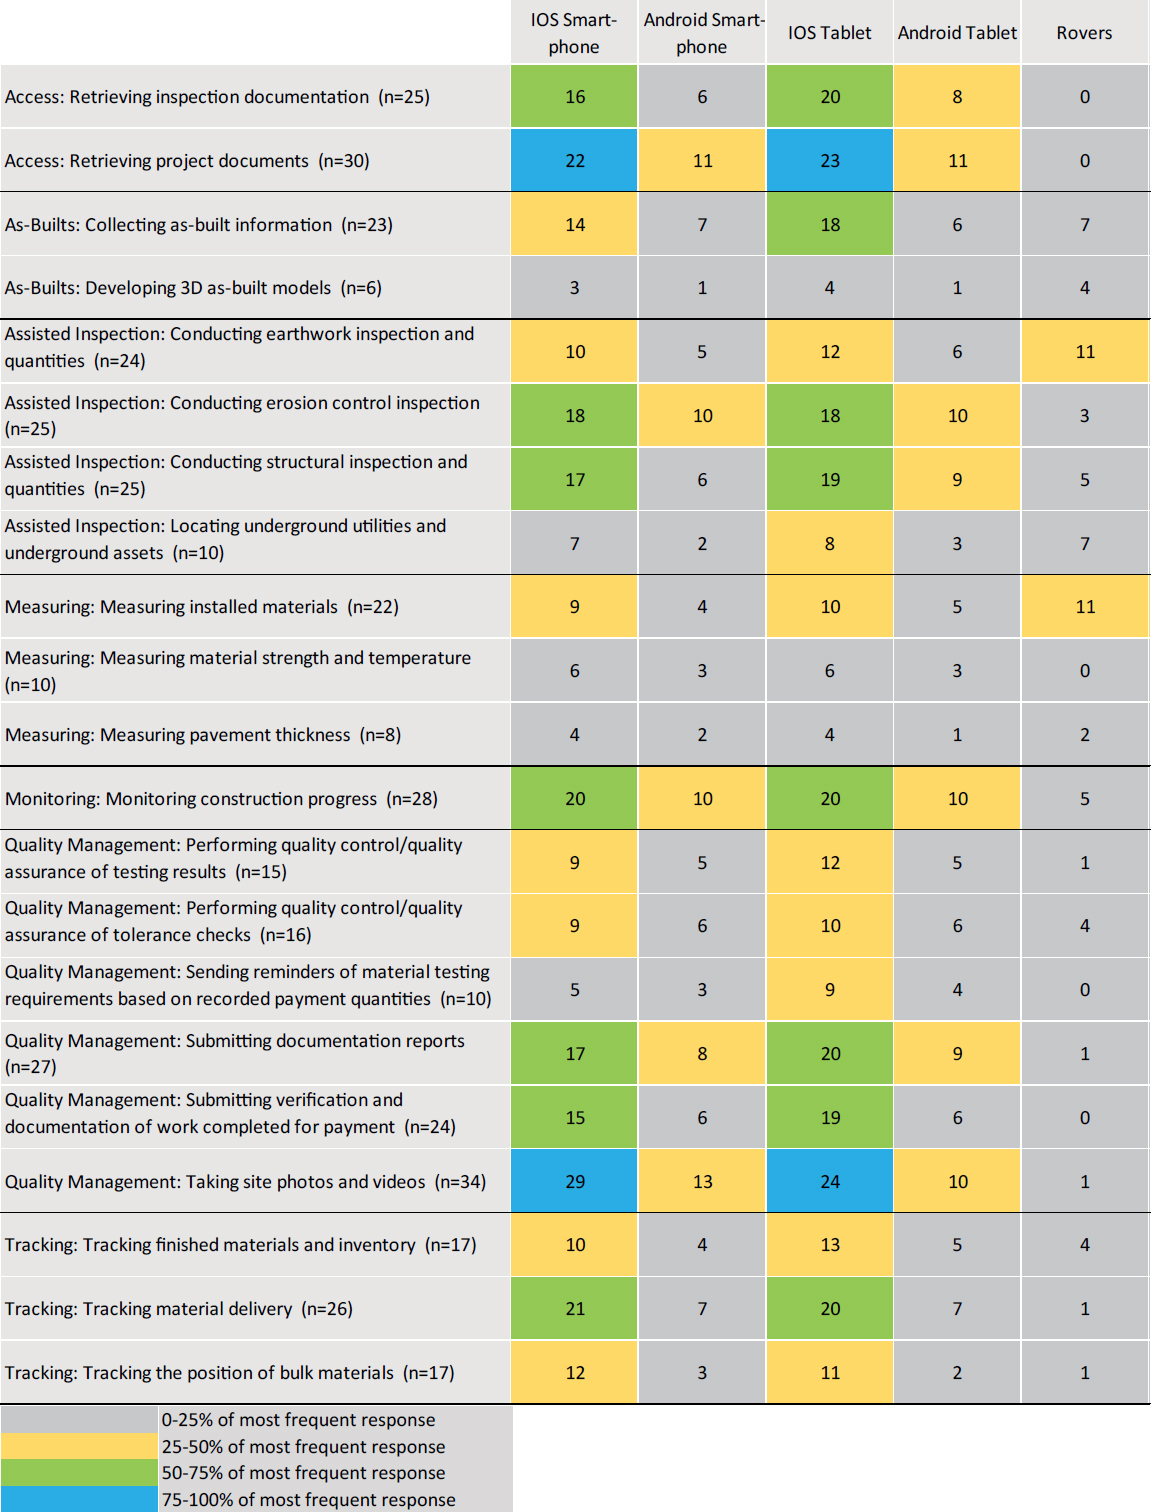
Respondents were asked to indicate, for each of the 21 inspection functions supported through mobile devices, which mobile device is used (Question 10 of the survey questionnaire in Appendix A). The results are shown in Figure 3-14, which features a heatmap of the mobile devices used for inspection functions. The survey offered respondents a list of devices and allowed for multiple selections. The heatmap shows that, for all inspection functions, DOTs indicated that they primarily use either an “iOS Smart-phone” or an “iOS Tablet.” DOTs reported that “Android Smart-phone” and “Android Tablet” are used less frequently for inspections; “Rovers” are rarely used for inspection functions.
3.1.3.4 Mobile Device Capabilities to Support Inspection Function and Mobile Application
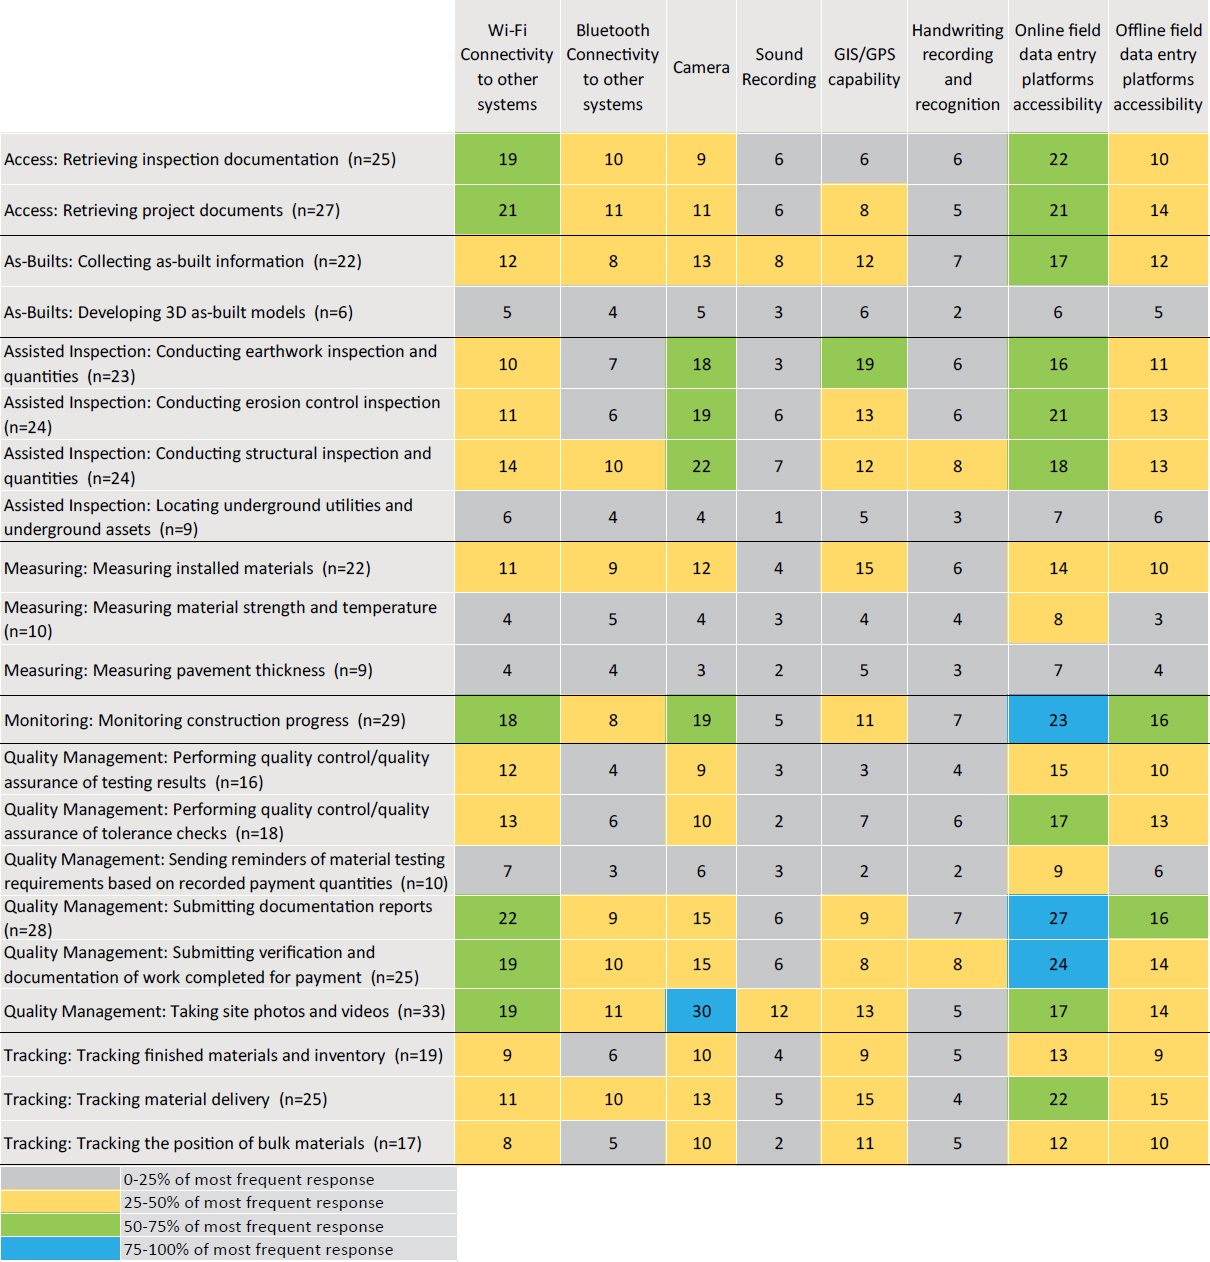
Respondents were asked to indicate, for each of the 21 inspection functions supported through mobile devices, their “Capabilities to Support the Inspection Function and its Mobile Application” (Question 10 of the survey questionnaire in Appendix A). Respondents were asked to select all options that apply. The results are provided in Figure 3-15, which features a heatmap of the capabilities to support the inspection function and its mobile application for 21 inspections.
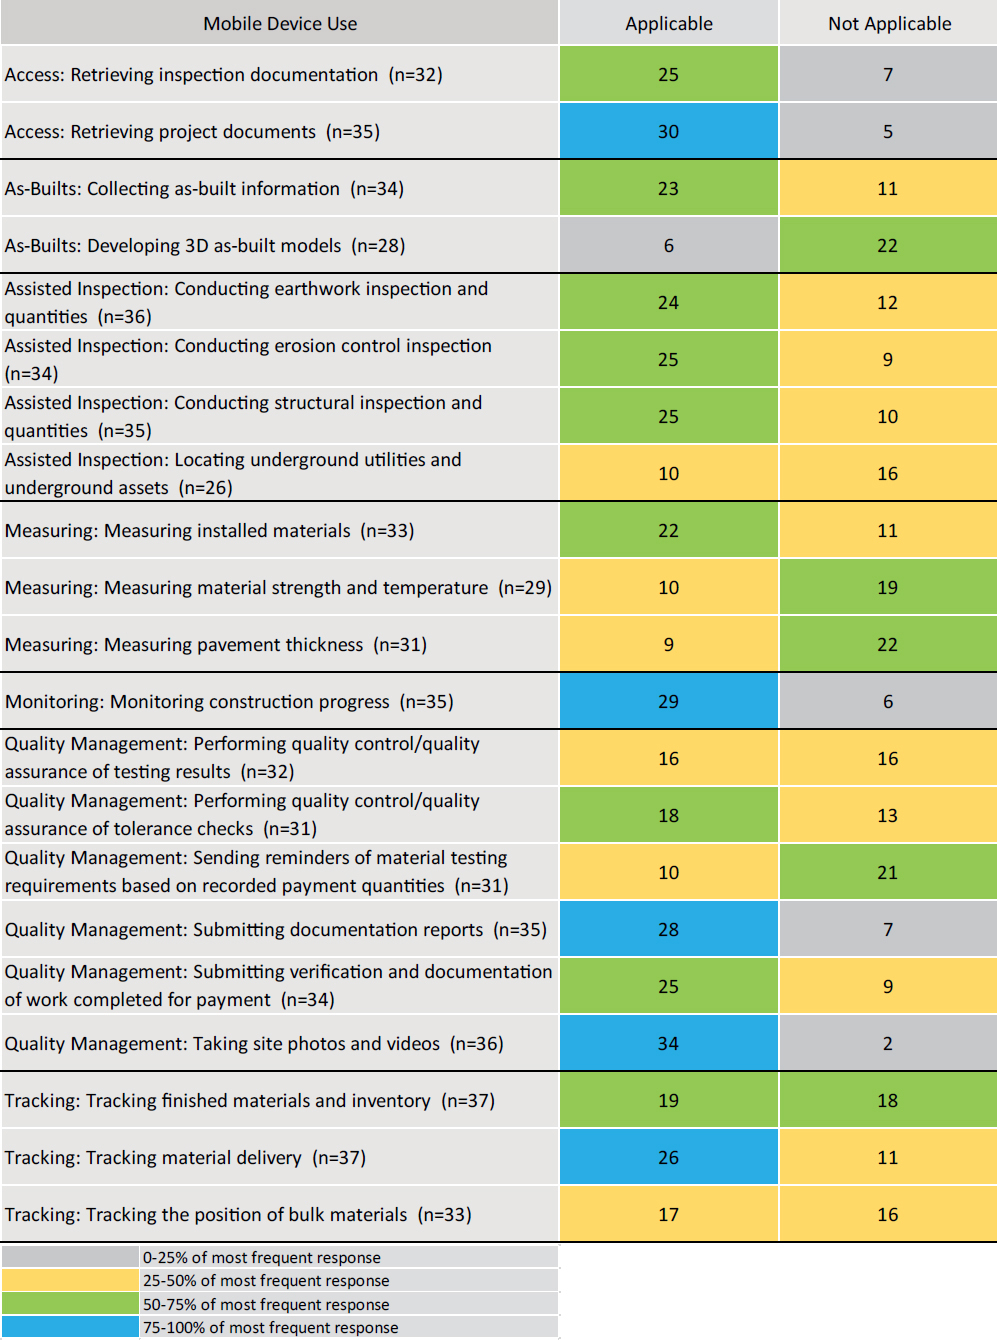
Table 3-1. Mobile application/software used for each of the following inspection functions.
| Inspection Function | Mobile Applications/Software |
|---|---|
| Access: Retrieving inspection documentation | AASHTOWare Project SiteManager, Adobe/Doc Express, Bluebeam Revu, Dynamic Resource Scheduler (DRS), ExeVision CMS/MMS, FALCON ERP Document Management System (DMS), Field Manager, HiCAMS, Masterworks Cloud Platform, OnStation, Oracle Primavera Unifier, PlanGrid, SharePoint®, SimpliGov |
| Access: Retrieving project documents | PlanGrid, Safari or Equivalent Browser, Bluebeam Revu, FALCON ERP Document Management System (DMS), ProjectWise Edge, Adobe Acrobat, Email, Mobile Inspector®, GIS, SimpliGov, SharePoint, Oracle Primavera Unifier, ExeVision |
| As-Builts: Collecting as-built information | ArcGIS Survey123, Bluebeam Revu, LEICA Geosystems, Oracle Primavera Unifier, PlanGrid, ProDMS, Redline Drawings, SharePoint, Trimble® Business Center (TBC), Trimble GPS |
| As-Builts: Developing 3D as-built models | AASHTOWare Project SiteManager, Email, Mobile Inspector, SYNCHRO Field, Trimble Survey |
| Assisted Inspection: Conducting earthwork inspection and quantities | AASHTOWare Project SiteManager, Bluebeam Revu, DroneDeploy, Google Forms, Masterworks Cloud Platform, Oracle Primavera Unifier, PlanGrid, ProDMS, SharePlus, Trimble Access, Unmanned Aerial Systems (UAS) |
| Assisted Inspection: Conducting erosion control inspection | AASHTOWare Project SiteManager, Bluebeam Revu, ExeVision, Highway Construction and Materials System (HiCAMS), Masterworks Cloud Platform, Mobile Inspector, Oracle Primavera Unifier, SharePlus |
| Assisted Inspection: Conducting structural inspection and quantities | LEICA Geosystems, Micro Survey, PointMan, GIS Data Collector, SharePlus, Trimble Access |
| Assisted Inspection: Locating underground utilities and underground assets | DroneDeploy, Field Genius, Masterworks Cloud Platform, Oracle Primavera Unifier, PlanGrid, SharePlus, Trimble Access |
| Measuring: Measuring installed materials | AASHTOWare Project SiteManager, Bluebeam Revu, HOBO Construction and Materials, LEICA Geosystems, Masterworks, Micro Survey Field Genius Premium Software for Windows, Trimble Business Center (TBC), Trimble GPS |
| Measuring: Measuring material strength and temperature | AASHTOWare Project SiteManager, Laboratory Information Management System (LIMS), Maturity Meter software (MMS), Masterworks |
| Measuring: Measuring pavement thickness | Trimble Business Center (TBC), Masterworks, ArcGIS Survey 123, MAGNET Field, Trimble Business Center (TBC) |
| Monitoring: Monitoring construction progress | AASHTOWare Project SiteManager, Adobe, CMS/MMS, Excel, ExeVision, Google Forms, HiCAMS, Laboratory Information Management System (LIMS), Masterworks Cloud Platform, SharePlus, Trimble Access |
| Quality Management: Performing quality control/quality assurance of tolerance checks | AASHTOWare Project SiteManager, Adobe, Computer Aided Maintenance Management System (CAMMS), Excel, ExeVision, Google Forms, Masterworks Cloud Platform, MS Word, SharePlus |
| Quality Management: Performing quality control/quality assurance of testing results | AASHTOWare Project SiteManager, Adobe, Custom NCDOT application, Excel, Google Forms, HiCAMS, Oracle Primavera Unifier, ProjectWise Edge |
| Quality Management: Sending reminders of material testing requirements based on recorded payment quantities | AASHTOWare Project SiteManager, Adobe, Computer Aided Maintenance Management System (CAMMS), CMS/MMS, Construction Safety Checklists (CEM0606), Mobile Inspector, Excel, ExeVision, FALCON ERP Document Management System (DMS), HiCAMS, Masterworks Cloud Platform, MS Word, Oracle Primavera Unifier PlanGrid Pro-DMS SimpliGov |
| Quality Management: Submitting documentation reports | , , , AASHTOWare Project SiteManager, Adobe, CMS/MMS, Daily Work Reports (DWR), Mobile Inspector, Excel, ExeVision, Field Manager, Google Forms, HeadLight, Fieldbook, HiCAMS, Masterworks, MS Word, Oracle Primavera Unifier, PlanGrid, ProDMS, SharePoint, SimpliGov, Trimble Access |
| Inspection Function | Mobile Applications/Software |
|---|---|
| Quality Management: Submitting verification and documentation of work completed for payment | AASHTOWare Project SiteManager, Adobe, Computer Aided Maintenance Management System (CAMMS), Daily Work Reports (DWR), Mobile Inspector, Excel, ExeVision CMS/MMS, Field Manager, Google Forms, HeadLight, Fieldbook, HiCAMS, Masterworks Cloud Platform, MS Word, Oracle Primavera Unifier, PlanGrid, ProDMS, SharePoint, SimpliGov, Trimble Access |
| Quality Management: Taking site photos and videos | Bluebeam Revu, Camera, Daily Work Reports (DWR), Google Forms, Masterworks Cloud Platform, Messaging, Mobile Inspector, Oracle Primavera Unifier, Pix4D, PlanGrid, SharePoint, Unmanned Aerial Systems (UAS) |
| Tracking: Tracking finished materials and inventory | Computer Aided Maintenance Management System (CAMMS), MS Word, ProjectWise Edge, MAGNET Field, Pix4D, ArcGIS Survey123, Trimble Survey, Excel, Mobile Inspector, Masterworks, Oracle Primavera Unifier |
| Tracking: Tracking material delivery | Haul Hub, Word, DOTslip, Mobile Inspector, Excel, NCDOT Custom Application, HaulHub, Adobe, E-Ticketing app, UDOT E-ticketing |
| Tracking: Tracking the position of bulk materials | Adobe, Asphalt Ticketing, DOTslip, E-ticketing, HaulHub, MS Word, Unmanned Aerial Systems (UAS) |
The survey offered respondents a list of capabilities and allowed for multiple selections. The heatmap shows that for most inspections, DOTs reported that “Wi-Fi Connectivity to other systems” and “Camera” are primarily used. “Online field data entry platform accessibility,” and “Offline field data entry platform accessibility” are also used more frequently; “Sound Recording” and “Handwriting recording and recognition” are rarely used.
3.1.3.5 Mobile Device Data Integration with Other Systems
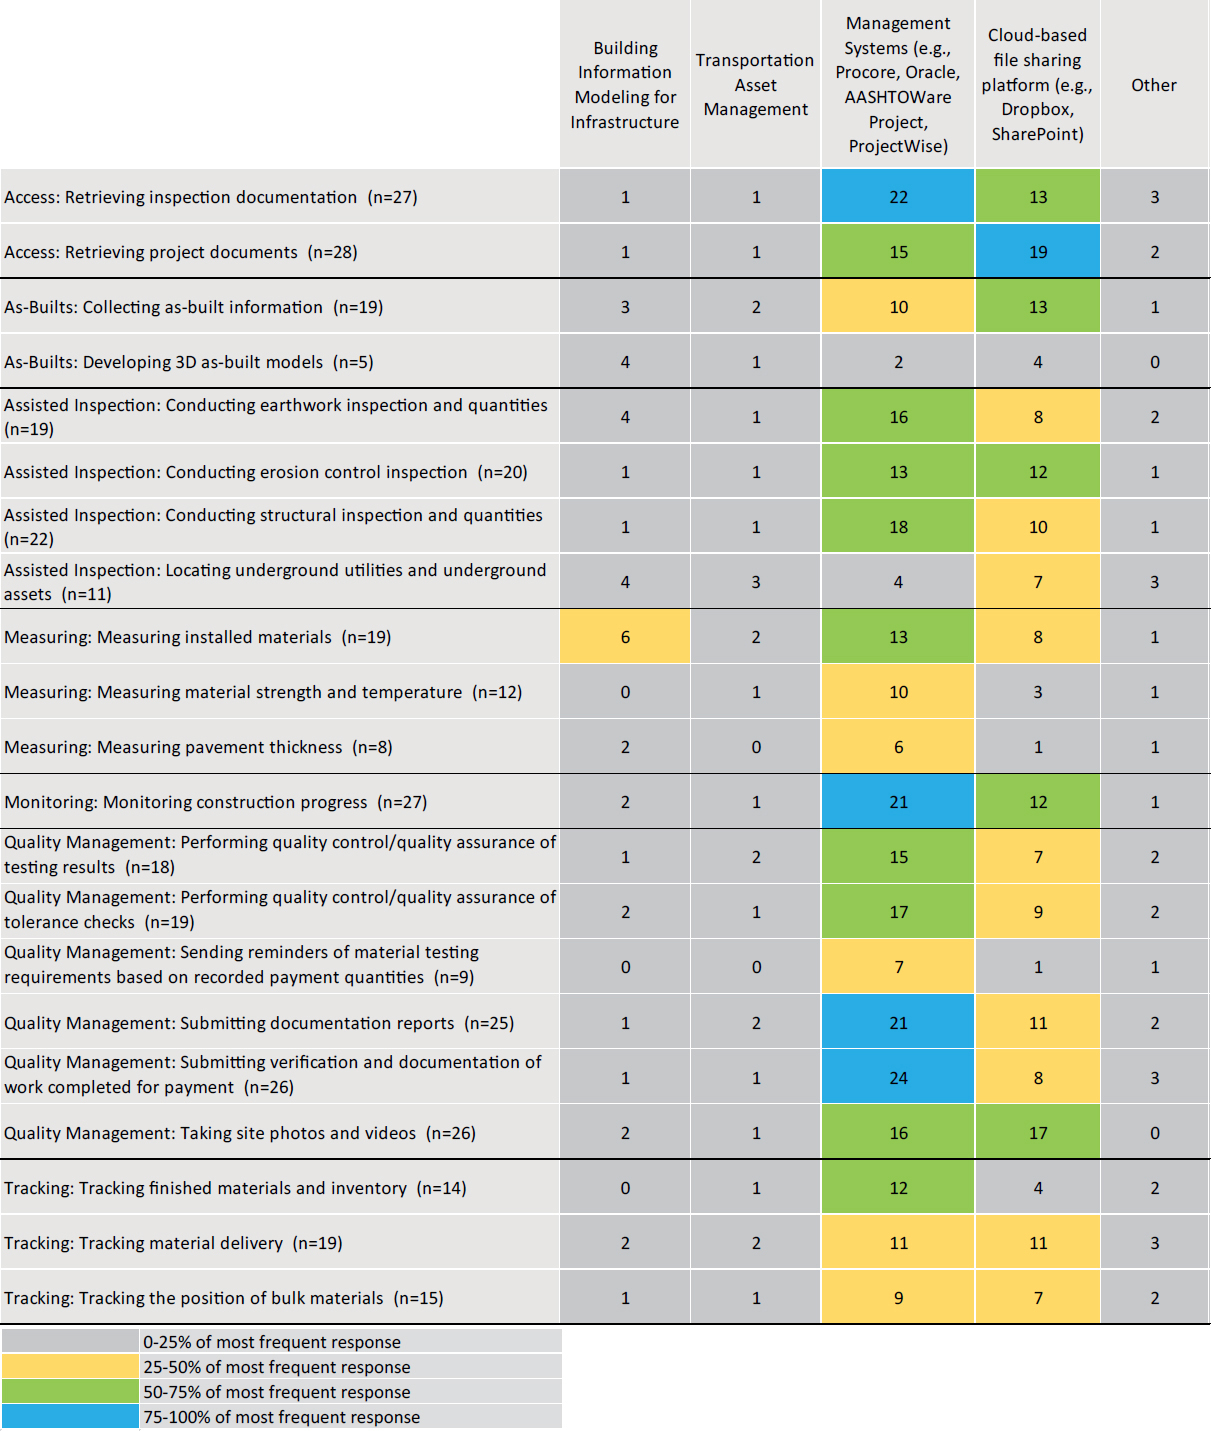
Respondents were asked to indicate, for each of the 21 inspection functions and their mobile applications, the systems with which they integrate (Question 11 of the survey questionnaire in Appendix A). The results are outlined in Figure 3-16, which features a heatmap of the systems with which mobile device data is integrated. The heatmap shows that for most cases, DOTs reported that they use “Management Systems (e.g., Procore, Oracle, AASHTOWare Project, ProjectWise)” to integrate their data. They also use a “Cloud-based file sharing platform (e.g., Dropbox, SharePoint).” State DOTs rarely use “Transportation Asset Management” or “Building Information Modeling for Infrastructure” for data integration. Some DOTs also selected “Other” and various software (i.e., Pix4D, GPS, Mobile Documentation, HaulHub, and Trimble® Business Center software) for data integration.
3.1.3.6 Mobile Device Technologies Integration
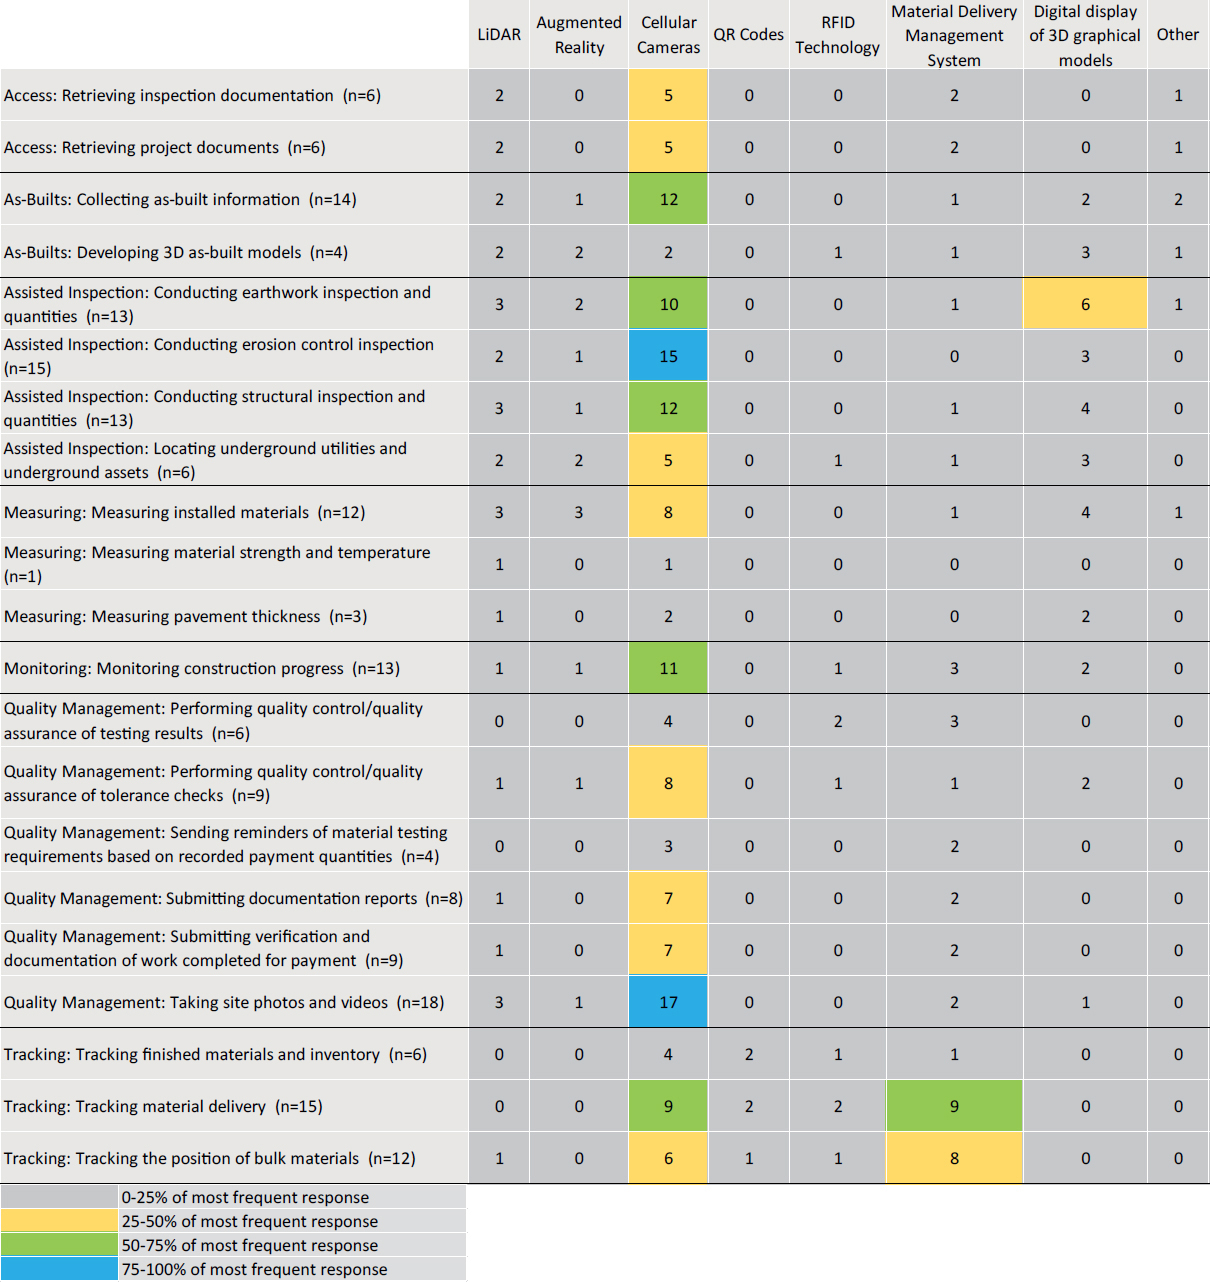
Respondents were asked to indicate, for each of the 21 inspection functions and their mobile applications, which technologies they utilize (Question 11 of the survey questionnaire in Appendix A). The results are outlined in Figure 3-17, which features a heatmap of the technologies with which mobile device data is utilized. The heatmap shows that for most cases, DOTs reported that they use “Cellular Cameras” to obtain their data. For most of the inspection functions, DOTs do not use any technology. Some DOTs also selected “Other” and mentioned “HiCAMS,” “PSPP software application to analyze sampled data,” “ArcGIS,” “macOS enterprise app,” and “OnBase for document management,” which they utilize for inspection functions.
3.1.3.7 Level of IT Support Needed
Respondents were asked to estimate, for each of the 21 inspection functions and their mobile applications, the level of IT support needed to use the application (Question 12 of the survey questionnaire in Appendix A). In the survey, “No-Code development” is defined as a technology enabling a non-technical user with no coding experience to build and use applications.
“Low-code development” is defined as a technology enabling people with no advanced computing or coding skills to develop custom-made applications and digital solutions to address specific operational needs. In Figure 3-18, the heatmap indicates that, for all 21 inspection functions, most of the respondents reported “No support needed, i.e., the mobile device application is no-code and the user can manage on their own”; the exception is “As-builts: developing 3D as-built models,” for which more respondents indicated that “Major IT support is needed, i.e., the application requires IT action before it can be used.” “Some IT support is needed, i.e., the application is low-code and requires limited IT action before it can be used” was less frequently selected than “No support needed.” Finally, a few responding DOTs reported “Major IT support is needed, i.e., the application requires IT action before it can be used” as the level of IT support they needed to use the mobile application.
3.1.4 Policies in Place
This section provides information on the policies DOTs have in place for the use of mobile devices (Questions 13 and 14 of the survey questionnaire in Appendix A). It covers the availability of policies/standard operating procedures developed for the use of personal or DOT-issued mobile devices and the existence of strategies developed for use of these mobile devices.
3.1.4.1 Mobile Device Policies and Standard Operating Procedures
Respondents were asked to indicate whether their agency has any policies/standard operating procedures developed for the use of personal or DOT-issued mobile devices (Question 13 of the survey questionnaire in Appendix A). As shown in Figure 3-19, 26% (or 10) of the 39 respondents reported that they are “Unsure” about the availability of policies/standard operating procedures developed for the use of personal or DOT-issued mobile devices; 64% (or 25) of the respondents said that their agency has mobile device policies/standard operating procedures; and the remaining 10% (or four) of the respondents indicated that their agency does not have any mobile device policies/standard operating procedures developed. Policies and standard operating procedures shared by the respondents are available in Appendix D.
3.1.4.2 Mobile Device Strategies
Respondents were asked to indicate whether their agency has any strategies (i.e., documentation on the “how,” “when,” “where,” “who,” and “what”) developed for use of personal or DOT-issued mobile devices (Question 14 of the survey questionnaire in Appendix A). As shown in Figure 3-20, 49% (or 19) of the 39 respondents reported that they are “Unsure” about the availability of mobile device strategies; 31% (or 12) of the respondents indicated that their agency has a mobile device strategy; and the remaining 21% (or eight) of the respondents said that their agency does not have any mobile device strategies. Strategies on the use of mobile devices shared by the respondents are available in Appendix D.
3.2 Mobile Device Data Storage
This section provides information on the storage of mobile device data (Questions 15 and 16 of the survey questionnaire in Appendix A). It covers the data storage methods, the systems with which data is integrated, and the methods in which data is integrated.
3.2.1 Mobile Device Data Storage Methods
Respondents were asked to indicate the data storage method for each of the 21 inspection functions (Question 15 of the survey questionnaire in Appendix A). The survey offered respondents options and allowed for multiple selections. The heatmap in Figure 3-21 shows that, for most

Figure 3-18. Breakdown of the level of IT support needed to use mobile applications (Q12).

of the inspection functions, most respondents reported that data is most frequently managed in a “DOT-managed local repository.” Infrequently, data for inspection functions is managed by “Third Party and Cloud tested solutions.” Finally, two DOTs mentioned “other” but did not elaborate.
3.2.2 Mobile Device Data Integration (“What”)
Respondents were asked to indicate the systems used to integrate mobile device data for each of the 21 inspection functions (Question 15 of the survey questionnaire in Appendix A). The survey offered respondents options and allowed for multiple selections. As shown in Figure 3-22, most respondents indicated that “Data Sent to a System of Official Records” and “Project Administration for Payment Purposes” are the two systems within which mobile device data is integrated. One respondent selected “Other” for “Collecting as-built information,” but no elaboration was provided.
3.2.3 Mobile Device Data Integration (“How”)
Respondents were asked to indicate how mobile data is integrated for each of the 21 inspection functions (Question 15 of the survey questionnaire in Appendix A). The survey offered respondents options and allowed for multiple selections. As shown in the heatmap in Figure 3-23,

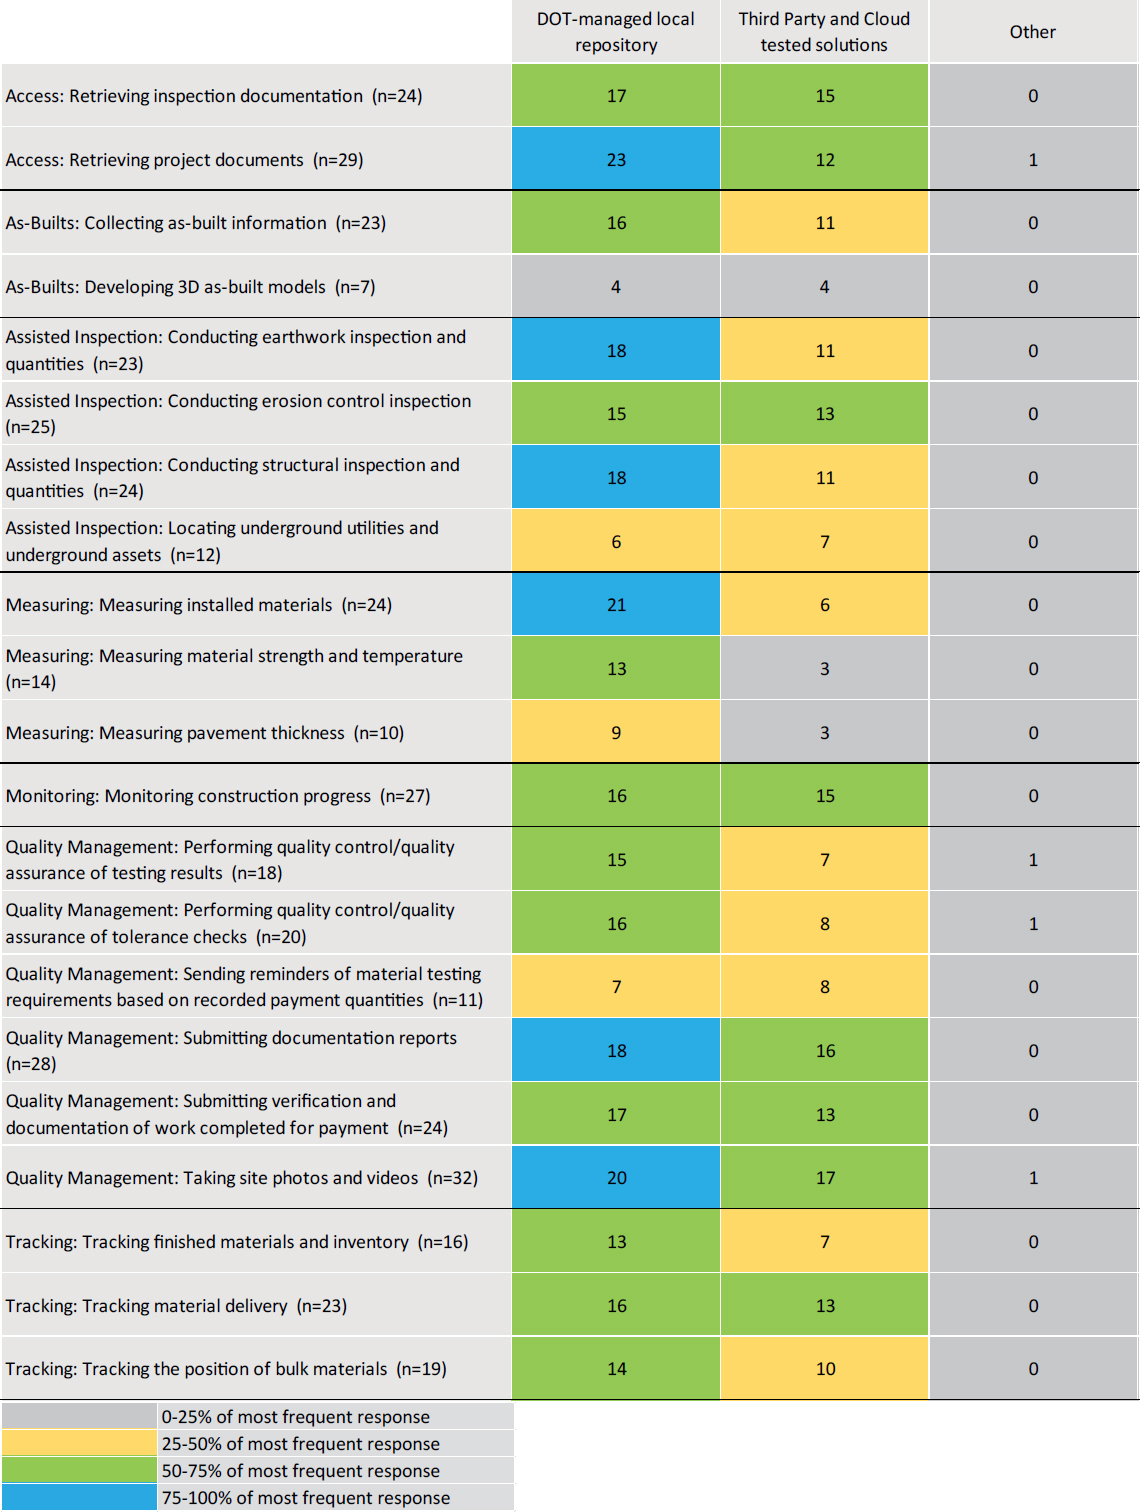
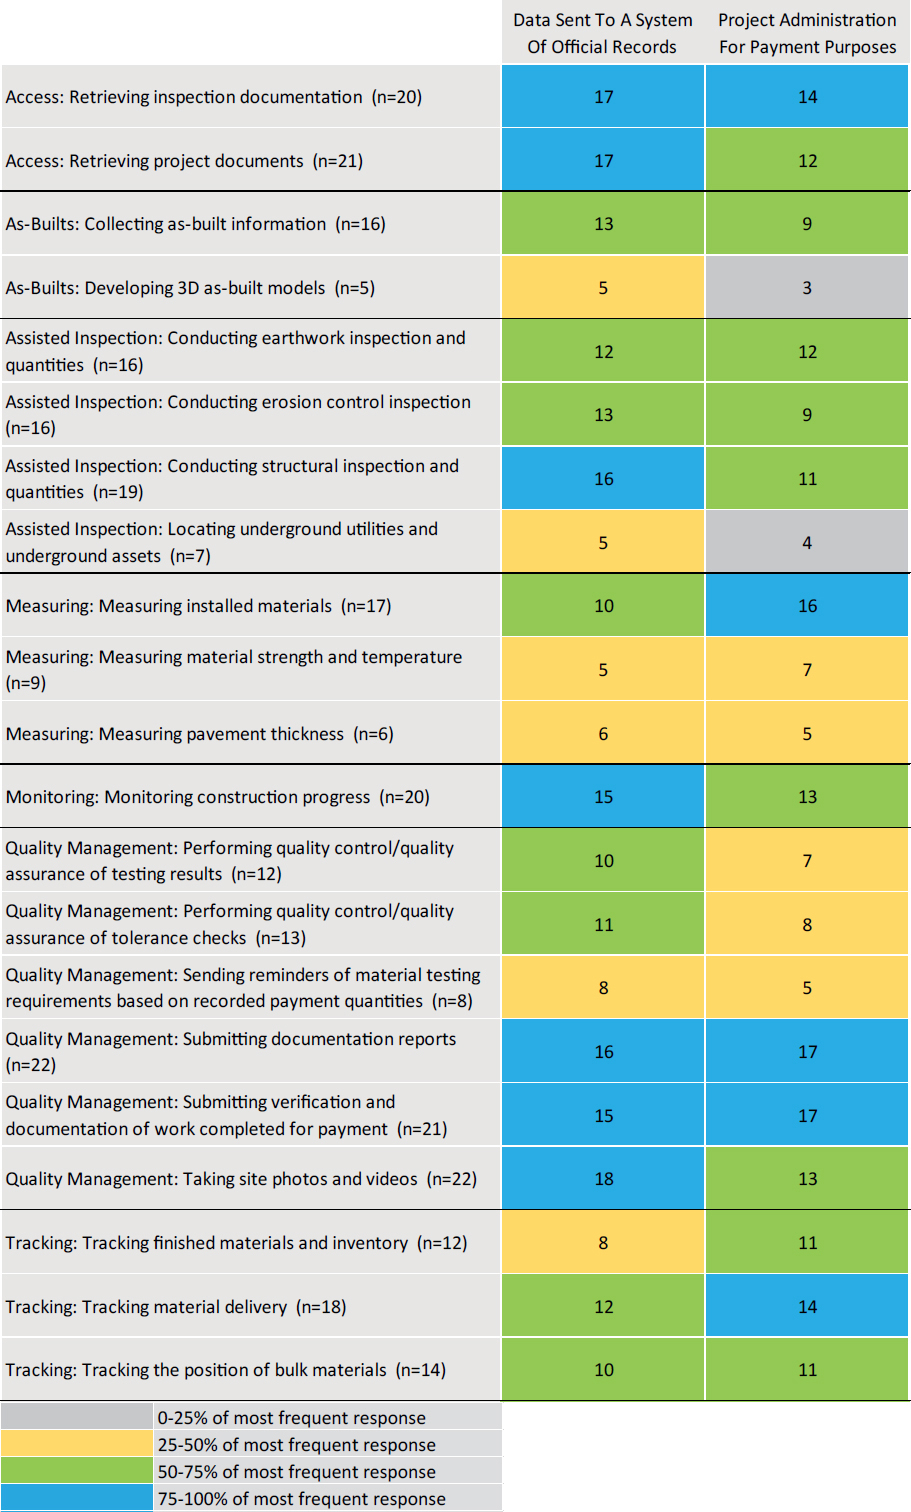

Figure 3-23. Breakdown of mobile device data integration (How) (Q15).
for 48% of (or 10) inspection functions, DOTs most frequently indicated that data is integrated using “handover through a cloud-based platform.” For 29% of (or six) inspection functions, DOTs most frequently indicated that data is integrated through “downloading from a server, i.e., manual extraction and integration.” Overall, the heatmap shows that data storage and integration methods vary across inspection functions and DOTs. “Other” was selected by several DOTs; they mentioned that “individual phones,” “Doc Express,” and “macOS Enterprise App” are used for mobile device data storage and integration for the inspection functions.
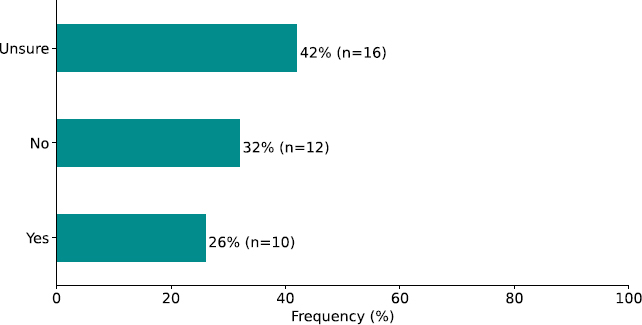
3.2.4 Mobile Device Data Retention Schedules
Respondents were asked to indicate whether their DOT has a retention schedule for mobile device data (Question 16 of the survey questionnaire in Appendix A). As shown in Figure 3-24, 42% (or 16) of the 38 respondents indicated that they are “Unsure” about the availability of a retention schedule for mobile device data; 26% (or 10) of the respondents selected “Yes,” indicating that their agency has a retention schedule for mobile device data; and the remaining 32% (or 12) of the respondents selected “No.” Documentation of retention schedules shared by the respondents is available in Appendix D.
3.3 Mobile Device Challenges and Implications
This section provides information about the challenges DOTs face when using mobile devices for inspection (Questions 17 and 18 of the survey questionnaire in Appendix A). It covers cost implications and the challenges associated with using mobile devices for inspection.
3.3.1 Mobile Device Cost Implications
Respondents were asked to indicate the cost implications of using mobile devices within their agency (Question 17 of the survey questionnaire in Appendix A). The survey offered respondents a list of cost implications and allowed for multiple selections. Most DOTs indicated the existence of multiple cost. As shown in Figure 3-25, the selections of 38 respondents were as follows:
- 92% (or 35) reported that “operational costs” was the most common cost implication.
- 82% (or 31) selected “capital replacement.”
- 79% (or 30) selected “software licenses.”
- 66% (or 25) reported “IT support costs,” and “costs of protective cases” as cost implications.
- 50% (or 19) indicated “cost of connectivity” as a cost implication.
- 37% (or 14) indicated “cost of training.”
- 34% (or 13) indicated “cost of portable chargers” is a cost implication for using mobile devices within their agency.
3.3.2 Mobile Device Challenges
Respondents were asked to indicate the challenges associated with using mobile devices for construction inspection within their agency (Question 18 of the survey questionnaire in Appendix A). The survey offered respondents a list of potential challenges and allowed for multiple selections. The following results are shown in Figure 3-26:
- 78% (or 29) of the respondents faced issues related to “Connectivity.”
- 57% (or 21) of the respondents faced issues related to “Financial (cost of mobile devices across the agency).”
- 49% (or 18) of the respondents faced issues related to “Integration.”
- 46% (or 17) of the respondents had concerns about “Security and Privacy (data security).”


- 38% (or 14) of the respondents reported “Security and Privacy (Mobile device users’ privacy concerns).”
- 35% (or 13) of the respondents reported “Buy-in challenges (resistance to change/technology).”
- 32% (or 12) of the respondents had “limited time to train inspectors on the use of mobile devices.”
- 27% (or 10) of the respondents had “limited resources available for reference on the use of mobile devices.”
- 24% (or 9) of the respondents had issues in “Setup (Frequent involvement of IT to help with the devices)” and “Maintenance (Concerns with maintaining mobile devices in good condition).”
- 22% (or 8) of the respondents had issues in “Safety (Concerns with mobile devices becoming a safety hazard on the jobsite).”
- 19% (or 7) of the respondents associated challenges with each of “Maintenance (Concerns with downloading and updating mobile applications),” “Safety (Concerns with distracted workers on the jobsite),” “Setup (Concerns with software bugs in mobile device applications),” and “Storage (Not enough storage on mobile devices to access needed files and applications).”
- 16% (or 6) of the respondents expressed challenges in “Setup (Time needed to set up mobile devices for use in the field).”


