Capturing the Durability of High Recycled Binder Ratio Asphalt Mixtures (2024)
Chapter: 2 Experiments
CHAPTER 2
Experiments
This chapter describes four laboratory experiments conducted to generate data for developing a comprehensive draft Standard Practice to guide the design and evaluation of durable asphalt mixtures. Three experiments focused on the primary durability issues of surface cracking, raveling, and moisture susceptibility. These experiments included performance test methods and conditioning protocols for evaluating specific component materials and proportions (material combinations), thereby aiding assessment of a wide range of mixture durability. A fourth experiment characterized the mechanistic properties of selected asphalt mixtures for evaluation of cracking performance through pavement modeling. In addition, experiments were completed to characterize component materials. This chapter also presents a draft durability assessment framework by climatic zone, with preliminary performance thresholds based on existing relationships with field performance. Finally, the chapter describes evaluation tools for analyzing experimental results, including statistical comparisons and performance modeling.
2.1 Component Materials and Characterization
The material selection and procurement process began by gathering 20 existing mix designs from five contractors in the North/Freeze and South/No Freeze climatic zones (Figure 2). From these, the 10 mix designs shown in Table 1 were selected to
- Represent actual mixtures produced in the field, with typical RBRs in many states and high RBRs as defined for this project (0.3–0.5 RBR, with RAS RBR limited to 0.25).
- Facilitate comparisons, considering that the same stockpiles are used for multiple mix designs with varying RBRs for the following four aggregate types and associated RAM sources:
- North Moisture Resistant (NR) with Northeast (NE) RAP and NE Tear-Off Asphalt Shingles (TOAS)
- North Moisture Susceptible (NS) with Midwest (MidW) RAP and MidW TOAS
- South Moisture Resistant (SR) with Southeast1 (SE1) RAP
- South Moisture Susceptible (SS) with Southeast2 (SE2) RAP
- Include mixtures with moisture-susceptible aggregate types for which an anti-stripping agent (ASA) was required in the mix designs. For the NS mixtures, a liquid anti-stripping (LAS) agent was required only for the RAP/RAS mix design. For the NR mixtures, a WMA additive with some anti-stripping properties was used but not noted on the mix design.
- Allow for the effect of RAP and RAS to be evaluated separately for the North/Freeze mixtures by including one low RAP mixture and two high RBR mixtures—one with RAS added to the low RAP mixture and the other with a high RAP RBR comparable to that of the RAP/RAS mixture.
As shown in Table 1, these mix designs were used in the four mixture experiments detailed subsequently with respect to aggregate and RAM materials and proportions in terms of optimum
Table 1. Mix designs.
| Region | Aggregate | RAM | RBR (RAP + RAS) | OAC (%) | EXPERIMENT | |||
|---|---|---|---|---|---|---|---|---|
| Cracking | Moisture | Raveling | Modeling | |||||
| North/Freeze | NR | NE RAP | 0.21 | 5.95 | X | X | X | X |
| NE RAP | 0.37 | 5.61 | X | X | X | X | ||
| NE RAP + NE TOAS | 0.22 + 0.22 = 0.44 | 5.85 | X | X | X | X | ||
| NS | MidW RAP | 0.20 | 5.20 | X | X | |||
| MidW RAP | 0.29 | 5.20 | X | X | ||||
| MidW RAP + MidW TOAS | 0.23 + 0.10 = 0.33 | 5.10 | X | |||||
| South/No Freeze | SR | SE1 RAP | 0.16 | 5.79 | X | X | X | X |
| SE1 RAP | 0.29 | 5.75 | X | X | X | X | ||
| SS | SE2 RAP | 0.22 | 5.15 | X | ||||
| SE2 RAP | 0.39 | 5.15 | X | |||||
NOTE: X = combination evaluated.
asphalt content (OAC). Different virgin binders, as shown in Table 2, were substituted into each mix design to evaluate the effects of control binders for each region and different high RAM strategies.
For the North/Freeze and South/No Freeze regions, the commonly used performance-grade virgin binders PG 58-28 and PG 64-22, respectively, were selected as the control. The selected binders have low ΔTc values close to zero or negative (and less than +0.5) to provide age-related cracking resistance. This ΔTc parameter (Tc,S – Tc,m) is defined as the difference between the continuous critical low-temperature PG (PGL) values for bending beam rheometer (BBR) stiffness (related to induced thermal stresses in an asphalt pavement caused by restrained shrinkage) and m-value (related to the ability of an asphalt pavement to relieve these stresses). Thus, the selected binders are more S-controlled and are therefore good candidates for use in high RBR mixtures based on preliminary thresholds and field performance (Anderson et al. 2011; Reinke 2017; Asphalt Institute 2019).
Table 2. Virgin binders.
| Region | Binder | Classification |
|---|---|---|
| North/Freeze | PG 58-28 Low ΔTc = +0.4 | Control |
| PG 58-28 High ΔTc = +2.0 | Higher ΔTc | |
| PG 52-34 ΔTc = +2.5 | Softer | |
| PG 70-28 ΔTc = −0.6 | PMA | |
| South/No Freeze | PG 64-22 Low ΔTc = −1.4 | Control |
| PG 64-22 High ΔTc = +1.3 | Higher ΔTc | |
| PG 58-28 High ΔTc = +2.0 | Softer | |
| PG 76-22 ΔTc = −1.0 | PMA |
Alternate binders of the same PG, but with ΔTc values greater than the control by 1.6 for the North/Freeze region and 2.7 for the South/No Freeze region, were chosen as a high RAM strategy after a search of 17 suppliers. Additionally, softer and PMA virgin binders, with ΔTc values greater than or equal to +2.0 for unmodified and greater than or equal to –1.0 for modified, were selected as high RAM strategies on the basis of available materials. Additives were also selected for use as a high RAM mitigation strategy (e.g., a single bio-based RA) or a moisture damage strategy (i.e., a single LAS agent and lime).
The characterization of component materials focused on the virgin and extracted or recovered RAM binders, as shown in Table 3. The virgin binders were those employed in the mixture experiments and tied to the climatic zones, virgin binder recycling capacity (i.e., high or low ΔTc), and high RAM strategies (i.e., PMA and softer virgin binder). The RAP binders also corresponded to the sources tied to North/Freeze and South/No Freeze climatic zones.
The tests conducted included the conventional Superpave PG rheological parameters and corresponding aging conditions. Specifically, these were high-temperature PG (PGH) for unaged and rolling thin film oven–aged (RTFO–aged) binders, intermediate-temperature PG (PGI) for PAV20-aged binders, and PGL and ΔTc for PAV20-aged binders tested in the dynamic shear rheometer (DSR) and the BBR. Other rheological tests performed include DSR at multiple aging levels (unaged, RTFO, PAV20, and PAV40) to obtain the Glover-Rowe (G-R) parameter and multiple stress creep and recovery (MSCR) to obtain values for nonrecoverable creep compliance and recovery (Jnr and %R). This suite of tests provided a comprehensive rheological characterization of the virgin and RAP binders. It facilitated the exploration of any relationships between
Table 3. Virgin and RAM binder characterization.
| Region | Binder | Classification | PGH by DSR Unaged, RTFO, PAV20 | PGL, ΔTc by BBR PAV20 | G-R by DSR Unaged, RTFO, PAV20, PAV40 | Jnr, %R by MSCR RTFO |
|---|---|---|---|---|---|---|
| North/Freeze | PG 58 -28 Low ΔTc = +0.4 | Control | X | X | X | X |
| PG 58 -28 High ΔTc = +2.0 | Higher ΔTc | X | X | X | X | |
| PG 52-34 ΔTc = +2.5 | Softer | X | X | X | X | |
| PG 70 -28 ΔTc = −0.6 | PMA | X | X | X | X | |
| NE RAP | RAP | X | X | X | X | |
| NE TOAS | RAS | X | X | X | X | |
| MidW RAP | RAP | X | X | X | X | |
| MidW TOAS | RAS | X | X | X | X | |
| South/No Freeze | PG 64 -22 Low ΔTc = −1.4 | Control | X | X | X | X |
| PG 64 -22 High ΔTc = +1.3 | Higher ΔTc | X | X | X | X | |
| PG 58 -28 High ΔTc = +2.0 | Softer | X | X | X | X | |
| PG 76 -22 ΔTc = −1.0 | PMA | X | X | X | X | |
| SE1 RAP | RAP | X | X | X | X | |
| SE2 RAP | RAP | X | X | X | X |
NOTE: X = combination evaluated.
Table 4. RAM characterization.
| RAM | DoA @ 140°C, 170°C | DWT @ 116°C, 149°C, 171°C | Binder Content | Gradation |
|---|---|---|---|---|
| NE RAP | X | X | X | X |
| NE TOAS | X | |||
| MidW RAP | X | X | X | X |
| MidW TOAS | X | |||
| SE1 RAP | X | X | X | X |
| SE2 RAP | X | X | X | X |
NOTE: X = combination evaluated.
their properties and mixture durability, with the goal of verifying the NCHRP Project 09-58 draft Standard Practice proposed thresholds for these materials (Epps Martin et al. 2019).
Binder blends were not characterized because this type of analysis requires extraction and recovery of the binder blend from the mixture or extraction and recovery of the RAM binder to artificially and completely blend virgin and recycled binders in the laboratory. This process likely does not represent the binder blend in the corresponding mixture. In both cases, this type of comprehensive analysis would not be recommended as part of a set of routine mix design tools. However, the characterization of RAP binders on a routine basis is suggested to characterize their variability and optimize their use, particularly with high RBRs.
Because the focus of this project was on high RBR mixture durability and the effects of traffic and environmental conditions, binder durability with aging and the interruption of the bond between binder and aggregate by moisture were of primary concern. However, aggregate properties related to durability, including RAP characterization as shown in Table 4, were also captured and related to mixture durability. In addition to determining RAP binder content and gradation following ignition oven testing, two methods of evaluating RAP binder activation were used: degree of activation (DoA) and the Dongre workability test (DWT). These methods were compared in a recent study (Epps Martin, Abdelaziz, and Arámbula Mercado 2021).
For the four types of aggregate (NR, SR, NS, and SS), available durability properties were gathered from online databases or SHAs.
2.2 Proportions (Mix Design Verification, Additive Doses, and RBA)
The existing mix designs shown in Table 1 were verified with respect to measured aggregate and RAM gradations and binder content to account for differences in materials between mix design and sampling for this project. Based on the verification results, RBRs, OAC, and VMA values were recalculated and checked against requirements for the corresponding SHA.
An LAS agent dose of 0.5% by weight of total binder was recommended by the supplier for specific mixtures in the laboratory experiments. Recycling agent doses by weight of total binder for other specific mixtures were determined according to the following hybrid dose selection method developed during this project:
- Increase dose such that PGL = target PGL−3 and verify PGH < target PGH+5.9
- If PGH > target PGH+6.0, increase the dose further such that PGL = target PGL−5.9 and verify PGH < target PGH+5.9
- If PGH still > target PGH+6.0, increase the dose even further such that PGH = target PGH+5.9
The RA doses were determined based on measured virgin and RAP binder properties and their respective verified contents in the selected mix designs. The target binder blend PG was PG 58-28 for North/Freeze aggregates and NE and MidW RAM sources, while it was PG 64-22 for South/No Freeze aggregates and Southeast RAM sources.
For application of another high RAM strategy for specific mixtures in the laboratory experiments, decreased RBA values for RAP and RAS were selected. For RAP, decreased RBA was determined based on the estimated RAP binder availability factor (BAF) equation at 150°C from the draft Standard Practice (Epps Martin et al. 2019) using the PGH values of the RAP binders. For RAS, a decreased RBA of 75% was chosen based on the median and mode of the values seven states use according to a survey conducted for Texas Department of Transportation (TxDOT) Project 0-7062. Based on the decreased RBA values for RAP and RAS, the virgin binder content can be adjusted following the corrected optimum asphalt content (COAC) approach implemented by the Georgia Department of Transportation. As an example, for a decreased RBA of 75%, only 75% of the asphalt binder in the RAM is credited to the total asphalt binder in the mixture, and additional virgin binder in the amount of 25% of the RAM binder is added to the verified OAC.
2.3 Mixture Performance Evaluation
The laboratory tests and conditioning protocols selected in Phase I were used to evaluate asphalt mixtures with a range of expected durability in the three interrelated laboratory experiments discussed in this section. In each experiment, the effects of these relevant factors were explored:
- Aggregate type
- RAM type and source
- Virgin binder type
- RBR
- High RAM strategies (e.g., changing the virgin binder, adding an RA, decreasing RBA, or using a hybrid combination)
- Moisture damage strategies (e.g., adding an anti-stripping agent such as LAS or lime)
- Conditioning
- Aging
- Moisture
In addition, the following aging and moisture conditioning protocols were selected to be representative of the four climatic zones (Figure 2):
- Wet-Freeze (Northeast, Midwest): Shorter mid-term critical aging, moisture conditioning with freeze/thaw (F/T)
- Dry-Freeze (Northern Plains, Intermountain West): Shorter mid-term critical aging, moisture conditioning with F/T
- Wet–No Freeze (Southeast, Pacific Northwest): Longer mid-term critical aging, moisture conditioning without F/T
- Dry–No Freeze (Southwest): Longer mid-term critical aging, no moisture conditioning (dry)
For each material combination (aggregate and associated RAM sources), the stepwise approach shown in Figure 4 was followed to design durable high RBR mixtures through the application of potential strategies (as needed) to mitigate embrittlement and moisture susceptibility. As a starting point, typical RBR control mixtures and high RBR mixtures were prepared based on verified mix designs without strategies and evaluated for intermediate-temperature cracking. This distress was addressed first given its importance for high RBR mixtures. Next, application of the stepwise approach proceeded to balance the mixture by ensuring rutting resistance, followed by an assessment of moisture susceptibility, and then raveling resistance. The final step focused on
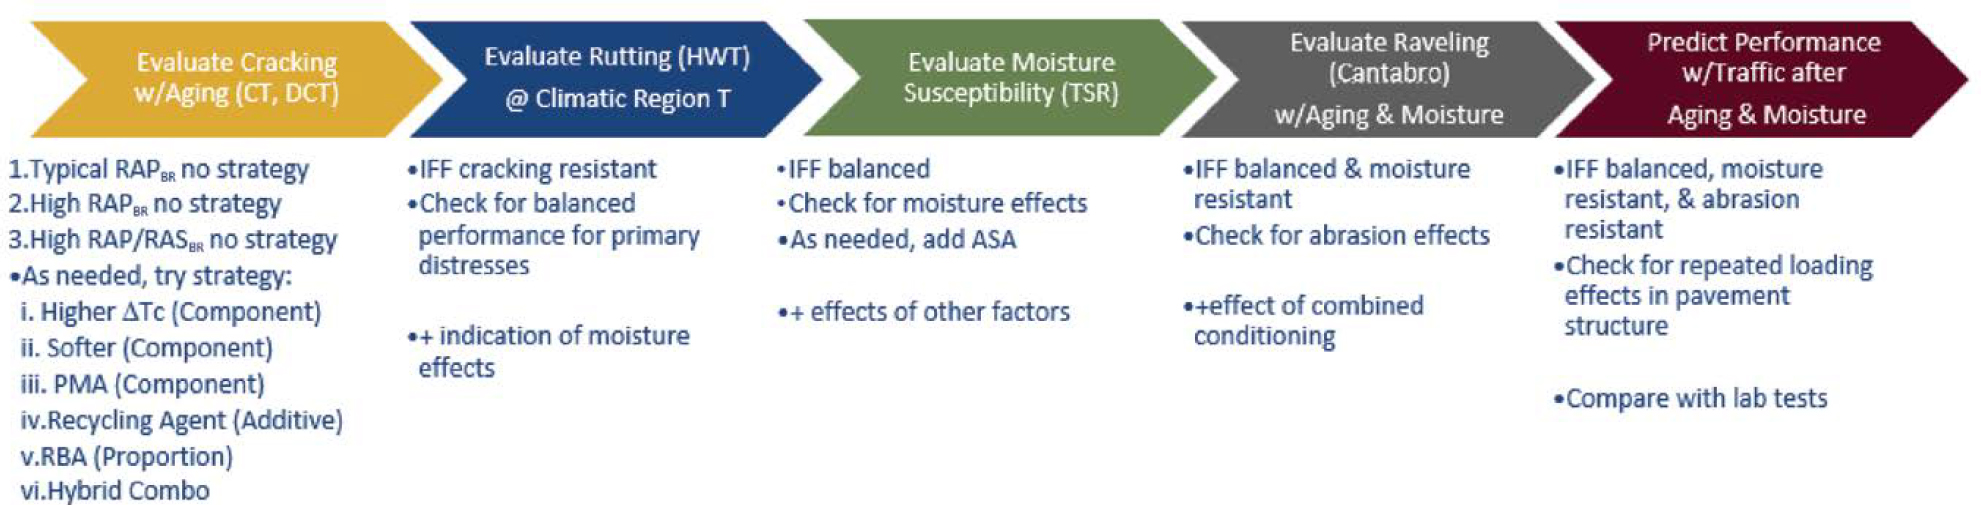
Figure 4. Stepwise approach for designing durable high RBR mixtures.
predicting cracking performance of a pavement surface layer under repeated traffic loads after aging and moisture conditioning.
This comprehensive approach was used to evaluate high RAM strategies to achieve balanced performance with respect to rutting and the primary durability issues of surface cracking, moisture susceptibility, and raveling considered in this project. Mixtures were considered robust if they achieved this balanced performance with respect to all four of these distresses. Within each step in the comprehensive evaluation approach, different high RAM or moisture strategies, such as the use of different virgin binders or additives, were employed until the mixture met preliminary performance thresholds and could advance to the next step. This allowed for prioritization of the critical forms of distress and application of suitable strategies to achieve a durable mixture for each distress type before evaluation of the other distress types. Some factor-level combinations were not considered based on engineering judgment and economics (e.g., those involving a high RA dose). Despite constraints of time and budget, the laboratory experiments were planned to test the mixtures with as many mitigation strategies as possible to meet the goals of the project.
2.3.1 Mixture Surface Cracking Resistance
In the experiment to assess mixture surface cracking resistance outlined in Table 5, two tests were conducted: the indirect tensile asphalt cracking test (IDEAL-CT) and disk-shaped compact tension (DCT). For IDEAL-CT, at least four replicate results were obtained, whereas six replicate results were measured for DCT. The purpose was to investigate the effects of various factors and their respective levels under different environmental conditions, specifically aging and moisture, tied to the climatic zones shown in Figure 2. The factors and associated levels under evaluation were
- Aggregate type (three levels): NR, SR, and NS
- RAM type and source (four levels): Northeast RAP, Northeast TOAS, Southeast1 RAP, and Midwest RAP
- Virgin binder type (seven levels): PG 58-28 Low ΔTc, PG 58-28 High ΔTc, PG 52-34, PG 70-28, PG 64-22 Low ΔTc, PG 64-22 High ΔTc, and PG 76-22
- RBR (two levels): typical, high (>0.30)
- High RAM strategies (eight levels): none (control), higher ΔTc, softer binder, PMA, RA, and decreased RBA alone and as a hybrid strategy with softer binder or PMA
- Aging (two levels): shorter mid-term critical (6 h at 135°C), longer mid-term critical (8 h at 135°C) with PMA mixtures aged 3 days at 95°C
A harder virgin binder than the control in terms of larger PGH and larger PGL was also evaluated.
Within this experimental design, component materials containing asphalt binder were nested according to the climatic zone. Thus, both RAM sources and virgin binder types (including three of the high RAM strategies) were tied to those materials commonly used in either the North/Freeze or South/No Freeze climatic zone. In addition, aging protocols were also tied to climatic zone with shorter mid-term critical aging for North/Freeze mixtures and longer mid-term critical aging for South/No Freeze mixtures. These mid-term critical aging protocols represent 4–6 years of field aging, according to recent studies (Chen et al. 2018; Chen et al. 2020).
Note that DCT tests were not conducted for South/No Freeze mixtures, and additional IDEAL-CT tests were conducted for the performance modeling experiment for select mixtures with combined aging and moisture conditioning.
2.3.2 Mixture Moisture Susceptibility
In the experiment to assess mixture moisture susceptibility outlined in Table 6, two tests were conducted: Hamburg wheel-tracking (HWT) and indirect tensile (IDT) strength for tensile
Table 5. Mixture surface cracking resistance experiment.
| Aggregate | RAM Source | RBR | Virgin Binder Type | High RAM Strategies | Aging | IDEAL-CT | DCT |
|---|---|---|---|---|---|---|---|
| North Resistant | NE RAP | 0.21 | PG 58-28 Low ΔTc = +0.4 | None (Control) | Shorter Mid-term | X | X for successful strategies |
| PG 58-28 High ΔTc = +2.0 | Higher ΔTc | Shorter Mid-term | X | ||||
| PG 64-22 Low ΔTc = −1.4 | Harder | Shorter Mid-term | X | ||||
| 0.37 | PG 58-28 Low ΔTc = +0.4 | None (Control) | Shorter Mid-term | X | |||
| PG 58-28 High ΔTc = +2.0 | Higher ΔTc | Shorter Mid-term | X | ||||
| PG 52-34 ΔTc = +2.5 | Softer | Shorter Mid-term | X | ||||
| PG 58-28 Low ΔTc = +0.4 | Recycling Agent @ 4.8% | Shorter Mid-term | X | ||||
| PG 58-28 Low ΔTc = +0.4 | Decreased RBA | Shorter Mid-term | X | ||||
| PG 52-34 ΔTc = +2.5 | Softer + Decreased RBA | Shorter Mid-term | X | ||||
| PG 70-28 ΔTc = −0.6 | PMA + Decreased RBA | Shorter Mid-term @ 95°C | X | ||||
| NE RAP+ NE TOAS | 0.44 | PG 58-28 Low ΔTc = +0.4 | None (Control) | Shorter Mid-term | X | ||
| PG 52-34 ΔTc = +2.5 | Softer | Shorter Mid-term | X | ||||
| PG 58-28 Low ΔTc = +0.4 | Decreased RBA | Shorter Mid-term | X | ||||
| South Resistant | SE1 RAP | 0.16 | PG 64-22 Low ΔTc = −1.4 | None (Control) | Longer Mid-term | X | X for successful strategies |
| PG 64-22 High ΔTc = +1.3 | Higher ΔTc | Longer Mid-term | X | ||||
| PG 58-28 High ΔTc = +2.0 | Softer | Longer Mid-term | X | ||||
| PG 76-22 ΔTc = −1.0 | PMA | Longer Mid-term @ 95°C | X | ||||
| PG 64-22 Low ΔTc = −1.4 | Recycling Agent @ 3.7% | Longer Mid-term | X | ||||
| PG 58-28 High ΔTc = +2.0 | Softer + Decreased RBA | Longer Mid-term | X | ||||
| 0.29 | PG 64-22 Low ΔTc = −1.4 | None (Control) | Longer Mid-term | X | |||
| PG 64-22 High ΔTc = +1.3 | Higher ΔTc | Longer Mid-term | X | ||||
| PG 58-28 High ΔTc = +2.0 | Softer | Longer Mid-term | X | ||||
| PG 76-22 ΔTc = −1.0 | PMA | Longer Mid-term @ 95°C | X | ||||
| PG 64-22 Low ΔTc = −1.4 | Recycling Agent @ 7.0% | Longer Mid-term | X | ||||
| PG 64-22 Low ΔTc = −1.4 | Decreased RBA | Longer Mid-term | X | ||||
| North Susceptible | MidW RAP | 0.20 | PG 58-28 Low ΔTc = +0.4 | None (Control) | Shorter Mid-term | X | X for successful strategies |
| 0.29 | PG 58-28 Low ΔTc = +0.4 | None (Control) | Shorter Mid-term | X | |||
| PG 58-28 Low ΔTc = +0.4 | Recycling Agent @ 2.8% | Shorter Mid-term | X | ||||
| PG 58-28 Low ΔTc = +0.4 | Decreased RBA | Shorter Mid-term | X |
NOTE: X = combination evaluated.
Table 6. Mixture moisture susceptibility experiment.
| Aggregate | RAM Source | RBR | Virgin Binder Type | High RAM Strategies | Moisture Damage Strategies | Moisture Conditioning | IDT (TSR) | HWT |
|---|---|---|---|---|---|---|---|---|
| North Resistant | NE RAP | 0.21 | PG 58-28 Low ΔTc = +0.4 | None (Control) | None | TSR with F/T | X | X |
| LAS | TSR with F/T | X | X | |||||
| 0.37 | PG 58-28 Low ΔTc = +0.4 | None (Control) | None | TSR with F/T | X | X | ||
| LAS | TSR with F/T | X | X | |||||
| PG 58-28 Low ΔTc = +0.4 | Recycling Agent @ 4.8% | None | TSR with F/T | X | X | |||
| LAS | TSR with F/T | X | X | |||||
| NE RAP+ NE TOAS | 0.44 | PG 58-28 Low ΔTc = +0.4 | None (Control) | None | TSR with F/T | X | X | |
| LAS | TSR with F/T | X | X | |||||
| PG 58-28 Low ΔTc = +0.4 | Decreased RBA | None | TSR with F/T | X | X | |||
| LAS | TSR with F/T | X | X | |||||
| South Resistant | SE1 RAP | 0.16 | PG 64-22 Low ΔTc = −1.4 | None (Control) | None | TSR without F/T | X | X |
| LAS | TSR without F/T | X | X | |||||
| PG 58-28 High ΔTc = +2.0 | Softer + Decreased RBA | None | TSR without F/T | X | X | |||
| LAS | TSR without F/T | X | X | |||||
| 0.29 | PG 64-22 Low ΔTc = −1.4 | None (Control) | None | TSR without F/T | X | X | ||
| LAS | TSR without F/T | X | X | |||||
| PG 64-22 Low ΔTc = −1.4 | Recycling Agent @ 7.0% | None | TSR without F/T | X | X | |||
| LAS | TSR without F/T | X | X | |||||
| North Susceptible | MidW RAP | 0.20 | PG 58-28 Low ΔTc = +0.4 | None (Control) | None | TSR with F/T | X | X |
| LAS | TSR with F/T | X | X | |||||
| 0.29 | PG 58-28 Low ΔTc = +0.4 | None (Control) | None | TSR with F/T | X | X | ||
| LAS | TSR with F/T | X | X | |||||
| PG 58-28 Low ΔTc = +0.4 | Decreased RBA | None | TSR with F/T | X | X | |||
| LAS | TSR with F/T | X | X | |||||
| MidW RAP+ MidW TOAS | 0.33 | PG 58-28 Low ΔTc = +0.4 | None (Control) | None | TSR with F/T | X | X | |
| LAS | TSR with F/T | X | X | |||||
| South Susceptible (SS) | SE2 RAP | 0.22 | PG 64-22 Low ΔTc = −1.4 | None (Control) | None | TSR without F/T | X | X |
| Lime | TSR without F/T | X | X | |||||
| 0.39 | PG 64-22 Low ΔTc = −1.4 | None (Control) | None | TSR without F/T | X | X | ||
| Lime | TSR without F/T | X | X | |||||
| PG 64-22 Low ΔTc = −1.4 | Recycling Agent @ 4.9% | Lime | TSR without F/T | X | X |
NOTE: X = combination evaluated.
strength ratio (TSR). For HWT, two replicate results were obtained based on testing two sets of two trimmed cylindrical specimens each. For TSR, one result was obtained based on three dry strength (ST) and three wet strength (ST) measurements. The purpose was to investigate the effects of various factors and their respective levels under different environmental conditions, specifically aging and moisture, tied to the climatic zones shown in Figure 2. The factors and associated levels under evaluation included the following:
- Aggregate type (four levels): NR, SR, NS, and SS
- RAM type and source (six levels): Northeast RAP, Northeast TOAS, Southeast1 RAP, Midwest RAP, Midwest TOAS, and Southeast2 RAP
- RBR (two levels): typical, high (>0.30)
- Virgin binder type (three levels): PG 58-28 Low ΔTc, PG 64-22 Low ΔTc, PG 58-28 High ΔTc
- High RAM strategies (four levels): none (control), RA, and decreased RBA alone and as a hybrid strategy with softer binder
- Moisture damage strategies (two levels): none, anti-stripping agent (LAS or lime)
- Moisture conditioning (two levels): with F/T, without F/T
- Aging (one level): short-term oven aging (STOA) (4 h at 135°C)
2.3.3 Mixture Raveling Resistance
In the experiment to assess mixture raveling resistance outlined in Table 7, two tests were conducted: Cantabro and dynamic modulus (|E*|) for G-R mixture (G-Rm). For Cantabro, three replicate results were obtained after STOA, and one result was determined as a ratio based on three measurements after STOA and three after combination conditioning. For G-Rm, a single result was obtained from the |E*| master curve. The purpose was to investigate the effects of various factors and their respective levels under different environmental conditions, specifically aging and moisture, tied to the climatic zones shown in Figure 2. The following factors and associated levels were evaluated:
- Aggregate type (two levels): NR, SR
- RAM type and source (three levels): Northeast RAP, Northeast TOAS, Southeast1 RAP
- RBR (two levels): typical, high (>0.30)
- Virgin binder type (four levels): PG 58-28 Low ΔTc, PG 70-28, PG 64-22 Low ΔTc, PG 58-28 High ΔTc
- High RAM strategies (five levels): none (control), RA, and decreased RBA alone and as a hybrid strategy with softer binder or PMA
- Moisture damage strategies (two levels): none, LAS
- Conditioning (three levels): none, Freeze combination (shorter mid-term aging [6 h at 135°C] with PMA mixtures aged 3 days at 95°C and moisture conditioning with F/T), No Freeze combination (longer mid-term aging [8 h at 135°C] and moisture conditioning without F/T)
As for the cracking experiment, component materials containing asphalt binder were nested according to the climatic zone. Thus, RAM sources and virgin binder types (including those in two of the high RAM strategies) were tied to those materials commonly used in either the North/Freeze or South/No Freeze climatic zone. In addition, the combined conditioning protocols were also tied to climatic zones with shorter mid-term critical aging and moisture conditioning, with F/T used for North/Freeze mixtures and longer mid-term critical aging and moisture conditioning without F/T used for South/No Freeze mixtures. In addition to direct testing of raveling
Table 7. Mixture raveling resistance experiment.
| Aggregate | RAM Source | RBR | Virgin Binder Type | High RAM Strategies | Moisture Damage Strategies | Conditioning | Cantabro | G-Rm |
|---|---|---|---|---|---|---|---|---|
| North Resistant | NE RAP | 0.21 | PG 58-28 Low ΔTc = +0.4 | None (Control) | LAS | None | X | |
| Freeze Combo | X | X | ||||||
| 0.37 | PG 58-28 Low ΔTc = +0.4 | Recycling Agent @ 4.8% | None | None | X | |||
| Freeze Combo | X | X | ||||||
| PG 70-28 ΔTc = −0.6 | PMA + Decreased RBA | None | None | X | ||||
| Freeze Combo | X | X | ||||||
| NE RAP+ NE TOAS | 0.44 | PG 58-28 Low ΔTc = +0.4 | Decreased RBA | None | None | X | ||
| Freeze Combo | X | X | ||||||
| South Resistant | SE1 RAP | 0.16 | PG 58-28 High ΔTc = +2.0 | Softer + Decreased RBA | None | None | X | |
| No Freeze Combo | X | X | ||||||
| 0.29 | PG 64-22 Low ΔTc = −1.4 | Recycling Agent @ 7.0% | None | None | X | |||
| No Freeze Combo | X | X |
NOTE: X = combination evaluated.
resistance in the Cantabro test, the |E∗| results from the performance modeling experiment were used to determine G-Rm for mixtures after combined aging and moisture conditioning. Analogous to the G-R parameter for binders, this G-Rm parameter combines both aspects of rheology (stiffness and embrittlement) and is calculated based on Equation 2, where |E∗| is mixture dynamic modulus at 20°C, 5 Hz, and φ is mixture phase angle at 20°C, 5 Hz.
| (2) |
2.4 Mixture Cracking Performance Modeling
The cohesive zone model (CZM) performance modeling approach requires |E∗| to measure mixture stiffness and IDEAL-CT to characterize mixture fracture as inputs for the pavement-level model simulation used to predict damage and the evolution of cracking performance under traffic conditioning. FlexPAVE™ requires |E∗| and cyclic fatigue (CF) test results as inputs. Three replicate results were obtained for |E∗|, and four replicate results were measured for IDEAL-CT. Three replicate results were obtained for CF testing. The material combinations shown in Table 8 were selected for both performance modeling efforts. The purpose was to investigate the effects of various factors and their respective levels under different environmental conditions, specifically aging and moisture, tied to the climatic zones shown in Figure 2. The following factors and associated levels were evaluated:
- Aggregate type (two levels): NR, SR
- RAM type and source (three levels): Northeast RAP, Northeast TOAS, Southeast1 RAP
- RBR (two levels): typical, high (>0.30)
- Virgin binder type (four levels): PG 58-28 Low ΔTc, PG 70-28, PG 64-22 Low ΔTc, PG 58-28 High ΔTc
- High RAM strategies (five levels): none (control), RA, and decreased RBA alone and in a hybrid strategy with softer binder or PMA
- Moisture damage strategies (two levels): none, LAS
- Conditioning (two levels): Freeze combination (shorter mid-term aging [6 h at 135°C] with PMA mixtures aged 3 days at 95°C and moisture conditioning with F/T), No Freeze combination (longer mid-term aging [8 h at 135°C] and moisture conditioning without F/T)
As for the cracking and raveling experiments, component materials containing asphalt binder were nested according to the climatic zone. Thus, RAM sources and virgin binder types (including
Table 8. Mixture cracking performance modeling experiment.
| Aggregate | RAM Source | RBR | Virgin Binder Type | High RAM Strategies | Moisture Damage Strategies | Conditioning | IDEAL-CT | |E*| | CF |
|---|---|---|---|---|---|---|---|---|---|
| North Resistant | NE RAP | 0.21 | PG 58-28 Low ΔTc = +0.4 | None (Control) | LAS | Freeze Combo | X | X | X |
| 0.37 | PG 58-28 Low ΔTc = +0.4 | Recycling Agent @ 4.8% | None | Freeze Combo | X | X | X | ||
| PG 70-28 ΔTc = −0.6 | PMA + Decreased RBA | None | Freeze Combo | X | X | X | |||
| NE RAP+ NE TOAS | 0.44 | PG 58-28 Low ΔTc = +0.4 | Decreased RBA | None | Freeze Combo | X | X | X | |
| South Resistant | SE1 RAP | 0.16 | PG 58-28 High ΔTc = +2.0 | Softer + Decreased RBA | None | No Freeze Combo | X | X | X |
| 0.29 | PG 64-22 Low ΔTc = −1.4 | Recycling Agent @ 7.0% | None | No Freeze Combo | X | X | X |
NOTE: X = combination evaluated.
those in two of the high RAM strategies) were tied to those materials commonly used in either the North/Freeze or South/No Freeze climatic zone. In addition, the combined conditioning protocols were also tied to climatic zone with shorter mid-term critical aging and moisture conditioning, with F/T used for North/Freeze mixtures and longer mid-term critical aging and moisture conditioning without F/T used for South/No Freeze mixtures.
2.5 Evaluation Tools
This project aimed to develop for AASHTO consideration a comprehensive draft Standard Practice for the design and evaluation of durable asphalt mixtures. This effort involved revising the preliminary framework proposed in Phase I based on an analysis of the extensive laboratory experiments described. Specifically, results from the cracking, moisture, and raveling experiments presented were analyzed to
- Compare the experiment results to the performance thresholds proposed in the preliminary framework
- Evaluate the effects of different factors through pairwise comparisons, keeping all other mixture variables constant
- Compare the experiment results for high RBR mixtures with those for typical RBR mixtures to identify potential durability issues
In addition, results of the mixture characterization, along with the resulting cracking performance modeling by two approaches to determine mixture response under the combined effects of aging, moisture, and traffic, were used to support the revised draft Standard Practice.
2.5.1 Preliminary Durability Assessment Framework
Table 9 and Table 10 show the proposed test methods and parameters, conditioning protocols, and preliminary thresholds within a BMD framework for assessing mixture durability in each climatic zone. The majority of the test methods and protocols in the laboratory experiments were selected based on the results from the Phase I questionnaires shown in an online appendix to
Table 9. Draft high RBR mixture durability assessment framework for both Dry-Freeze (orange) and Wet-Freeze (blue) North/Freeze climatic zones.
| Durability Issue | Parameter and Test | Temperature | Aging | Moisture | Threshold |
|---|---|---|---|---|---|
| Cracking @ Tint | CTIndex by IDEAL-CT | 25°C | STOA + 6 h @ 135°C (or 3 days @ 95°C) | None | ≥ 30 |
| Cracking @ Tlow | Gf by DCT | Climate PGL+10°C | STOA | None | ≥ 400 J/m2 |
| Gf by DCT Ratio | Climate PGL+10°C | [STOA+ 6 h @ 135°C]/[STOA] | None | ≥ 85% | |
| Moisture Susceptibility | ST by IDT | 25°C | STOA | None | ≥ 85psi |
| TSR by IDT | 25°C | STOA | [T 283 w/F/T]/[None] | ≥ 80% | |
| SIP by HWT | 45°C | STOA | Tested Underwater | ≥ 9,000 | |
| SN by HWT | 45°C | STOA | Tested Underwater | ≥ 2,000 | |
| Raveling | %AL by Cantabro | 25°C | STOA | None | ≤ 10 |
| %AL by Cantabro Ratio | 25°C | [STOA+ 6 h @ 135°C + T283 w/F/T] / [STOA] | ≤ 1.75 | ||
| Rutting | N12.5 by HWT | 45°C | STOA | None | ≥ 10,000 for PG 58 ≥ 15,000 for PG 64 ≥ 20,000 for PG 70 |
NOTE: SIP = stripping inflection point; SN = stripping number.
Table 10. Draft high RBR mixture durability assessment framework for both Dry–No Freeze (red) and Wet–No Freeze (green) South/No Freeze climatic zones.
| Durability Issue | Parameter and Test | Temperature | Aging | Moisture | Threshold |
|---|---|---|---|---|---|
| Cracking @ Tint | CTIndex by IDEAL-CT | 25°C | STOA + 8 h @ 135°C (or 5.0 days @ 95°C) | None | ≥ 20 |
| Moisture Susceptibility | ST by IDT | 25°C | STOA | None | ≥ 85 psi |
| TSR by IDT | 25°C | STOA | [T 283 w/out F/T]/[None] | ≥ 80% | |
| SIP by HWT | 50°C | STOA | Tested Underwater | ≥ 9,000 | |
| SN by HWT | 50°C | STOA | Tested Underwater | ≥ 2,000 | |
| Raveling | %AL by Cantabro | 25°C | STOA | None | ≤ 10 |
| %AL by Cantabro Ratio | 25°C | [STOA+ 8 h @ 135°C + T283 w/out F/T]/[STOA] | [T 283 w/out F/T]/[None] | ≤ 1.75 | |
| Rutting | N12.5 by HWT | 50°C | STOA | None | ≥ 10,000 for PG 64 ≥ 15,000 for PG 70 ≥ 20,000 for PG 76 |
NOTE: SIP = stripping inflection point; SN = stripping number.
this report, but the following modifications were made based on panel feedback and availability of data to set preliminary thresholds:
- The shorter mid-term critical aging protocol for cracking resistance and raveling evaluation was changed to 6 h at 135°C (with an alternate of 3 days at 95°C required for PMA mixtures) because of a lack of field performance verification for 20 h at 95°C.
- Ratios of properties (before and after moisture conditioning or loose-mix aging) were added.
- The CF test was added for comparison to performance modeling results to verify thresholds and allow for fundamental characterization of mixture cracking resistance and prediction of pavement cracking performance using FlexPAVE.
- An alternate of 5.0 days at 95°C for the longer mid-term critical aging protocol (required for PMA mixtures) for the South/No Freeze climatic zones was also provided based on modeling of oxidative aging (Kim, Castorena, et al. 2021; Elwardany et al. 2021).
The project’s durability database provided test results for a range of component materials and corresponding mixtures used in the four climatic zones (Figure 2). However, additional field validation will be essential to verify the proposed thresholds or criteria for the comprehensive draft Standard Practice.
In the preliminary framework developed in Phase I, the conditioning protocols and test temperatures are adjusted based on climatic zone (i.e., North/Freeze and South/No Freeze). However, the performance thresholds remain constant for the mixture resistance to the primary durability issues (surface cracking, moisture susceptibility, and raveling). This approach is similar to the PG system for binders. However, unlike the PG system, the preliminary framework is based on climatic zones rather than specific environmental conditions for individual projects.
In addition, the same test temperatures were proposed for assessing intermediate-temperature cracking resistance, moisture susceptibility, and raveling resistance to be consistent with the current practice of mixture performance testing for many SHAs. However, the proposed test temperature for evaluating low-temperature cracking resistance varied based on the project location, following recommendations from research by Dave et al. (2019).
For designing balanced mixtures, a rutting test conducted at a high temperature based on the climatic zone is proposed, and the thresholds are varied depending on the climate-based binder grade. This approach is proposed to adapt the existing test methods and current practices
to incorporate durability specific to the environmental conditions of individual projects. Note that AV content significantly affects all selected mixture tests and should generally be controlled within 7% + 0.5% for both mix design and performance testing (Cox et al. 2017).
The preliminary thresholds provided in Table 9 and Table 10 are based on prior and ongoing research, specifications, and limited data correlating laboratory testing to field performance. These test methods, conditioning protocols, and thresholds were considered in proposing the revised draft Standard Practice.
To achieve balanced performance with an emphasis on cracking resistance for high RBR mixtures, rutting resistance thresholds in terms of number of cycles to produce a rut depth of 12.5 mm (N12.5) from HWT were adopted from Texas’ specifications for the South/No Freeze climatic zones (TxDOT 2014). For the North/Freeze climatic zones, these thresholds were each shifted to a colder (by 6°C) binder grade following the Illinois specifications for 50°C testing (Illinois Department of Transportation 2016). These regions were divided at approximately 40°N latitude, as suggested in NCHRP Project 09-52A (Newcomb et al. 2019). Different testing temperatures, namely 45°C for the North/Freeze and 50°C for the South/No Freeze zones, were proposed in the draft framework based on a review of specifications for northern states (e.g., Maine [45°C, 48°C, or 50°C depending on binder grade], Massachusetts [45°C], Montana [44°C, 50°C, or 56°C depending on binder grade], Washington [50°C], Wisconsin [46°C], Illinois [50°C], and Iowa [40°C or 50°C depending on binder grade]) and southern states (e.g., Georgia [50°C], Louisiana [50°C], Missouri [50°C], Oklahoma [50°C], Tennessee [50°C], and Texas [50°C]).
Additionally, the HWT was proposed to simultaneously evaluate moisture susceptibility with rutting resistance, with thresholds for the conventional stripping inflection point (SIP) and the alternate stripping number (SN) determined based on research correlating laboratory and field performance (Yin et al. 2020). For the HWT, STOA of 4 h at 135°C is used per AASHTO R 30 because the shorter protocol of 2 h at 135°C recommended by NCHRP Projects 09-49, 09-52, and 09-52A to better simulate plant mix and cores at construction had not been adopted during the experiment design (Epps Martin et al. 2014; Newcomb et al. 2015; Newcomb et al. 2019).
The TSR per AASHTO T 283 with and without an F/T cycle was also proposed for assessing moisture susceptibility for both North/Freeze regions and both South/No Freeze regions, respectively. TSR may not be required for the Dry–No Freeze region, where moisture damage is unlikely a concern. An 80% minimum TSR threshold was adopted from the Superpave volumetric mix design per AASHTO M 323, and STOA of 4 h at 135°C facilitated comparison with the HWT moisture susceptibility parameters. Additionally, a minimum unconditioned tensile strength (ST) by IDT of 85 psi after STOA was proposed based on TxDOT specifications (TxDOT 2014).
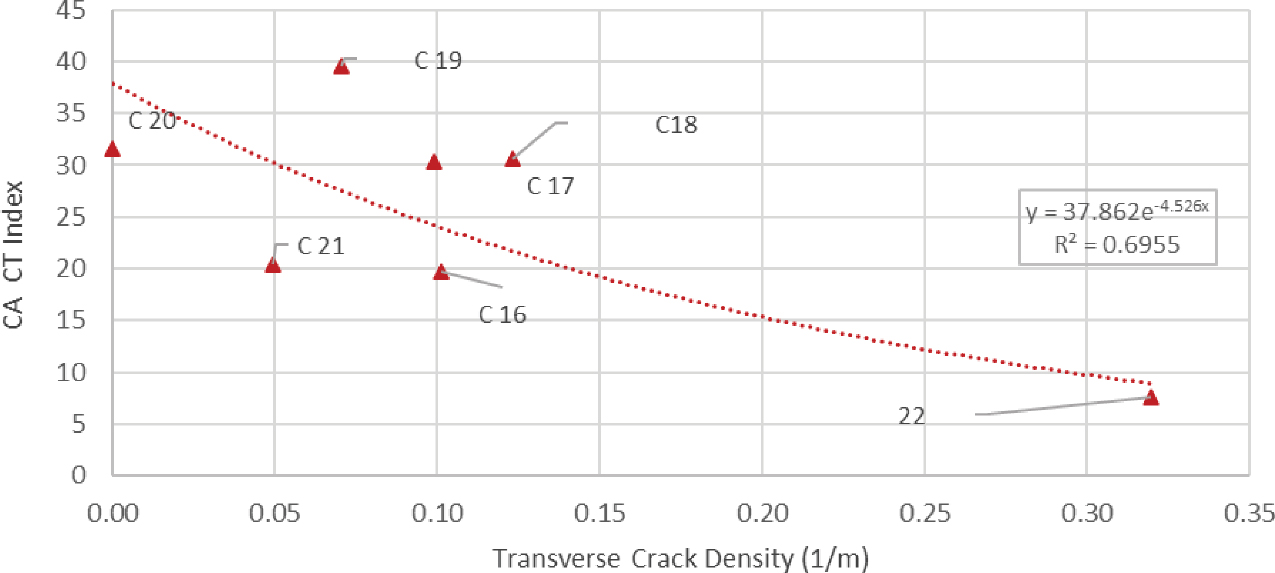
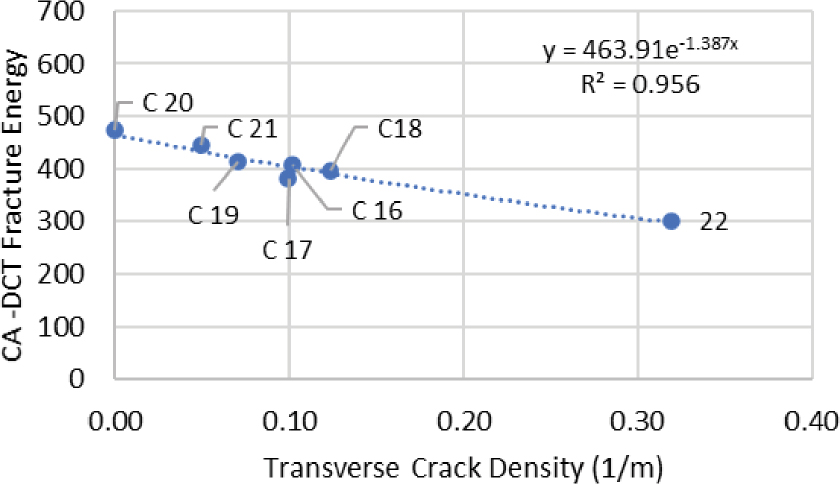
To assess intermediate- and low-temperature cracking resistance for high RBR mixtures, thresholds were proposed for the cracking tolerance index (CTIndex) at 25°C from the IDEAL-CT and fracture energy (Gf) from the DCT test at the climate-based PGL plus 10°C. These proposed thresholds were determined based on laboratory-to-field performance correlations collected from several studies at the NCAT Test Track (Figure 5) and at the Minnesota Department of Transportation Road Research Facility (MnROAD) (Figure 6 and Figure 7). In these correlations, the field cracking performance data were plotted against the IDEAL-CT and the DCT test results for reheated plant-mixed laboratory-compacted (RPMLC) specimens. These specimens underwent varying mid-term critical aging protocols: 8 h at 135°C for the NCAT Test Track in the South/No Freeze region and 6 h at 135°C for MnROAD in the North/Freeze region (Vrtis 2021). The shorter midterm critical aging protocol was also recently recommended based on studies conducted in other northern states (Bahia, Sadek, et al. 2018; J. Sias, A. Hanz, and G. Reinke, Long-Term Testing and Analysis on Asphalt Mix Rejuvenator Field Sections project kick-off meeting, 2020).
The proposed CTIndex threshold of 20 for intermediate-temperature cracking in a South/No Freeze region precludes both premature top-down and reflective cracking at the surface after
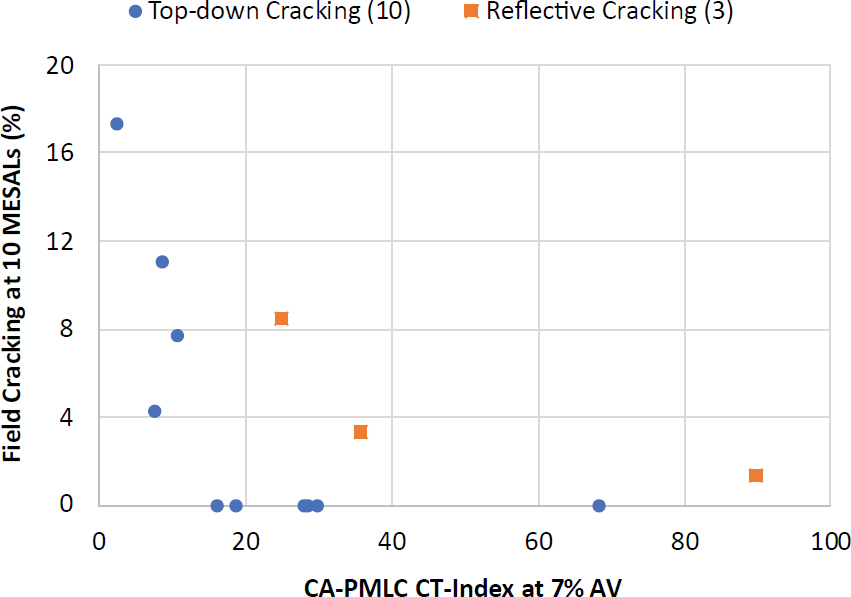
Figure 5. Field cracking performance versus aged IDEAL-CT results from the NCAT cracking group experiment (West et al. 2021).
10 million equivalent single axle loads (ESALs) of accelerated heavy truck loading on the NCAT Test Track (Figure 6).
The proposed CTIndex threshold of 30 for intermediate-temperature cracking in a North/Freeze region precludes low-temperature or thermal cracking at the surface after 5 years in service (Figure 5). This threshold was recently adopted by the Wisconsin Department of Transportation for its provisional BMD specification, with approximately 10% of existing Wisconsin mixtures expected to fail based on benchmarking studies (Hefel 2021; West, Yin, et al. 2021). In addition, CTIndex values were evaluated for the North/Freeze regions to capture any brittle behavior after shorter mid-term critical aging.
When tested after STOA, the threshold for CTIndex varied significantly between typical mixtures, with good performance from 30 in Florida to 150 in Maine (Nash et al. 2021; Veeraragavan et al. 2021). This difference is likely attributable to differences in virgin binder grades, RAP contents, and RAP sources, among other mixture composition variables. The previous studies suggest that IDEAL-CT tends to favor mixtures with softer virgin binders and less aged RAP, which could be one of the reasons consistently higher CTIndex results are observed in mixtures from northern states compared with those from southern states.
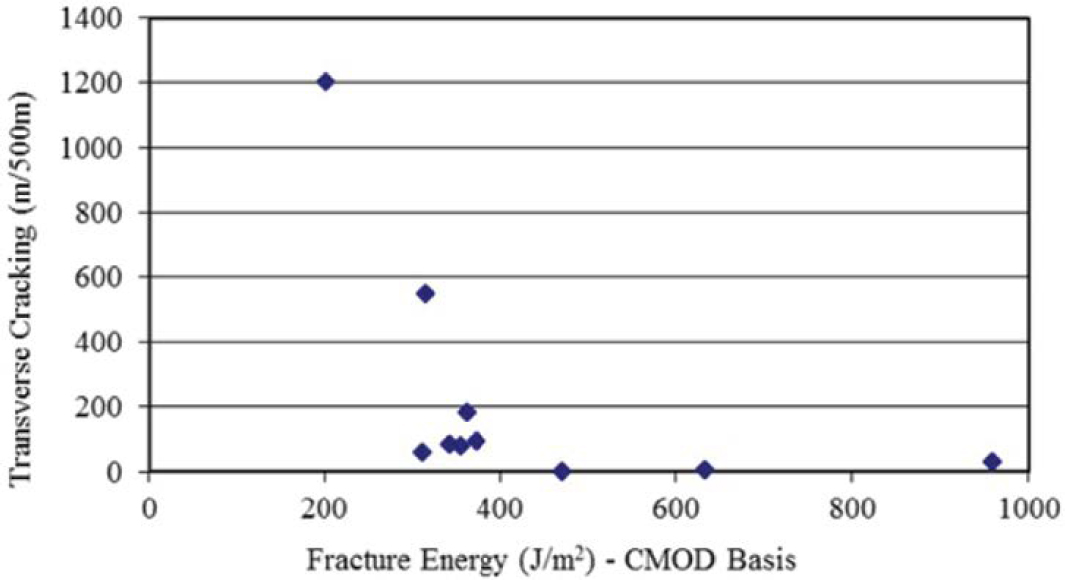
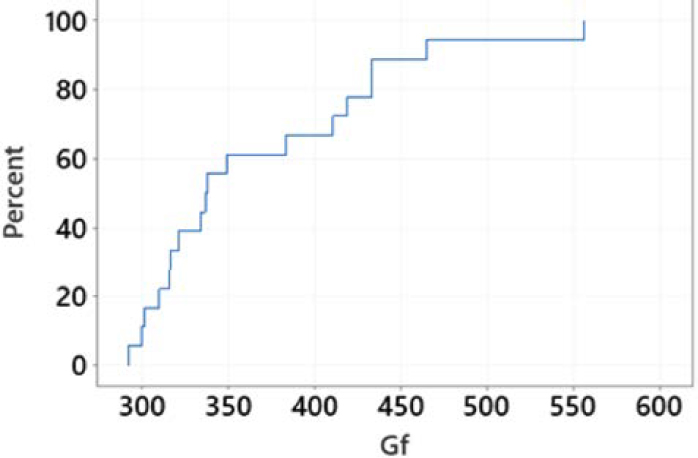
The proposed threshold for low-temperature cracking was set at a minimum Gf of 400 J/m2 for STOA specimens following Minnesota Department of Transportation recommendations (Marasteanu et al. 2012; Figure 8). An additional requirement is also proposed to retain at least 85% of the initial STOA fracture energy after shorter mid-term critical aging of 6 h at 135°C. This requirement is based on the MnROAD Thermal Cracking Group study (Vrtis 2021; Figure 7), a Wisconsin benchmarking study with shorter mid-term critical aging (West, Yin, et al. 2021; Figure 9), and a New Hampshire study on aging (Sias et al. 2019; Figure 10) in a North/Freeze region. As more data become available, the unaged Gf and Gf ratio thresholds could be replaced with an aged Gf threshold for simplicity.
For mixture raveling resistance, the proposed threshold for Cantabro percent mass loss for dense-graded mixtures after STOA was based on an extensive database from Mississippi State University and associated field performance. The proposed threshold for the ratio of conditioned to unconditioned specimens was based on a review of this same database, thresholds of 1.2 to 1.3 for conditioned to unconditioned PFC (i.e., porous or permeable friction course) mixtures
recommended by an FHWA study, and limited data for dense-graded high RBR mixtures on the NCAT Test Track exhibiting good performance with ratios of 1.1 to 1.6 for long-term critically aged (8 h at 135°C) to unaged RPMLC specimens (Arámbula Mercado et al. 2019; Bazuhair et al. 2020; I. L. Howard, personal communication, August 3, 2021).
The combined proposed conditioning protocols (with aging and moisture) are less severe than those proposed by Mississippi State University researchers, and thus the ratio for conditioned to unconditioned specimens is less than the university’s recommendation of 2.0 (I. L. Howard, personal communication, August 3, 2021). To account for the combined impacts of aging and moisture conditioning on mixture raveling resistance, the combined protocols include STOA, followed by longer mid-term critical aging (8 h at 135°C) for the South/No Freeze regions or shorter mid-term critical aging (6 h at 135°C) for the North/Freeze regions, then moisture conditioning per AASHTO T 283 with F/T in both North/Freeze regions or without F/T in both South/No Freeze regions. Again, removal of moisture conditioning for the Dry–No Freeze region was considered.
The companion table from NCHRP Project 09-58, revised in NCHRP Project 20-44(24), offered preliminary guidelines for component material selection and proportioning to ensure adequate durability of high RBR mixtures (Epps Martin et al. 2019; Leavitt, Epps Martin, and Arámbula Mercado 2023).
2.5.2 Statistical Comparisons
Engineered experiment designs with factors of interest and corresponding factor levels were developed for this project. These designs accounted for both resource limitations and physical constraints, such as unlikely or infeasible factor-level combinations not pertinent to the durability of high RBR mixtures. Separate experimental designs were developed for each mixture durability issue (i.e., surface cracking, moisture susceptibility, and raveling) and performance modeling. These designs varied in terms of tests, factors, and factor levels. Note that each test played the role of a response variable that captures mixture durability. Only main effects were evaluated after a revision of the experiment designs, which follow a stepwise approach.
The results were statistically compared using Tukey’s honestly significant difference (HSD) test and practically analyzed using the difference two-sigma limit in percent (d2s%), as provided in the AASHTO standard precision statements or Azari (2010). The d2s% establishes the allowable difference (expressed as a percentage of the overall mean) between the same mixtures measured on multiple replicates, either in the same laboratory or in different laboratories. In this application, an estimated d2s% was used to define the practical differences between different mixtures because variations below this threshold could not be differentiated by specific tests, even when assessing the same mixture.
Table 9 and Table 10 provide the tools for true performance BMD, but tests and thresholds or criteria provided for component materials may be used to screen materials and reduce iterative mixture testing efforts and thus costs and resources. Therefore, regression analysis was used to identify component material properties tied to mixture durability properties, following approaches similar to those used by Bonaquist (2016) and Kaseer et al. (2021).
2.5.3 Cracking Performance Modeling—Cohesive Zone Model
This project employed a fracture mechanics approach, using the CZM, to simulate pavement damage and predict the cracking performance of robust, durable asphalt mixtures (Kim et al. 2006; Kim et al. 2007; Baek and Al-Qadi 2009; Kim and Buttlar 2009; Dave and Buttlar 2010; Kim et al. 2010; Kim 2011; Ahmed et al. 2013; Kim et al. 2013; Ban et al. 2018; Rodrigues et al. 2019; Kim, Teixeira, et al. 2021). This method facilitates direct evaluation of the combined effects of material combinations (component materials and proportions), traffic conditions, and environmental factors on the deterioration of pavement surface mixtures with high RBR. Compared with the Pavement ME and other mechanistic approaches based on continuum damage mechanics (Olidis and Hein 2004; Al-Rub et al. 2010; Al-Rub et al. 2011; Darabi et al. 2013; Gungor et al. 2016; Wang et al. 2016; Wang et al. 2021), the CZM employs fracture mechanics to better model the formation and propagation of cracks in both asphalt mixtures and pavement structures. The unique feature of a fracture mechanics approach is its capability to handle discrete cracks in asphalt mixtures and pavement structures. Moreover, the CZM can model both brittle failure and ductile failure, which are frequently observed in asphalt mixtures under a range of environmental conditions and loading rates.
This CZM mechanistic pavement analysis method considers viscoelasticity and fracture of asphalt mixtures to accurately predict deformation and damage behavior (particularly cracking) of asphalt pavements (Kim et al. 2013; You et al. 2017; Ban et al. 2018; You et al. 2018; Rahmani, Kim, et al. 2020). As schematically illustrated in Figure 11, pavement modeling can directly account for the effect of mixture properties on overall pavement performance (e.g., fatigue cracking, top-down cracking, reflective cracking, low-temperature or thermal cracking, and rutting). This approach requires only a few mixture tests—such as dynamic modulus, or |E*|, to measure mixture stiffness and IDEAL-CT to characterize mixture fracture—as inputs to the pavement-level model simulation to predict damage and the evolution of cracking performance under repeated traffic environmental conditions. More specifically, the model can predict pavement performance by considering
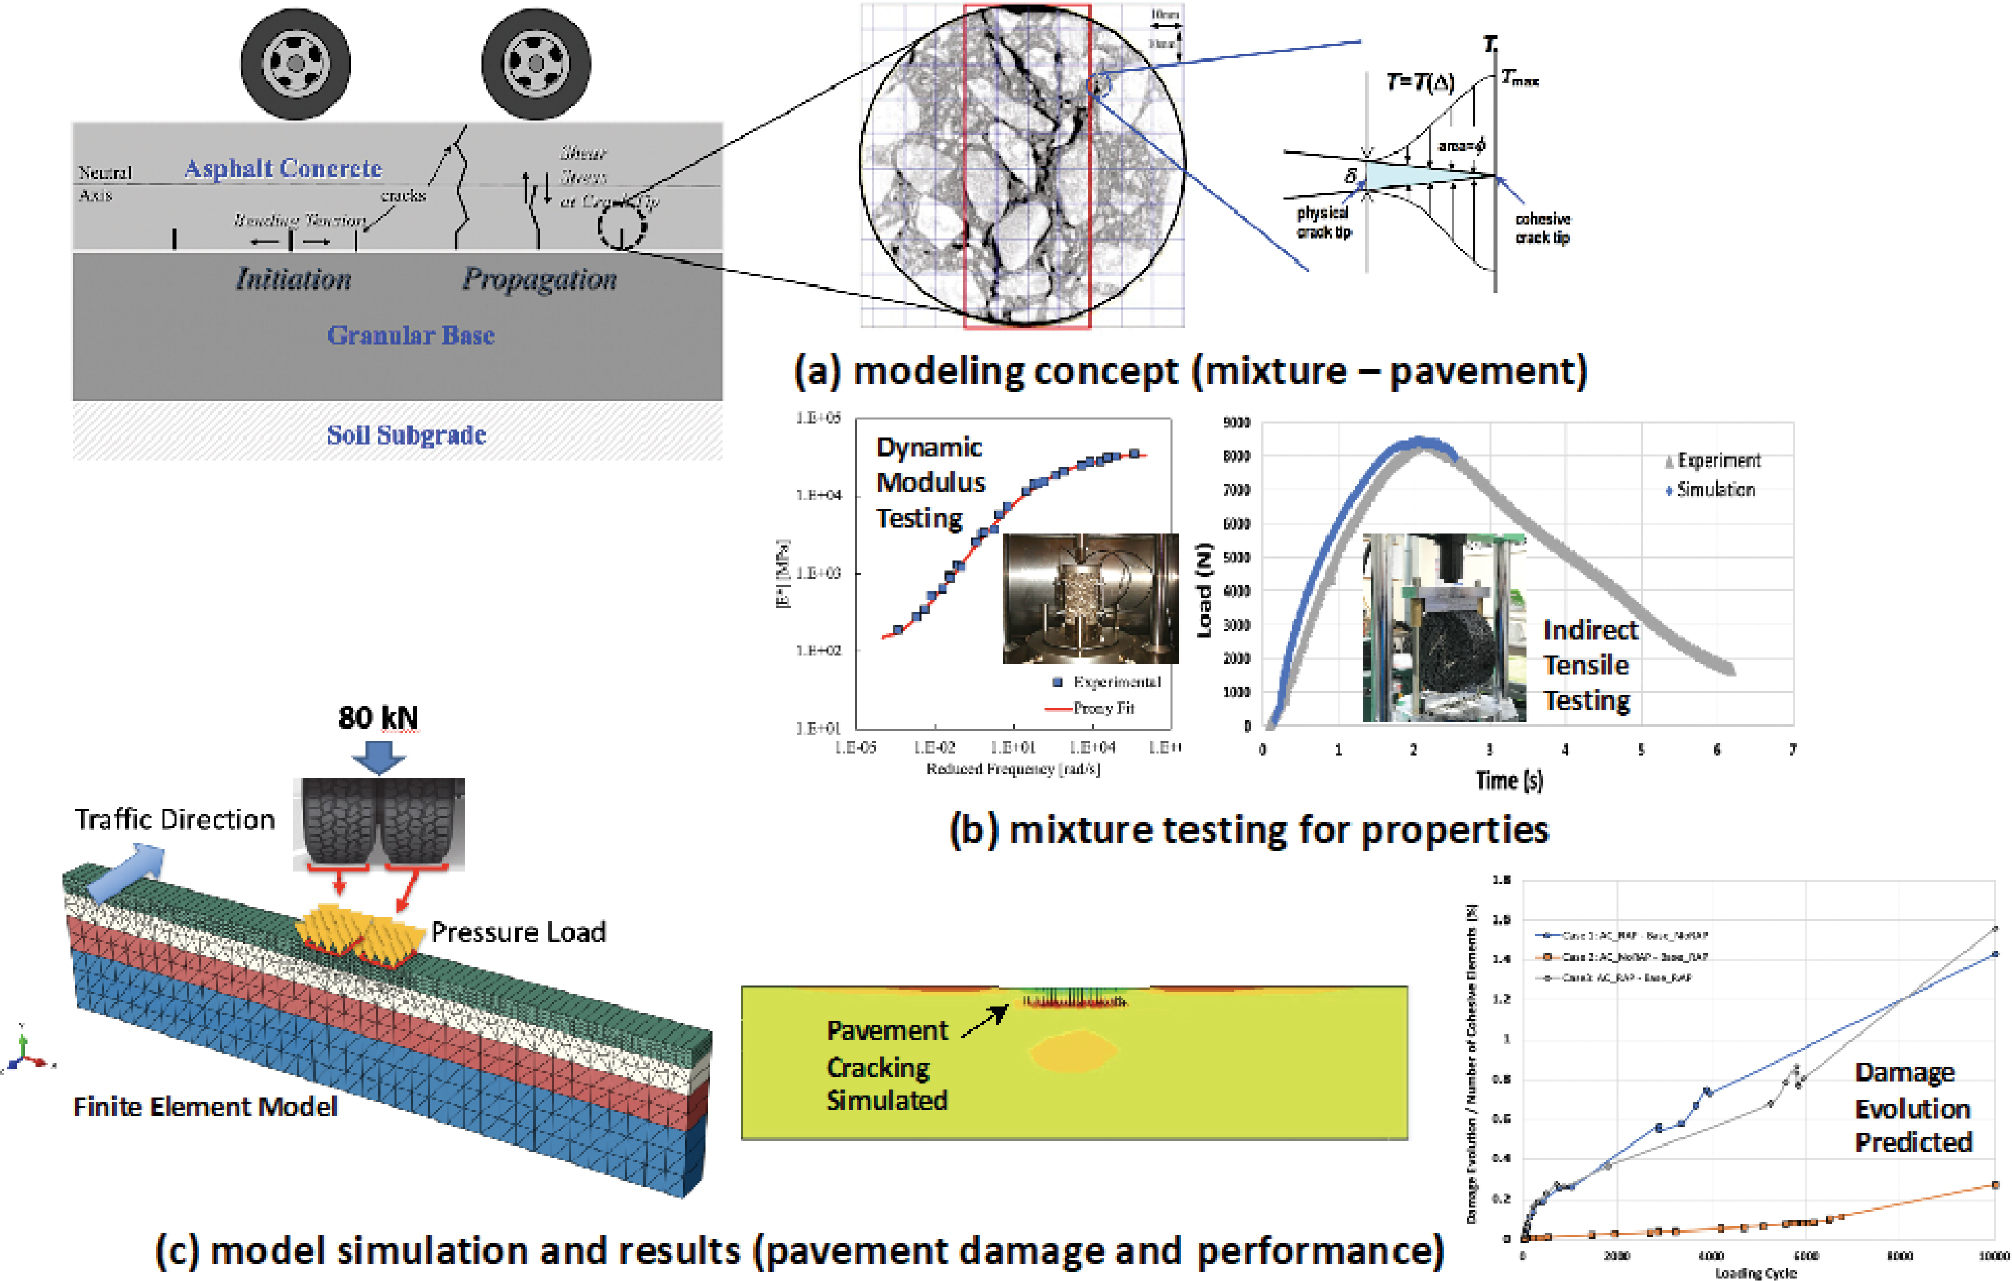
the interrelated factors of different component materials and proportions, mixture properties that can be degraded from aging and moisture effects, pavement structural configurations, and traffic conditions. This type of modeling effort has previously been successfully applied and compared with field data for model validation (You et al. 2017; Rahmani, Kim, et al. 2020; Rahmani, Nsengiyumva, et al. 2020b; Kim, Teixeira, et al. 2021; Kommidi et al. 2023).
Numerous CZMs have been explored in the literature for a broad range of materials. Among the various CZMs, this project used the nonlinear viscoelastic CZM originally proposed by Yoon and Allen (1999), which is shown to be effective in capturing the complex fracture response of asphalt concrete mixture (Kim 2011). The nonlinear viscoelastic CZM’s behavior is essentially governed by a traction-separation law depicted in Equation 3, Equation 4, and Equation 5.
| (3) |
| (4) |
| (5) |
where, Ti(t) is the traction vector; ∆i(t) is the cohesive zone (CZ) opening displacements; λ(t) is the Euclidean norm of the CZ displacements; δi is the CZ material length parameter; α(t) is the internal damage parameter; σif is the critical stress state during which the cohesive zone is initiated; i represents the mode of opening, where i = I (opening) or II (in-plane shearing) in the two-dimensional (2-D) case; and E(t) is the linear viscoelastic relaxation modulus of the CZ depicted using the Prony series representation of the generalized Maxwell model, as shown in Equation 5. E∞ and Es are the spring constants for the generalized Maxwell model, and ρs is the relaxation times, where s denotes the number of Maxwell units considered.
The usual norm is to assume the linear viscoelastic behavior of the CZ to be similar to the bulk material in which the CZs are inserted. Based on Equation 3, it can be inferred that the traction vector shows a time- and history-dependent response, and the evolution of the internal damage parameter α(t) dictates the overall traction behavior. A physical cracked surface is created when the CZ element is fully separated; full separation occurs when the traction vector assumes a value of zero, which is only possible when the damage parameter α(t) = 1. The evolution of the damage parameter α(t) is essentially given in terms of a damage evolution criterion, which completes the CZM description. Rodrigues et al. (2019) demonstrated the applicability of the nonlinear viscoelastic CZM to predict the damage behavior of fine aggregate mixtures at one loading rate, assuming the simple power-law damage evolution as shown in Equation 6 and Equation 7, where A and m are material-specific constants that govern the damage evolution behavior and thereby represent the fracture properties of the material.
| (6) |
| (7) |
In this project, this CZM approach was used to link mixture performance (measured in the experiments described) to pavement performance by parametric analysis to (a) investigate the effects of different component materials and proportions and mixture properties degraded by aging or moisture effects on pavement cracking for a representative pavement structure and (b) better
identify critical factors such as component materials and proportions or high RAM mitigation strategies toward producing robust, durable mixtures. Required inputs include mixture stiffness and fracture parameters; |E*| and IDEAL-CT tests provide these inputs. Factors that can be assessed in a parametric analysis include the effects of aging and moisture by the selected combination conditioning protocols and component materials (including RAM) and proportions on mixture properties, pavement structural configurations (including layer properties and thicknesses), and traffic conditions (such as traffic volume, weight, and speed). A single pavement structure facilitated the isolation of the mixture and durability factors to support the development of component material selection and proportioning guidelines and recommended high RAM mitigation strategies.
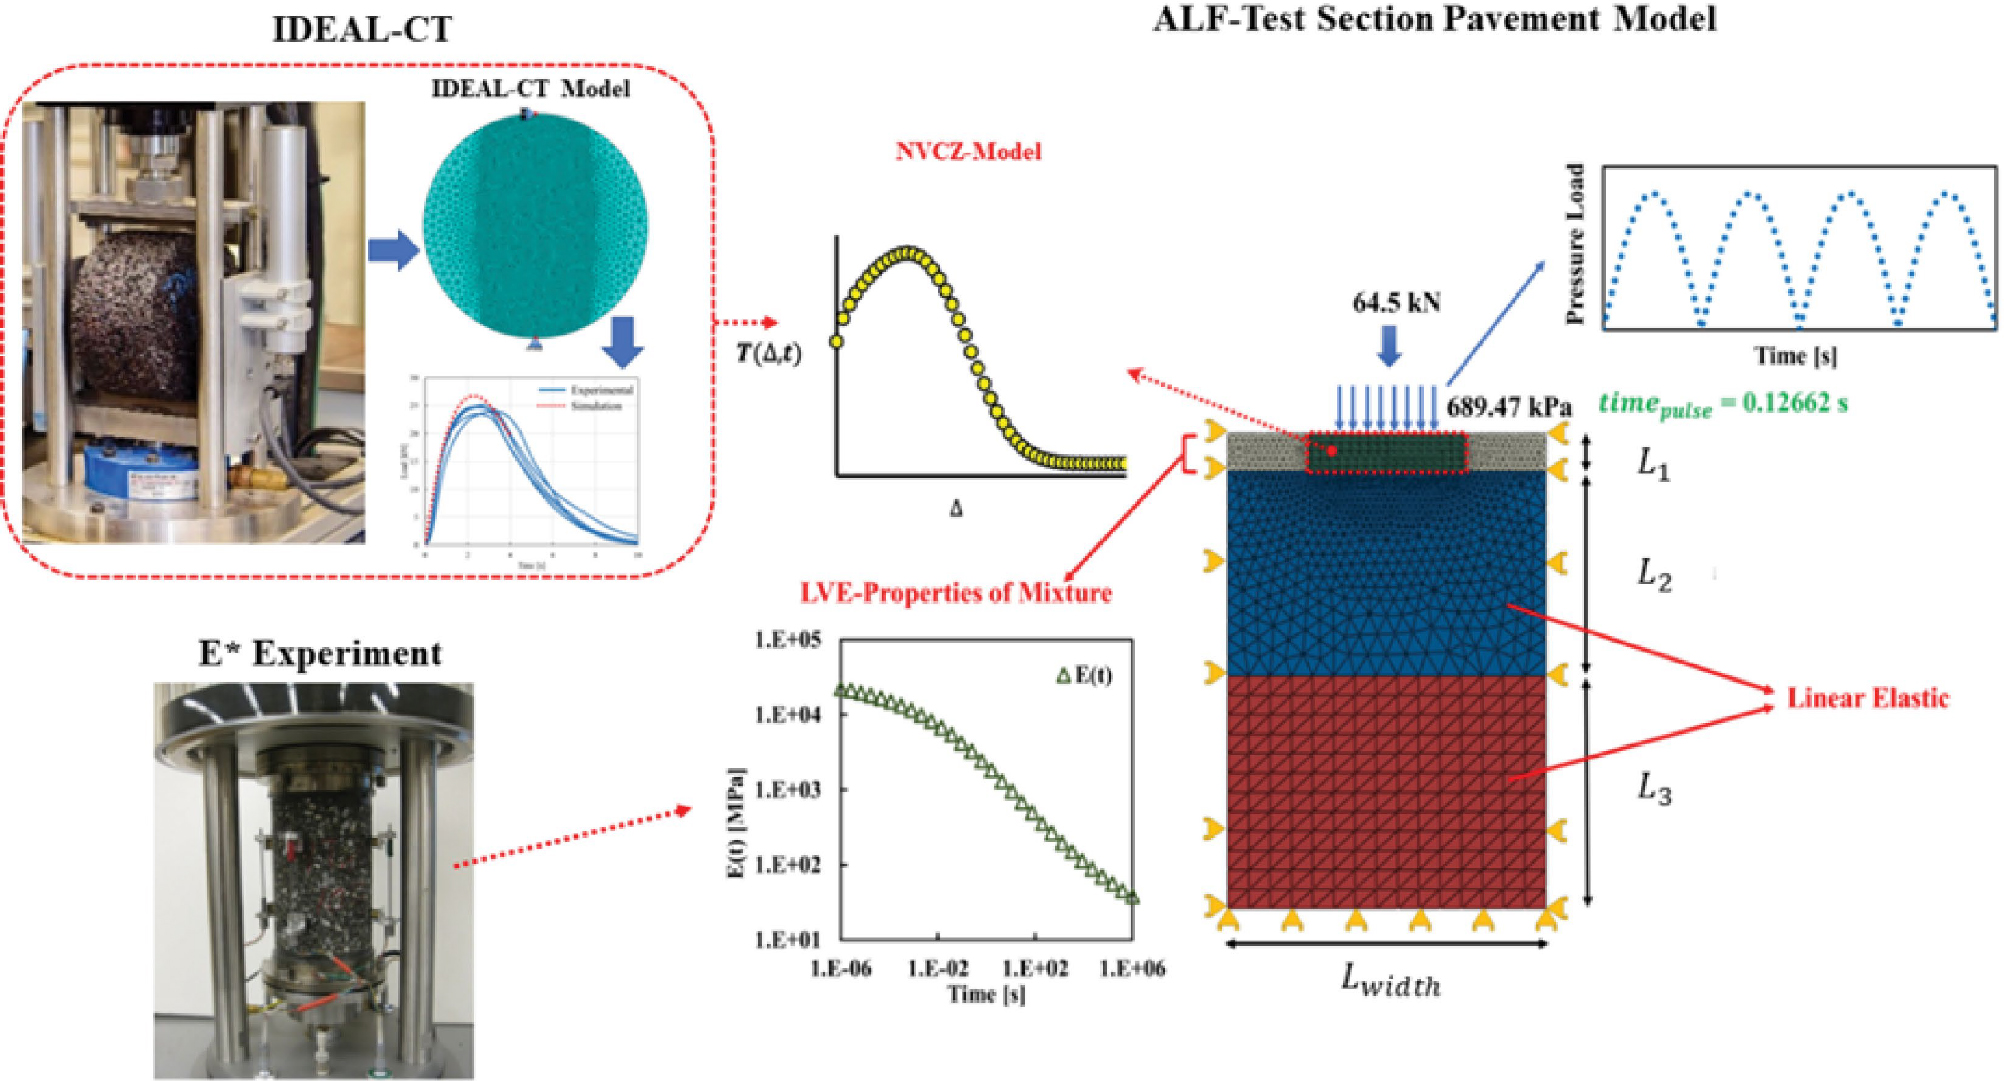
As a preliminary CZM effort to show the efficacy of the methodology depicted in Figure 11, two sample mixtures were selected and a representative pavement structure was used to model the performance of the mixtures when subjected to continuously repeated loading conditions. Figure 12 highlights the methodology adopted for this project to assess the performance of the two sample mixtures. As shown, two mixture tests (|E∗| and IDEAL-CT) were first used to obtain key mixture properties and then incorporated within a pavement model to predict the cracking performance. The fracture properties of the mixture were obtained by calibrating the IDEAL-CT test results with the model simulation by incorporating a nonlinear viscoelastic CZM to simulate cracking within the mixture. The pavement model utilized consists of a three-layer structure, with the top layer as the bituminous mixture modeled as a viscoelastic layer and the underlying base and subgrade layers modeled as linear elastic. Traffic load was applied as haversine pulse pressure loading in which the pulse was timed to simulate the velocity of a passing vehicle. A critical region below the wheel path was closely monitored for damage accumulation caused by cracking.
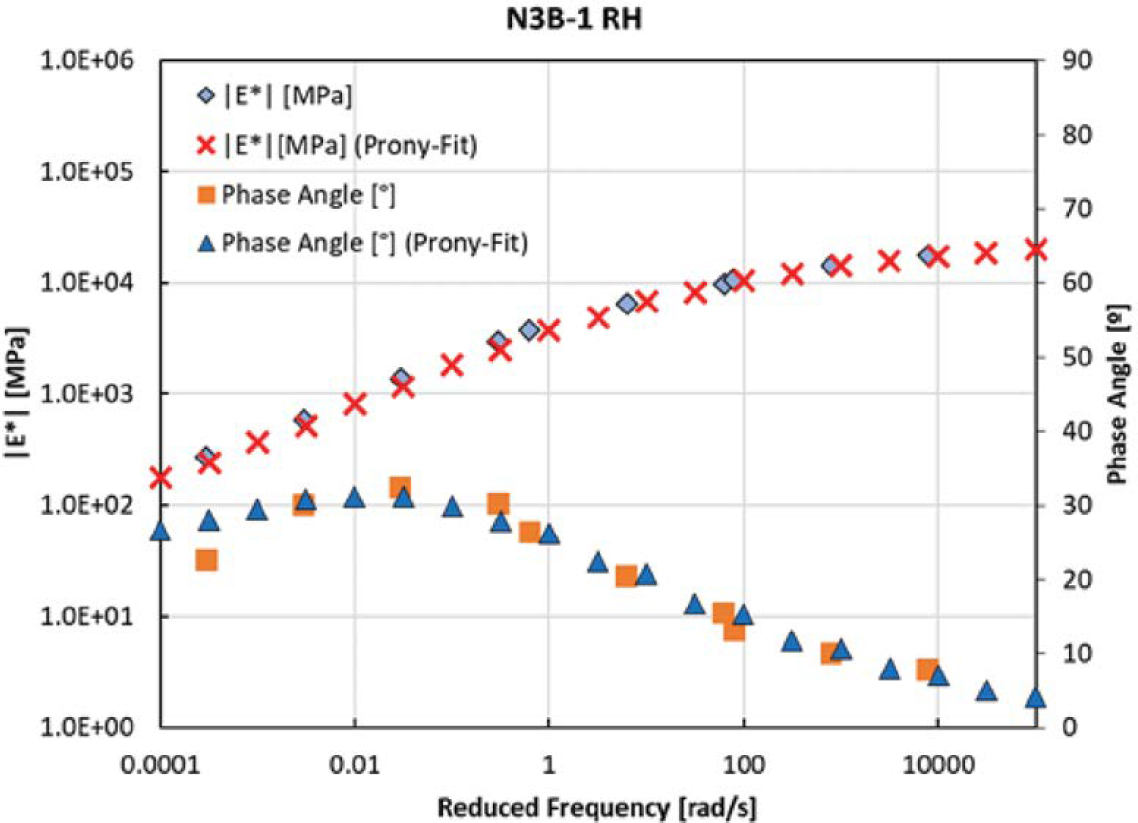
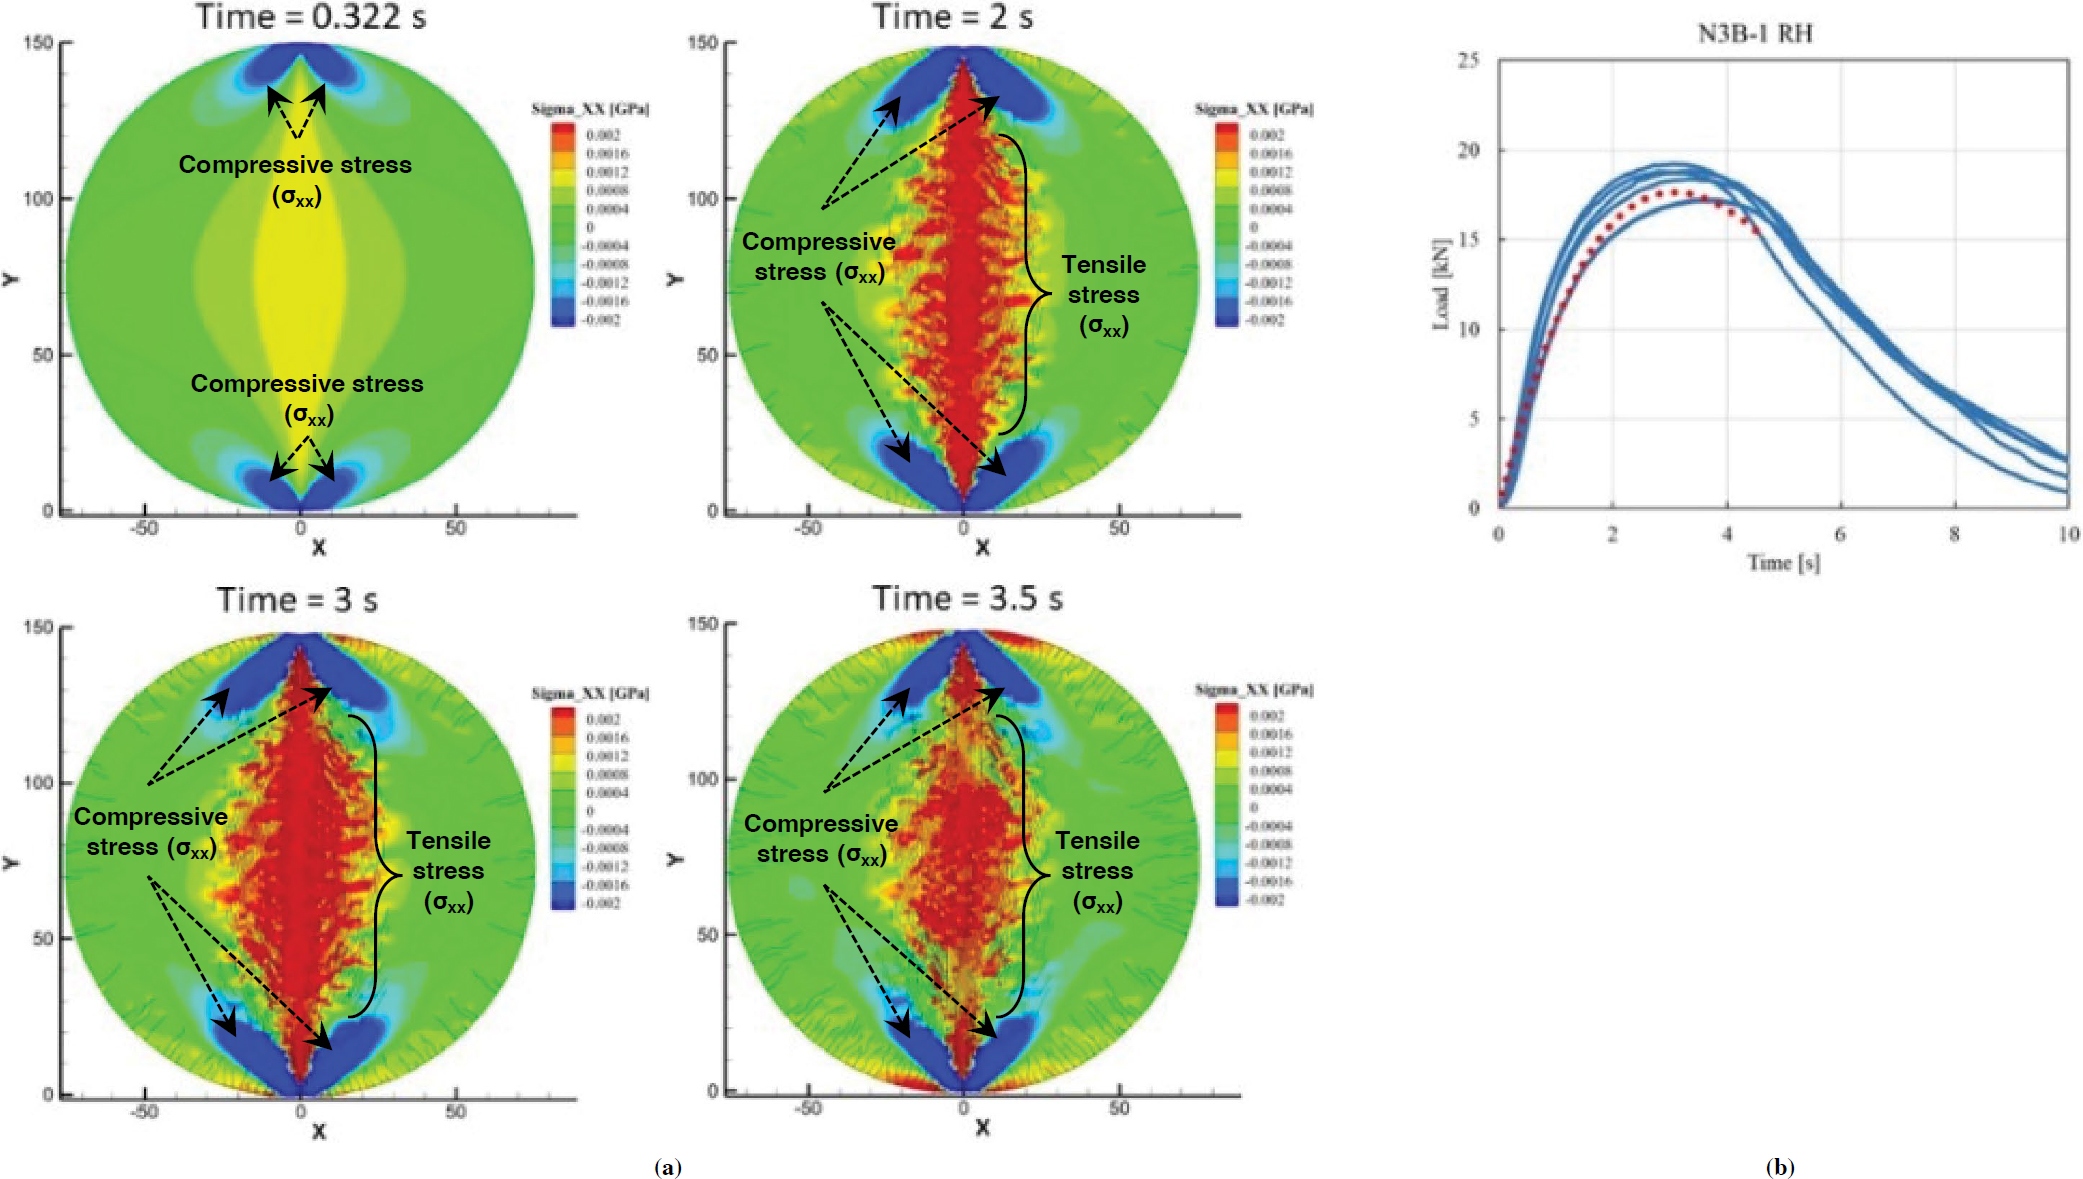
As indicated in Figure 12, essential to the CZM approach presented are the material properties of the individual layers, specifically the fracture behavior of the asphalt mixture surface layer, because they dictate the overall performance of the pavement structure. RPMLC specimen data were utilized for a sample mixture: N3B-1 RH. The |E∗| test data were first used to obtain the linear viscoelastic properties of the two sample mixtures incorporating a Prony series representation of the master curves at 20°C, as shown in Figure 13. Next, the fracture properties for each sample mixture were obtained through the experimental-numerical calibration process, which involves finite element modeling of the IDEAL-CT test. As indicated previously in Figure 11 and Figure 12, damage within the asphalt mixtures is modeled through a CZM to depict crack initiation and growth within these materials. As an example, Figure 14(a) illustrates the mixture response during the IDEAL-CT calibration process for this sample mixture (N3B-1 RH), and Figure 14(b) shows good agreement between experimental results and finite element model simulation results of the IDEAL-CT.
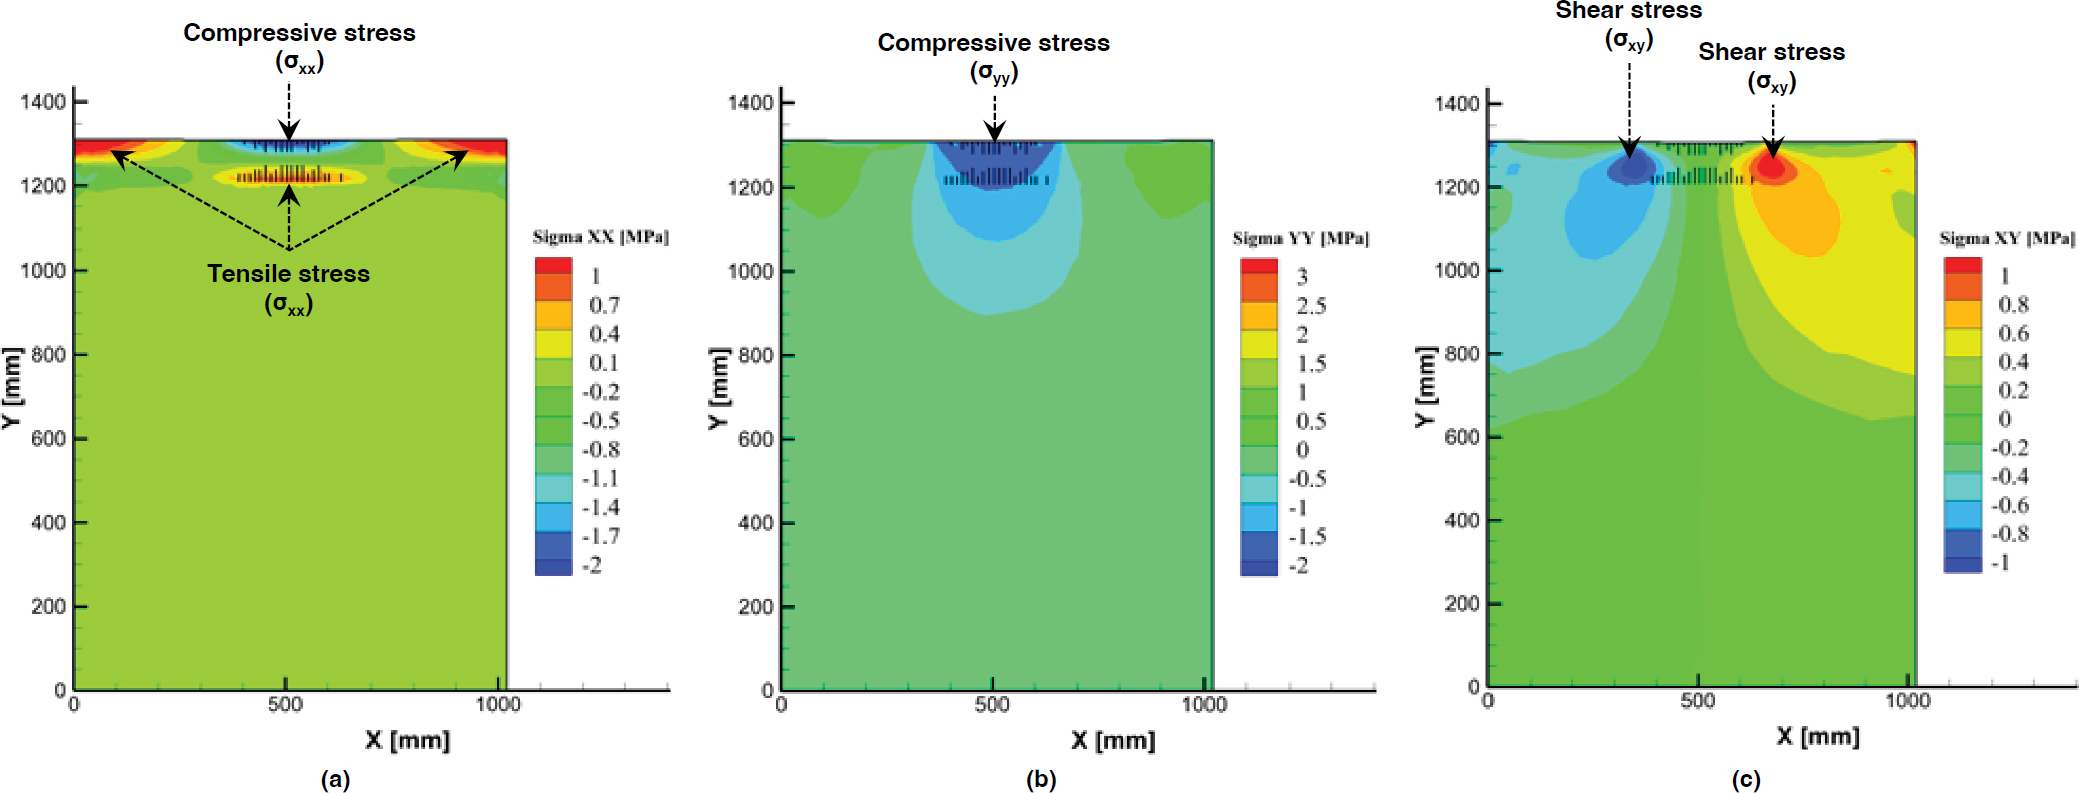
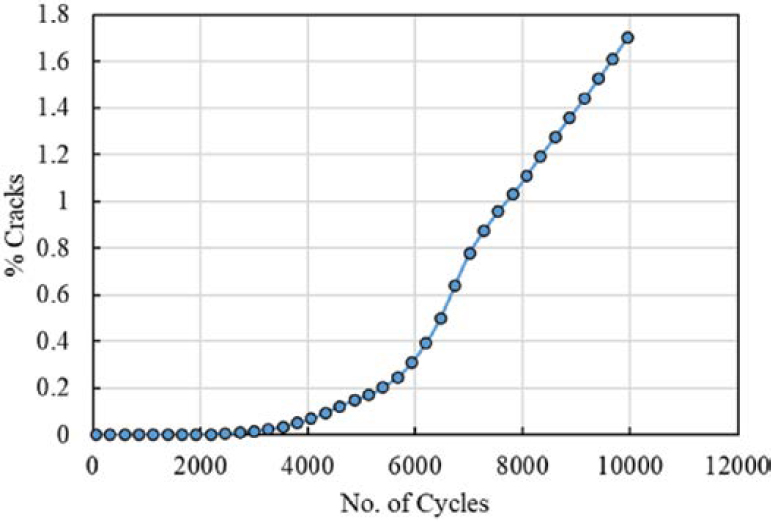
Figure 15 shows different stress contour plots (i.e., horizontal, vertical, and shear) when mode-I (opening mode) cracking is dominant within the pavement at the end of 1,000 loading cycles for mixture N3B-1 RH. As shown, the methodology can effectively capture diverse damage phenomena such as top-down and bottom-up fatigue cracking. Because the CZM is incorporated with material viscoelasticity and can address mixed-mode fracture, it can also be easily extended to account for pavement performance caused by rutting and shear failure. Figure 16 represents the pavement simulation results in terms of the percentage of cracks (% cracks) for a sample mixture N3B-1 RH that developed over 10,000 fatigue loading cycles.
2.5.4 Cracking Performance Modeling—FlexPAVE
The FlexPAVE software was also used to perform a structural pavement analysis in this project. This program employs a 3-D layered finite element model (FEM) viscoelastic code that uses layered viscoelastic moving-load analysis (LVEMA) to account for moving traffic and material viscoelasticity properties. LVEMA is considered a more efficient alternative to 3-D FEM analysis and can overcome the limitations of layered elastic analysis (Kim et al. 2022).
FlexPAVE uses viscoelastic continuum damage mechanics to evaluate the impact of traffic loading and temperature variations on asphalt pavement response and distress. To increase efficiency, the program developer makes several assumptions, such as treating the pavement as an infinite layered system with depth variation, considering temperature variation only in terms of depth, assuming cyclic traffic loads with constant tire footprint and speed, and idealizing the base and subgrade as linear elastic materials despite their nonlinear nature. These assumptions help reduce the number of load cycles through a segmented analysis scheme, dividing the pavement life into stages based on seasonal or monthly temperature variations.
At the end of each stage, FlexPAVE updates the damage, using the updated values for subsequent stages. The software provides pavement output as a percentage of damage (% damage) evolution curve. The % damage is calculated by dividing the total damage factors of all nodal points within a specified reference cross-section area by the entire cross-section area. This reference area is considered in the finite element meshes, with each node representing a mesh. To define the reference cross-section area, the program uses two overlapping triangles employed under traffic load with a pavement layer to analyze the evolution of damage (Kim et al. 2022).
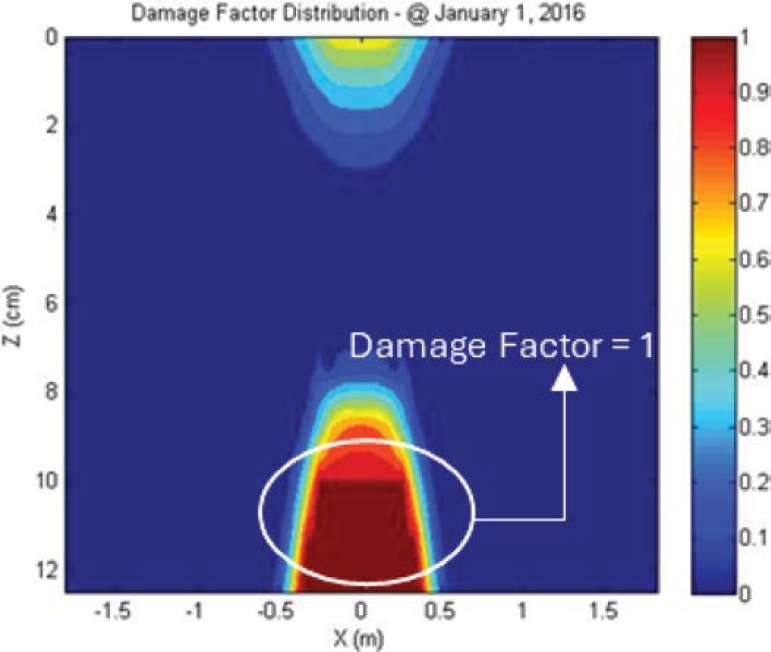
FlexPAVE performance predictions have been validated in 39 field sections worldwide, including sections on the NCAT Test Track and MnROAD (Wang et al. 2021). The predicted % damage at the end of pavement design life is used as an index parameter for comparing the fatigue performance of different durable asphalt mixtures. Moreover, the damage factor distribution contour, as shown in Figure 17, helps assess the fatigue damage mode, severity, and spatial distribution within the asphalt layer. A damage factor of 1.0, represented in dark red in Figure 17, indicates complete cracking of the asphalt mixture.
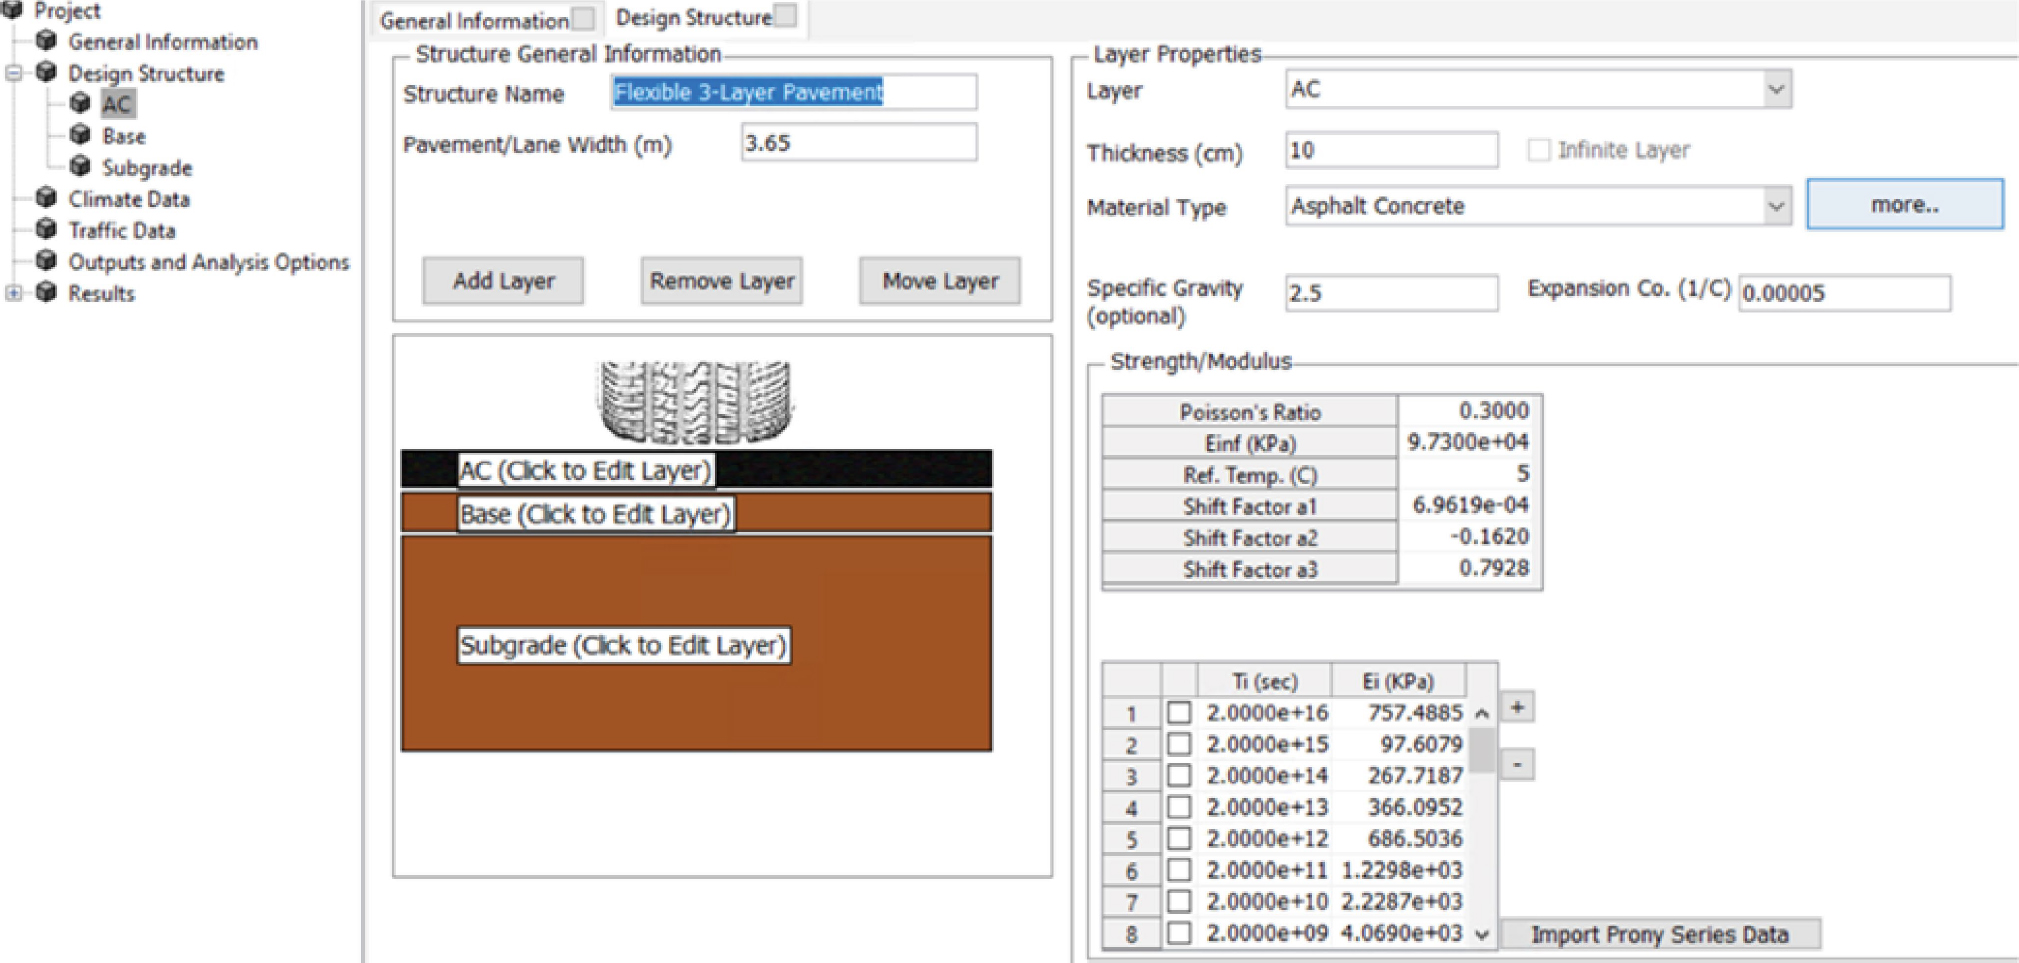
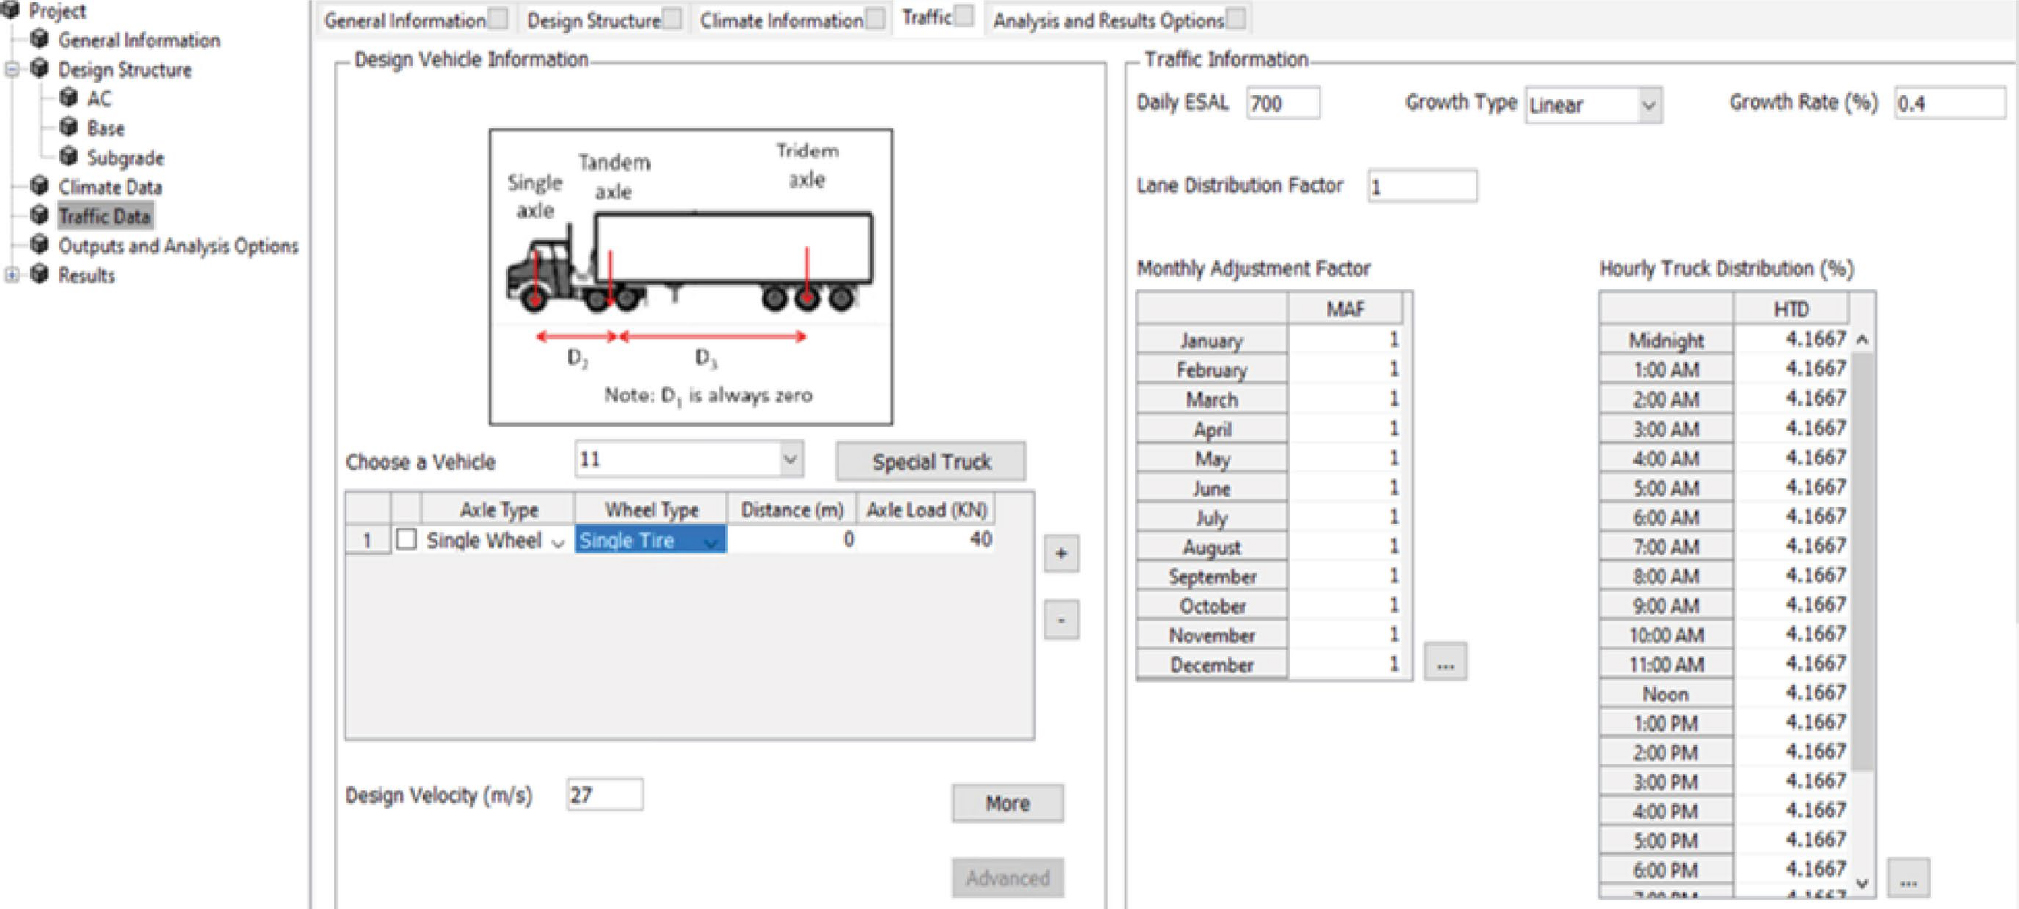
The FlexPAVE software has a user-friendly interface that simplifies the creation of pavement structures using asphalt concrete and unbound materials. Users can define material properties for each asphalt concrete layer based on established test methods, as shown in Figure 18. The FlexPAVE program allows these material characteristics to be input via output files produced
by FlexMAT™. These files are related to the |E∗| and CF tests conducted in this project. The software also allows users to specify traffic conditions and design vehicle configurations, as shown in Figure 19. Additionally, FlexPAVE gives users a range of options for selecting site-specific environmental conditions. One such option is choosing from a list of preselected U.S. cities, enabling the software to use data from the enhanced integrated climatic model to determine temperature variations throughout the pavement depth over the year. Users can also input environmental conditions via a text file or opt for an isothermal condition. When running an analysis, FlexPAVE can display results showing the pavement response to a single axle passing or predict distress over time. These data can be presented visually using contour plots or time history graphs, providing valuable insights into the behavior of the chosen point or the entire asphalt layer.