Capturing the Durability of High Recycled Binder Ratio Asphalt Mixtures (2024)
Chapter: 4 Mixture Comparisons
CHAPTER 4
Mixture Comparisons
This chapter compares all evaluated mixtures based on laboratory performance characterization and cracking performance modeling and then explores correlations between properties of component materials and mixture cracking performance. Throughout the figures in this chapter, these material combinations are color coded as orange (NR) and blue (NS) North/Freeze mixtures and red (SR) and green (SS) South/No Freeze mixtures.
4.1 Mixture Comparison of Laboratory Performance Characterization
Table 39 compares five robust high RBR mixtures evaluated for surface cracking resistance, rutting and moisture susceptibility, and raveling resistance, including three NR mixtures and two SR mixtures. The corresponding control NR and SR mixtures are also included. This comparison was shown previously in Figure 20 and Figure 22. Table 39 indicates that these five mixtures passed the preliminary performance criteria (italicized and marked in green font) for rutting and all of the primary durability issues (surface cracking, moisture susceptibility, and raveling). Results for three NS mixtures and two SS mixtures are provided because they also passed performance thresholds for all of the distresses for which they were evaluated.
4.1.1 Surface Cracking Performance
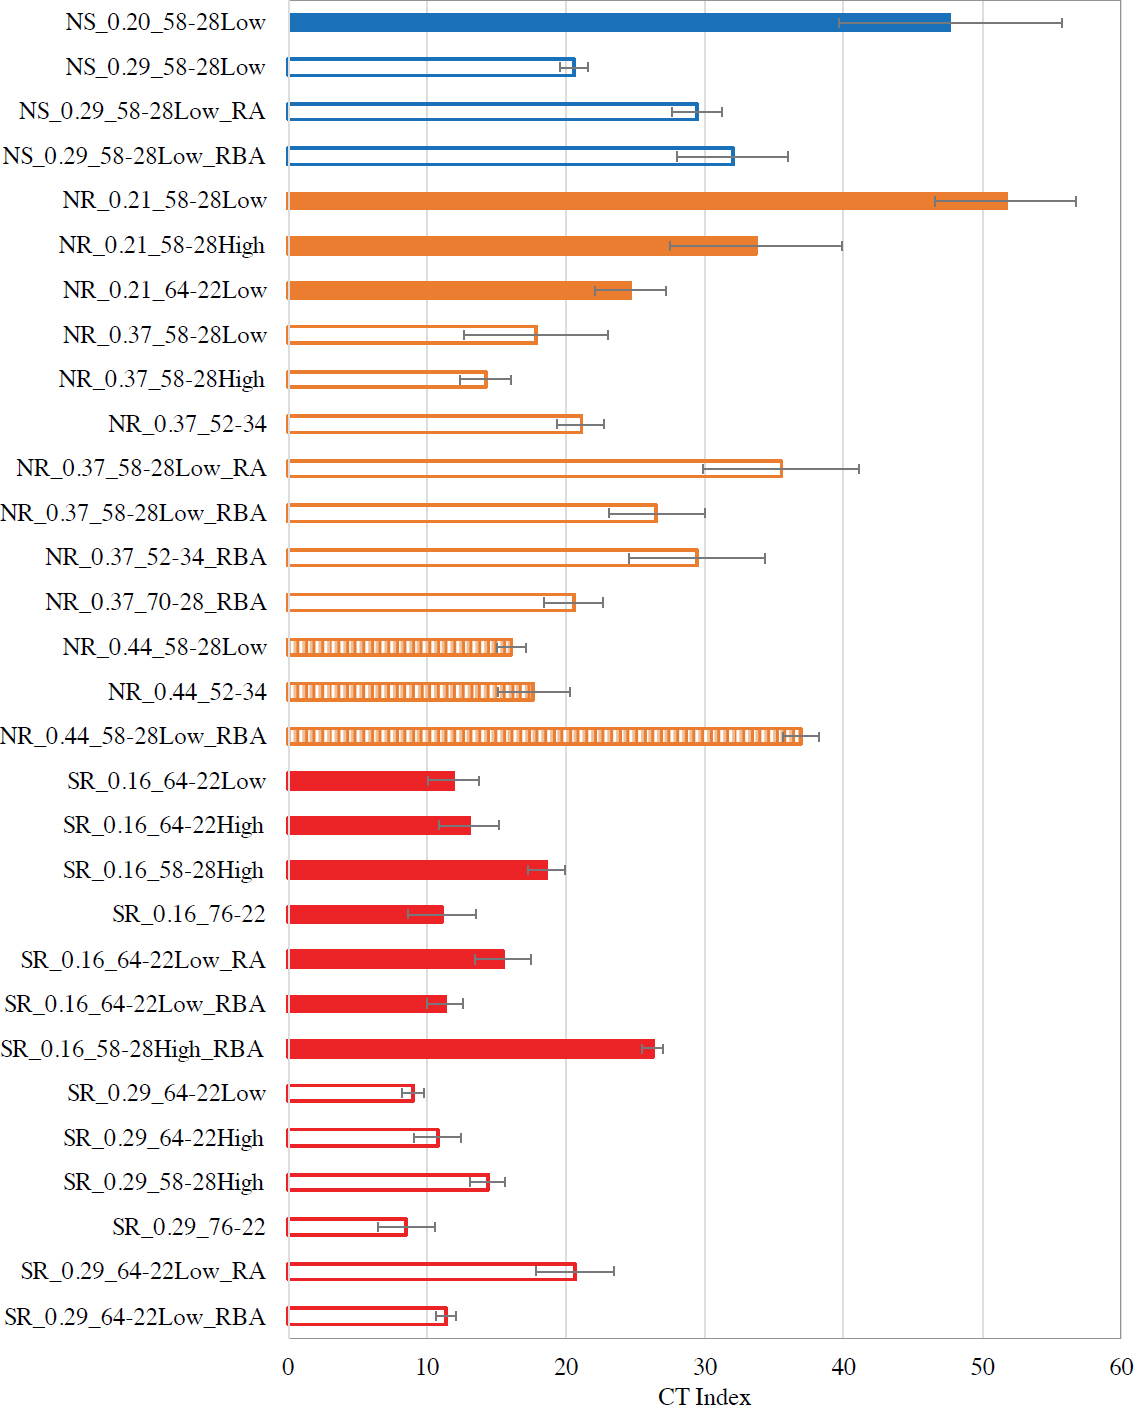
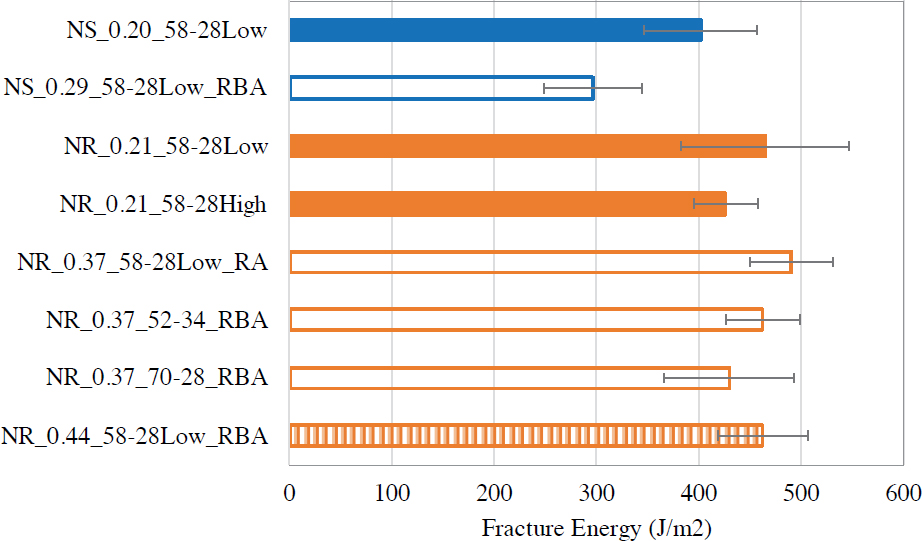
Figure 60 and Figure 61 present intermediate- and low-temperature surface cracking resistance results from the IDEAL-CT and DCT tests across all 30 evaluated mixtures, based on CTIndex and fracture energy Gf, respectively. Figure 60 and Figure 61 include error bars indicating ± one standard deviation from the mean.
As shown in Figure 60, CTIndex decreased as RBR increased for each material combination (i.e., NS mixtures, NR mixtures, and SR mixtures) when high RAM mitigation strategies were not applied. For most of the typical RBR mixtures, the control mixture without strategies passed the preliminary threshold for cracking resistance and therefore did not require a high RAM strategy. An exception was the typical 0.16 RBR SR mixtures with stiff SE1 RAP, for which a high RAM strategy was required.
For high RBR mixtures, the CTIndex was enhanced to meet the preliminary cracking threshold by incorporating a high RAM mitigation strategy. This finding suggests that robust, durable asphalt mixtures can be successfully engineered.
Because the first step in the stepwise approach (Figure 4) was based on intermediate-temperature cracking resistance (CTIndex), low-temperature cracking resistance (DCT fracture energy Gf) was measured only for potentially robust mixtures that passed the preliminary intermediate-temperature
Table 39. Overall comparison across robust (and potentially robust) mixtures and corresponding control mixtures.
| Aggregate | RAM Source | RBR | Virgin Binder Type | High RAM Strategies | Moisture Damage Strategy | Cracking | Rutting/Moisture | Raveling | ||
| IDEAL-CT | DCT Gf (J/m2) | HWT RD (mm) | TSR (%) | Cantabro Ratio | ||||||
| North Resistant | NE RAP | 0.21 | PG 58-28 Low ΔTc = +0.4 | None (Control) | None | 52 | 465 | 3.2 | 72 | NA |
| None (Control) | LAS | 52a | 465a | 3.2a | 86 | 1.73 | ||||
| 0.37 | Recycling Agent @ 4.8% | None | 36 | 491 | 2.5 | 96 | 1.54 | |||
| NE RAP + NE TOAS | 0.44 | Decreased RBA | None | 37 | 462 | 1.9 | 98 | 1.20 | ||
| South Resistant | SE1 RAP | 0.16 | PG 64-22 High ΔTc = −1.4 | None (Control) | None | 12 | 2.8 | 75 | NA | |
| PG 58-28 High ΔTc = +2.0 | Softer + Decreased RBA | None | 26 | 3.4 | 80 | 1.21 | ||||
| 0.29 | PG 64-22 Low ΔTc = −1.4 | Recycling Agent @ 7.0% | None | 21 | 2.7 | 83 | 1.40 | |||
| North Susceptible | MidW RAP | 0.20 | PG 58-28 Low ΔTc = +0.4 | None (Control) | None | 48 | 402 | 3.9 | 89 | |
| 0.29 | Decreased RBA | None | 32 | 297 | 3.2 | 84 | ||||
| MidW RAP + MidW TOAS | 0.33 | None (Control) | LAS | 4.2a | 86 | |||||
| South Susceptible | SE2 RAP | 0.22 | PG 64-22 Low ΔTc = −1.4 | None (Control) | Lime | 2.6 | 85 | |||
| 0.39 | None (Control) | Lime | 2.2 | 90 | ||||||
NOTE: Gray cell indicates combination not evaluated.
aWithout ASA.
cracking threshold. As shown in Figure 61, all but one of the seven potentially robust mixtures passed the preliminary threshold for low-temperature cracking resistance. The other mixture tested with the hybrid PMA+RBA high RAM strategy (NR_0.37_70-28High_RBA) also passed the low-temperature cracking threshold.
Figure 62 provides an IDEAL-CT interaction diagram for the SR mixtures that separates the different parameters needed to calculate CTIndex, represented as contour lines, with the fracture energy Gf on the y-axis and a flexibility ratio (l75/m75) on the x-axis (Yin, Chen, et al. 2023; Yin, West, et al. 2023). The flexibility ratio l75/m75, calculated from the post-peak displacement (l75) and slope of the stress-strain curve (m75) at 75% of the maximum load, represents relative ductile-brittle behavior. An increase in either parameter plotted on the axes of the interaction diagram results in an increase in CTIndex, but the diagram allows for further understanding of how different factors affect each parameter separately and the combined effect on CTIndex.
For the typical 0.16 RBR SR mixtures in Figure 62(a), incorporating a hybrid softer binder + decreased RBA high RAM mitigation strategy yielded a substantial increase in both Gf and l75/m75 over the typical RBR control mixture and resulted in the highest CTIndex among these mixtures. Using a softer virgin binder mitigation strategy alone yielded a slightly lower Gf but a substantially lower l75/m75, resulting in a significantly lower CTIndex than that for the hybrid approach. Similarly, adding an RA also improved l75/m75 but reduced Gf compared with the typical RBR control mixture, which resulted in only a slight improvement in the CTIndex. Mixtures with a PMA or a higher ∆Tc binder exhibited higher Gf but lower l75/m75 compared with the typical RBR control mixture, resulting in only minimal changes in CTIndex.
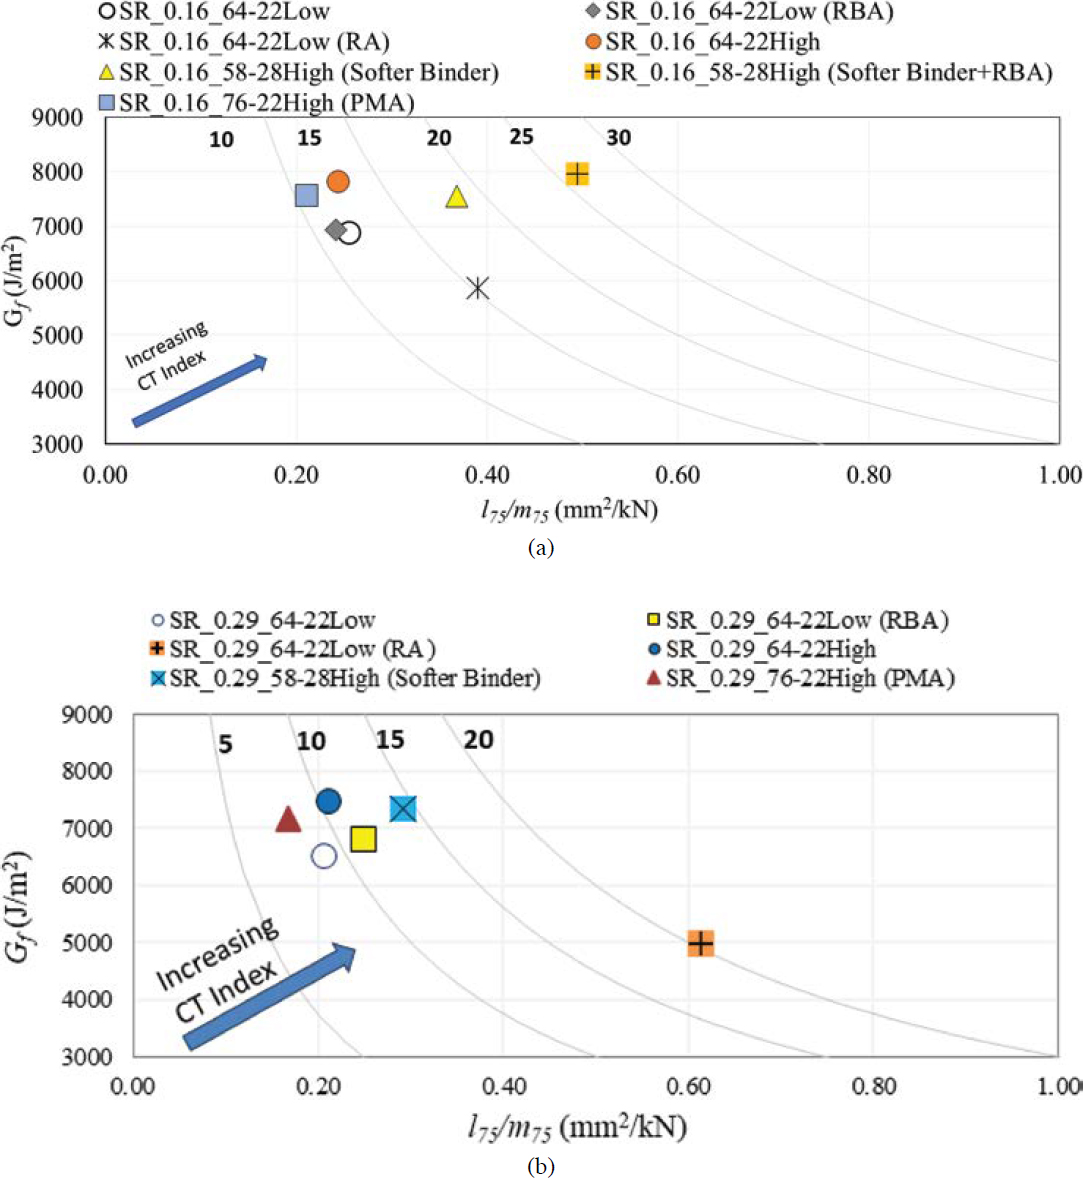
For the high 0.29 RBR SR mixtures in Figure 62(b), the addition of an RA caused a reduction in Gf and a significant increase in l75/m75 (more than three times that of the corresponding control mixture without strategies), which resulted in the highest CTIndex among these mixtures. Other mitigation approaches—such as the higher ∆Tc binder, decreased RBA, and softer virgin binder—slightly increased both Gf and l75/m75 but did not yield significant improvements in CTIndex. Similar to the typical 0.16 RBR SR mixtures, polymer modification resulted in an increase in Gf but a decrease in l75/m75. Because of these offsetting effects, no improvement in the CTIndex was observed.
Overall, the most effective strategies for improving the CTIndex were found to be related to increasing l75/m75 to improve mixture flexibility and ductility rather than increasing Gf to improve mixture toughness.
Figure 63 provides an IDEAL-CT interaction diagram for the NR mixtures. For the typical 0.21 RBR NR mixtures in Figure 63(a), using a higher ∆Tc virgin binder led to a slight increase in Gf but a substantial decrease in l75/m75, which resulted in a significantly lower CTIndex. As expected, the mixture with a stiffer PG 64-22 virgin binder exhibited the lowest l75/m75 among the 0.21 RBR mixtures, resulting in the lowest CTIndex.
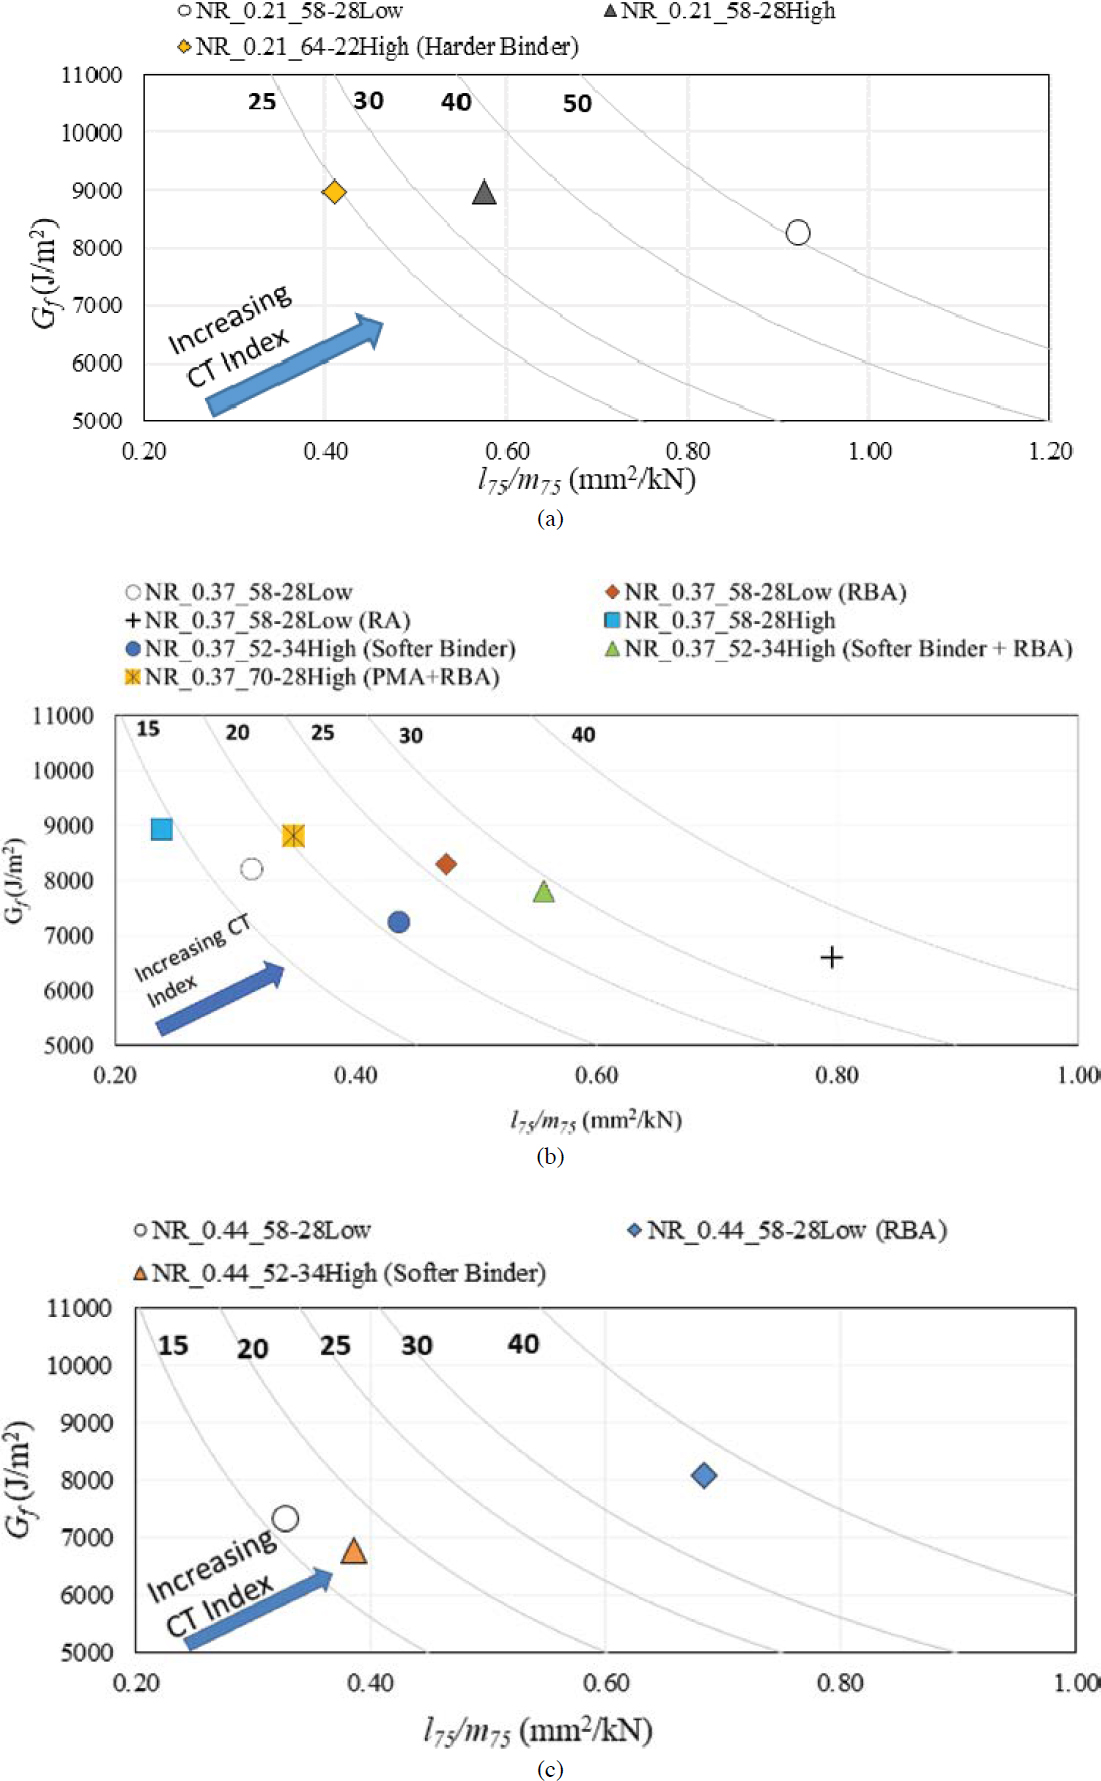
For the high 0.37 RBR NR mixtures in Figure 63(b), all mitigation strategies except for the higher ∆Tc virgin binder resulted in a noticeable increase in l75/m75. Adding an RA resulted in the highest l75/m75, although it significantly decreased Gf. Using a higher ∆Tc virgin binder did not improve either l75/m75 or Gf sufficiently to influence the final CTIndex.
For the high 0.44 RBR RAP/RAS NR mixtures in Figure 63(c), the decreased RBA mitigation strategy was the most effective in improving the CTIndex, with considerable improvements in both Gf and l75/m75. The decreased RBA strategy worked for the high 0.44 RBR RAP/RAS mixture but was not equally as effective for the high 0.37 RBR mixture. For the high 0.44 RBR RAP/RAS mixture, a higher (stiffer) recycled binder content may have increased Gf, and a higher total binder content helped to improve l75/m75, resulting in the highest CTIndex among the high RBR NR mixtures. Conversely, using a softer virgin binder alone in the high 0.37 and the high 0.44 RBR NR mixtures led to an increase in l75/m75 but a decrease in Gf, yielding no significant impact on CTIndex.
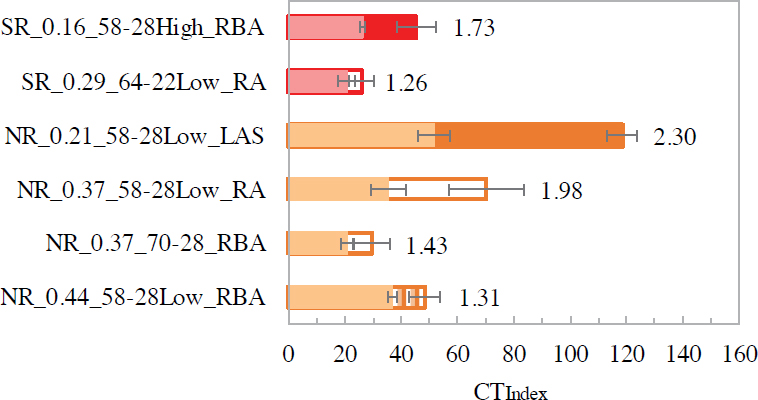
Figure 64 provides intermediate-temperature cracking performance results across the six evaluated robust mixtures, based on CTIndex with combined aging and moisture conditioning and with only critical aging. Figure 64 includes error bars indicating ± one standard deviation from the mean. The results after only critical aging are overlaid in lighter colors, with labels showing the ratio between the result obtained with combined critical aging and moisture conditioning and that obtained with only critical aging. These results indicate an increase in the CTIndex when moisture conditioning is included. Consequently, the resulting ratios are greater than 1, opposite to the TSR results, for which moisture conditioning decreases the parameter of interest (IDT strength or ST).
4.1.2 Rutting and Moisture Susceptibility
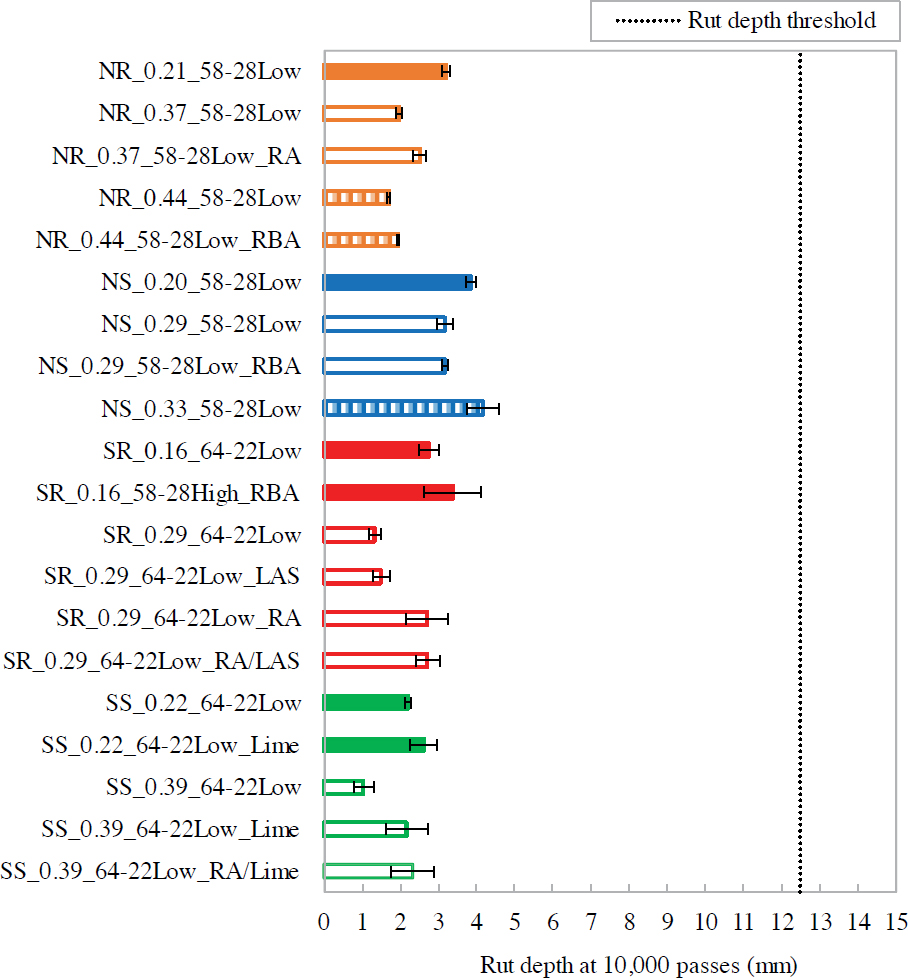
Figure 65, Figure 66, and Figure 67 provide rutting and moisture susceptibility results across all evaluated mixtures, based on HWT rut depth (20 mixtures), TSR (22 mixtures), and wet ST (22 mixtures), respectively. These results are shown with error bars indicating ± one standard deviation from the mean and the wet ST results overlaid in lighter color. Figure 65 shows that all tested mixtures exhibited sufficient rutting performance by HWT, with rut depths significantly below 12.5 mm at 10,000 passes. In general, the NS mixtures exhibited higher rut depths than other mixtures, likely because they contained softer North/Freeze binders, lower RBRs, and softer MidW RAP with a relatively high RAP binder activation by BAF and DoA.
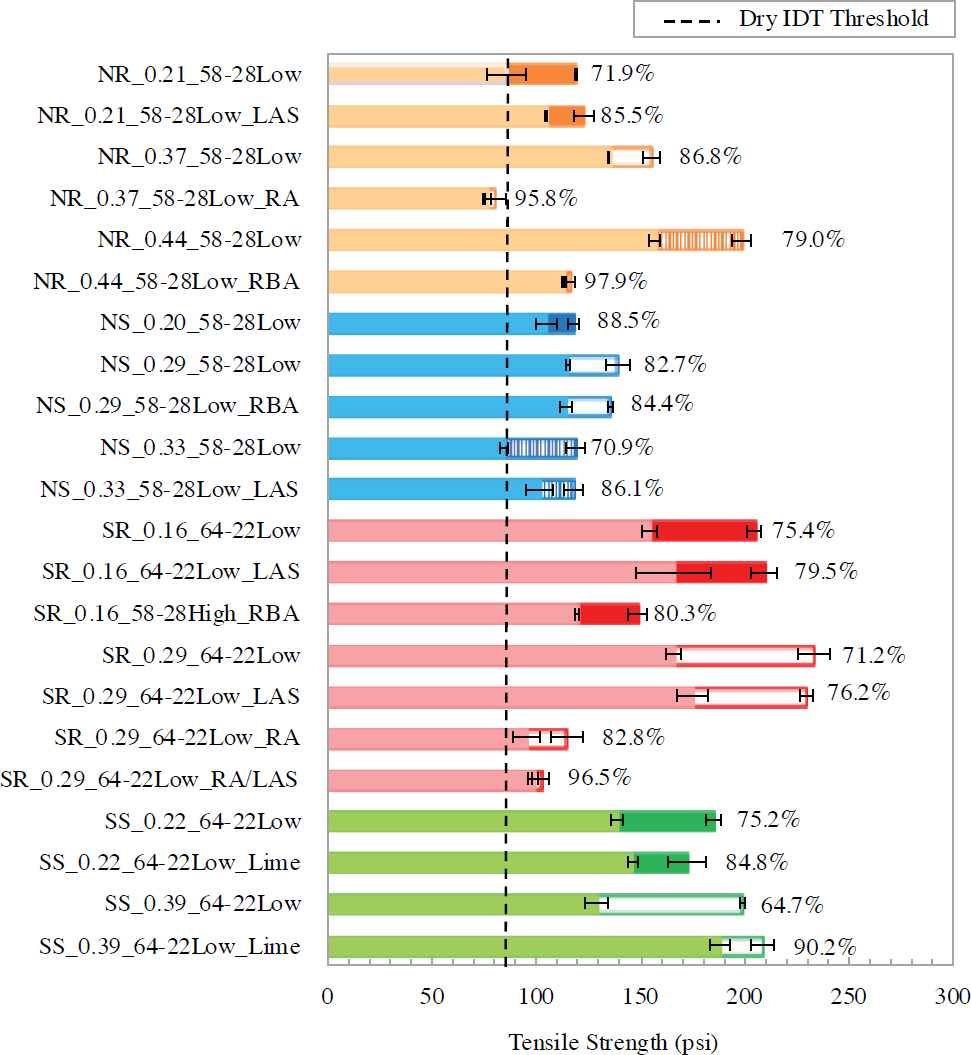
Figure 66 indicates that all but one of the 22 evaluated mixtures passed the dry ST preliminary threshold, and that this mixture (NR_0.37_58-28Low_RA) and two others with RA alone or in combination with an LAS agent showed that this high RAM strategy resulted in decreased dry ST and
wet ST. Figure 66 also shows that ASA was needed for only four of the robust mixtures (Table 39): two, as expected, with lime required in the SS mixtures and one with LAS required in the RAP/RAS NS mixture; the fourth mixture that required ASA (NR_0.21_58-28Low) was produced based on a mix design that included a WMA additive that also has some anti-stripping properties.
Figure 68 shows an interaction diagram for TSR and wet ST for all 22 evaluated mixtures, with T indicating a typical RBR mixture and H indicating a high RBR mixture. A draft threshold of 100 psi for wet ST is also shown based on an SHA from which the project obtained contractor mix designs. These results also highlight the improvements in both parameters after adding an LAS agent or lime and the effect of RA in decreasing wet ST. Figure 69 further examines these moisture parameters across all 22 evaluated mixtures with respect to the DoA of the RAP source. These results indicate that the ASA moisture damage strategies may be more effective with respect to TSR in mixtures with high RAP DoA, as for the NS, NR, and SS mixtures. Figure 70 further explores the effect of binder content on TSR, both Pb and Pbe, when both aggregate-specific gravities were available (Gsb and Gse). Total binder contents were lower by approximately 0.7% in the NS and SS mixtures than in the NR and SR mixtures, with a somewhat negative effect on TSR. Lower effective binder contents by approximately 0.5% were calculated for the NS mixtures as compared with those in the NR and SR mixtures.
Additional moisture susceptibility evaluation was conducted to identify the influence of the component materials on TSR. Figure 71(a) presents the interaction diagram that combines the effect of binder quantity and quality parameters on TSR for all typical and high RBR control mixtures that require a high RAM strategy to improve cracking performance. The selected binder quantity and quality parameters correspond to Pb and estimated PGH. The PGH values were
estimated using linear blending charts for blends without recycling agents or information from the RA supplier. The results show that binder quantity and quality parameters both influence mixture moisture susceptibility. Mixtures with Pb/blend PGH ratios greater than 7.5 produced passing TSR values and fell within the upper right quadrant (green area), except for the SR mixture with typical RBR (SR_0.16_64-22Low) discussed subsequently. In Figure 71(b), the influence of these parameters on enhancing moisture resistance is more evident when mixtures implementing high RAM strategies to improve cracking performance are examined. These strategies led to higher total binder contents through decreased RBA or lower blend PGH values with the incorporation of softer binders or RAs, resulting in increased Pb/blend PGH ratios and improved TSR. This finding indicates that the high RAM strategies initially employed to improve cracking resistance did not create additional moisture susceptibility issues while having positive effects on moisture resistance.
Figure 72(a) presents the TSR results for mixtures without high RAM strategies, including the NR and NS mixtures with typical RBR (NR_0.21_58-28Low and NS_0.20_58-28Low), which did not require a high RAM strategy to enhance cracking performance. The figure also includes the NS mixture with high RAP/RAS RBR (NS_0.33_58-28Low) and SS mixtures with typical and high RBR (SS_0.22_64-22Low, SS_0.39_64-22Low), evaluated only for moisture susceptibility according to the experimental plan. Most of these mixtures were fabricated with a moisture-susceptible aggregate source (e.g., NS, SS) and required an ASA, such as LAS or lime, to meet the TSR threshold, except for the NS_0.20_58-28Low mixture. The NR_0.21_58-28Low mixture, fabricated with a moisture-resistant aggregate, also required ASA, possibly because its original mix design formulation included a WMA additive with anti-stripping properties.
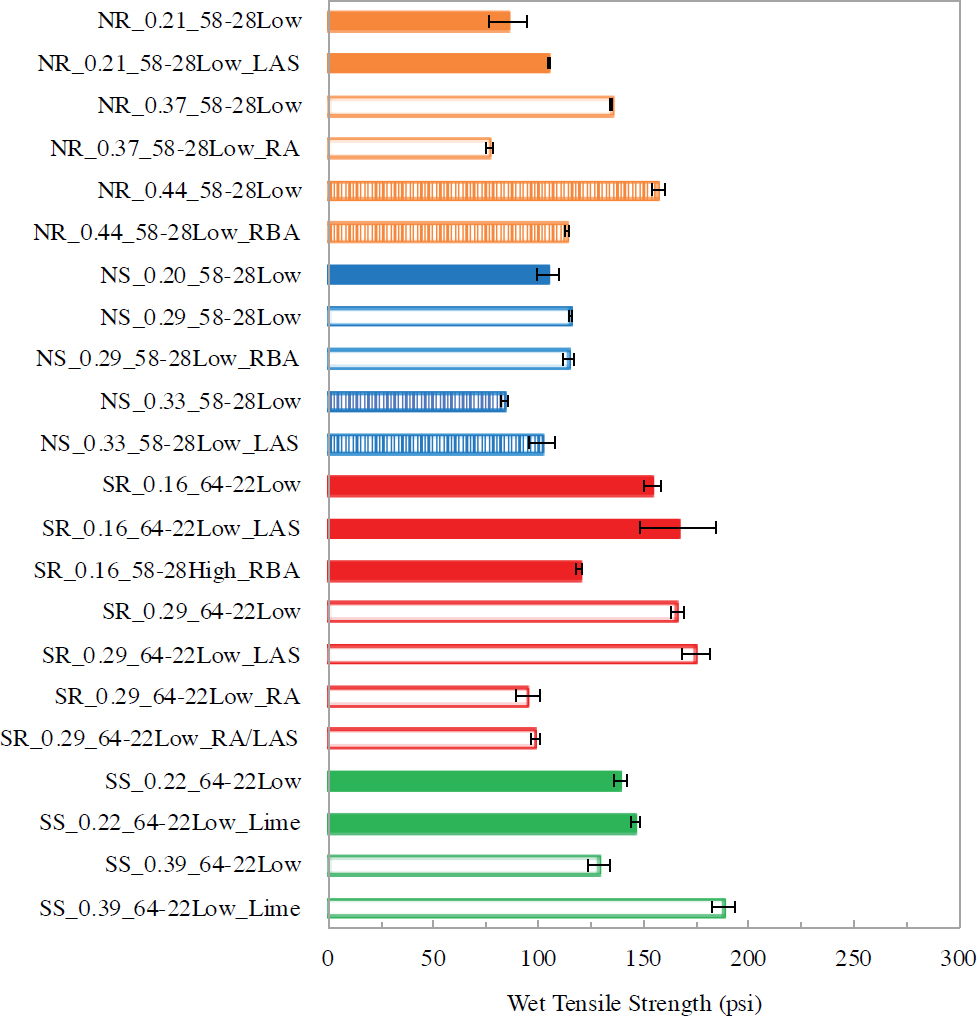
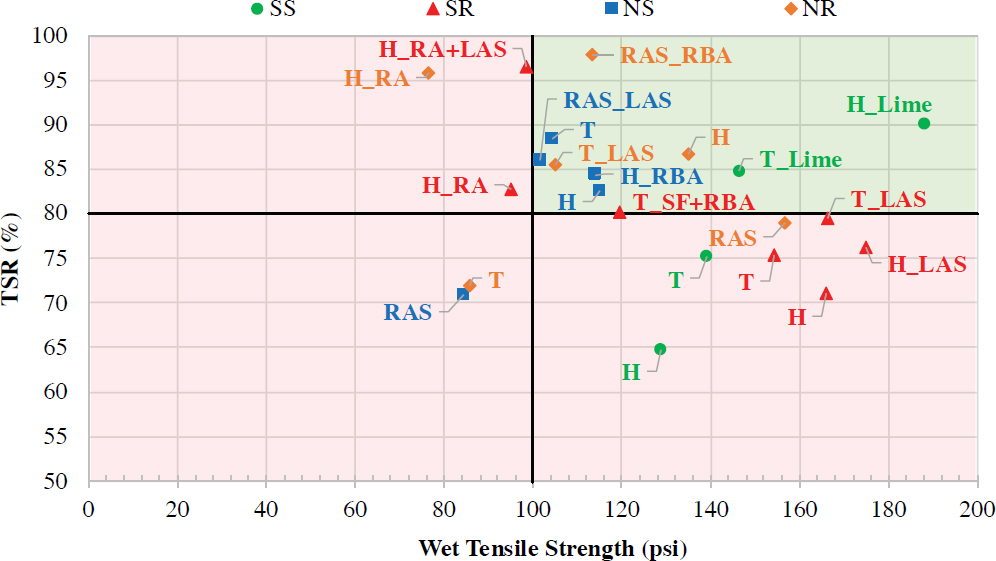
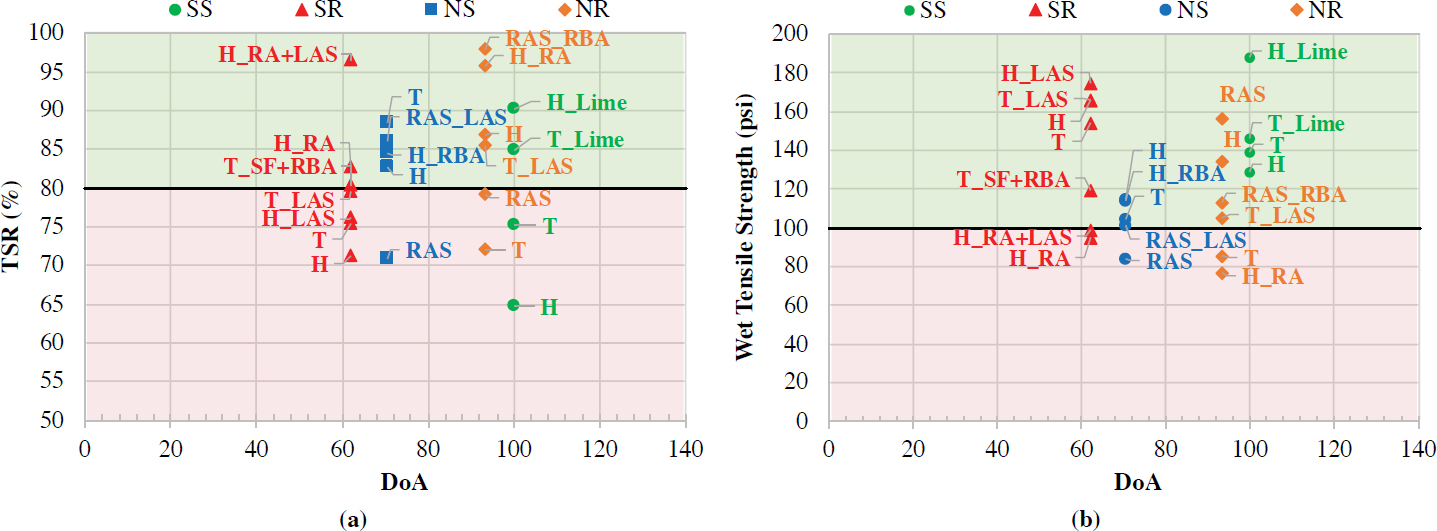
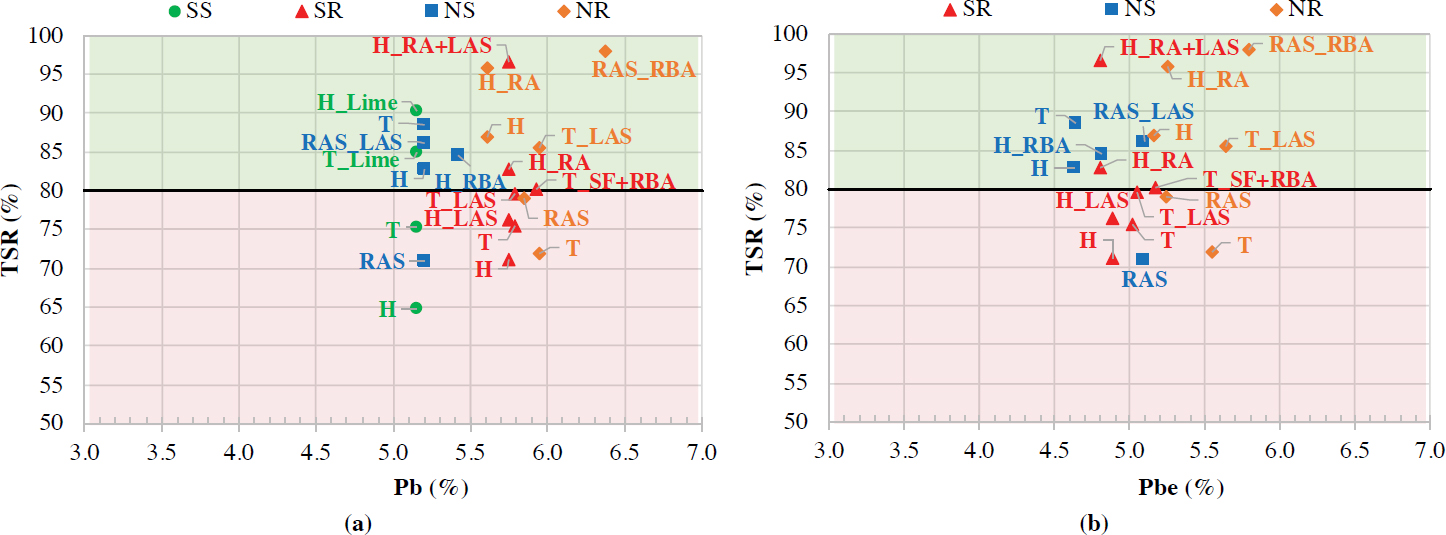
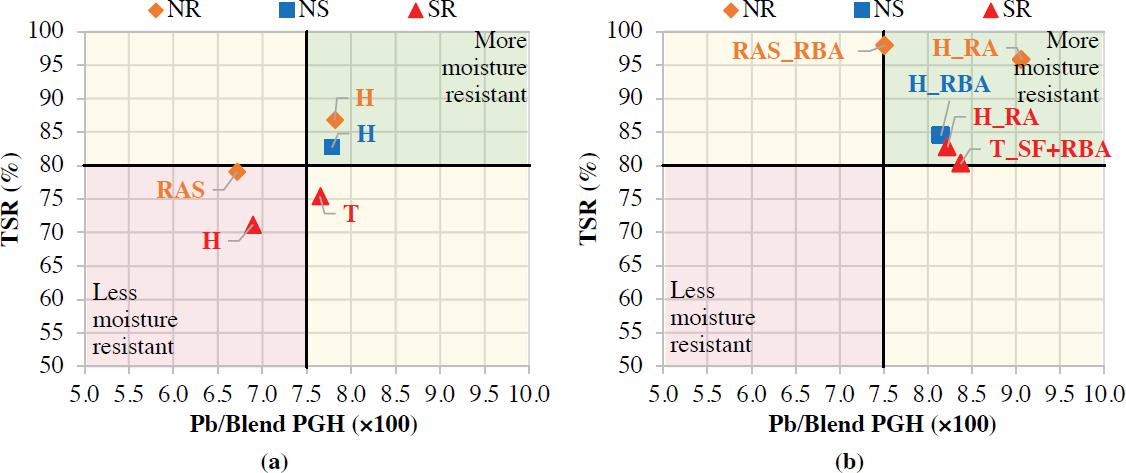
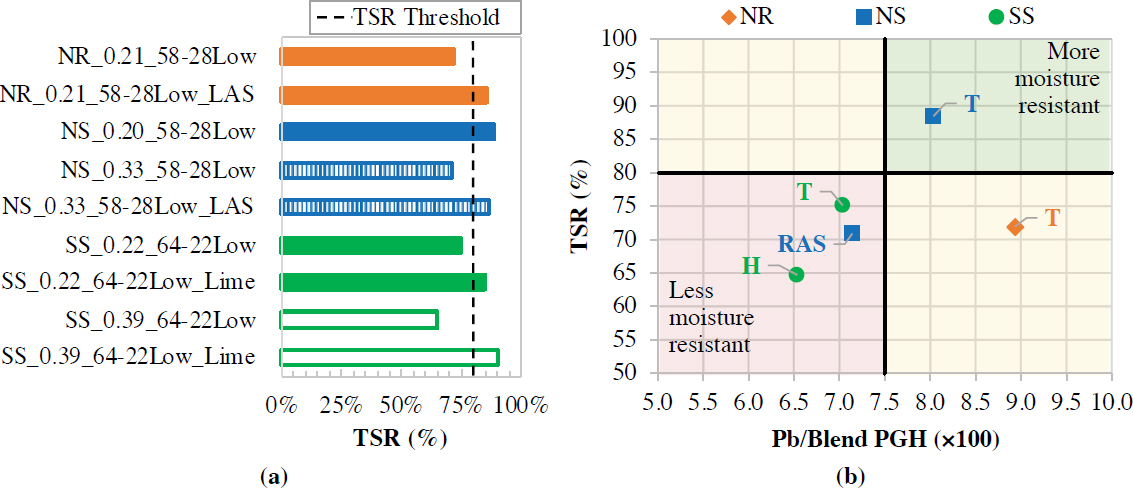
Figure 72(b) presents the interaction diagram that relates the TSR and Pb/blend PGH ratios of these mixtures. The results agree that mixtures with Pb/blend PGH ratios below 7.5 failed TSR, falling within the lower left quadrant (red area). Additionally, similar to the result exhibited by the SR mixture with typical RBR mentioned previously (SR_0.16_64-22Low), the NR mixture with typical RBR (NR_0.21_58-28Low) also failed TSR, despite exhibiting a Pb/blend PGH ratio greater than 7.5 and falling within the lower right quadrant (yellow area).
As previously indicated, further analysis was conducted to identify the factors contributing to low TSR results in the SR and NR mixtures with typical RBR (SR_0.16_64-22Low and NR_0.21_5828Low) exhibiting Pb/blend PGH ratios greater than 7.5. The product of each aggregate proportion (Blend%) and its water AC across all stockpiles was obtained for each mixture. The maximum product was chosen to represent the interaction between the selected aggregate sources and proportions in each mix design and evaluate its influence on moisture resistance. The results for the group of mixtures requiring a high RAM strategy to improve cracking are presented in Figure 73(a) and those without high RAM strategies are shown in Figure 73(b).
The results show that mixtures failing TSR results (i.e., falling within the lower right quadrant or red area) corresponded to those including an aggregate stockpile with a moderate AC
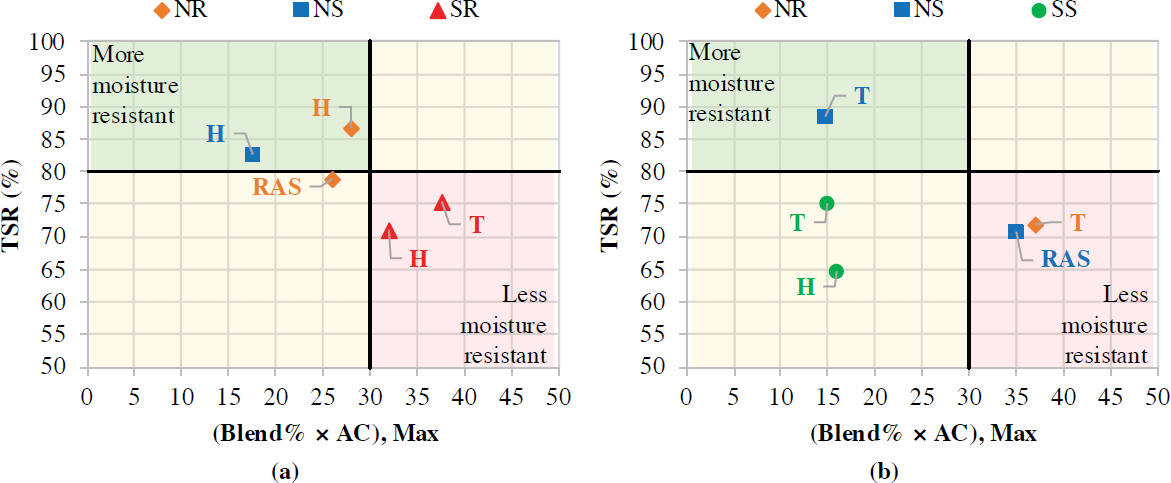
(equal to 1.0) that represented more than 30% of the total aggregate blend, also expressed as those with a maximum product of aggregate proportion and AC greater than or equal to 30. The SR and NR mixtures with typical RBR (SR_0.16_64-22Low and NR_0.21_58-28Low), which previously exhibited acceptable Pb/blend PGH ratios but failed TSR, showed products higher than 30, indicating that their moisture resistance was likely influenced by the selected aggregate sources and proportions. The SS mixtures with typical and high RBR (SS_0.22_64-22Low and SS_0.39_64-22Low) exhibited products lower than 30 but failed TSR, likely because of the lowest binder quantity and quality ratios, as shown in Figure 72(b). As expected, mixtures failing both criteria resulted in failed TSR, as evidenced in both the SR mixture with high RBR (SR_0.29_64-22Low) and the NS mixture with high RAP/RAS RBR (NS_0.33_58-28Low). Thus, the results highlight that both criteria are necessary for achieving acceptable moisture resistance.
To summarize, mixtures meeting the binder quantity and quality criteria might fail TSR if influenced by aggregate proportion and AC, as observed in the SR and NR mixtures with typical RBR (SR_0.16_64-22Low and NR_0.21_58-28Low). Similarly, mixtures meeting the criteria for aggregate proportion and AC could fail TSR if their Pb/blend PG ratio was not greater than 7.5, as observed in the SS mixtures with typical and high RBR (SS_0.22_64-22Low and SS_0.39_64-22Low). Thus, the comprehensive analysis of all mixtures identified that the component material factors influencing acceptable moisture resistance include the aggregate proportion and AC, along with the total binder quantity and quality ratios.
4.1.3 Raveling Resistance
Figure 74 provides raveling results across all six robust mixtures evaluated based on Cantabro testing. These results are shown with error bars indicating ± one standard deviation from the mean, and the results without combined conditioning are overlaid in lighter color. Figure 74 indicates that all six mixtures evaluated passed both the %AL criteria after STOA and the %AL ratio of abrasion loss after and before combined critical aging and moisture conditioning.
The results indicate that mixtures incorporating high RAM or moisture strategies for improved cracking or moisture resistance also demonstrate satisfactory resistance to disintegration in the Cantabro test from the combined effects of aging and moisture. Mixtures using high RAM strategies showed greater benefits, as evidenced by the lowest %AL ratios, notably observed in the typical 0.16 RBR SR mixture with a hybrid softer + decreased RBA strategy (SR_0.16_58-28Low_RBA) and the high 0.44 RBR RAP/RAS NR mixture with decreased RBA (NR_0.44_58-28Low_RBA). Conversely, the typical 0.21 RBR NR mixture with only LAS as a moisture strategy (NR_0.21_ 58-28Low_LAS) exhibited reduced resistance to the combined aging and moisture effects, evident in the highest %AL ratio. This finding suggests that mixtures with high RAM strategies, especially
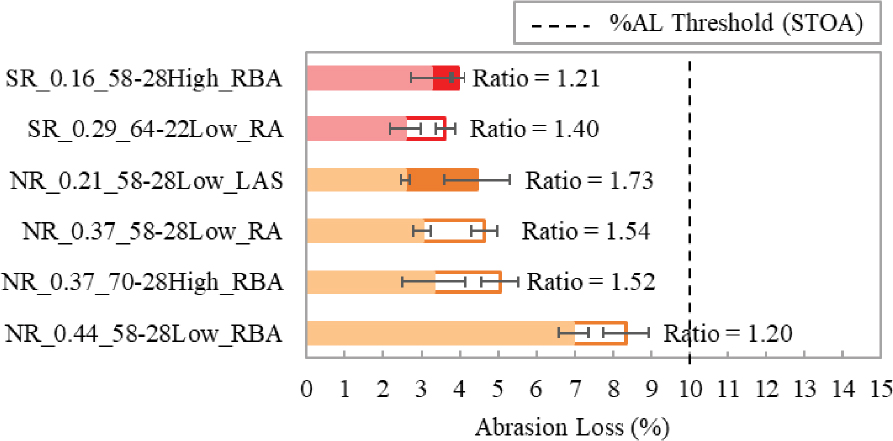
those with additional binder resulting from the decreased RBA strategy, provide better raveling resistance under the effects of combined conditioning.
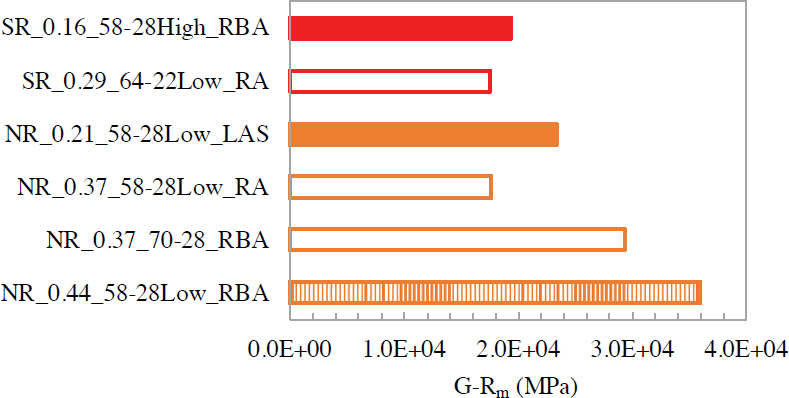
Figure 75 provides additional results across all six robust mixtures evaluated based on the |E∗| results and calculation of G-Rm. In general, the robust NR mixtures exhibited equivalent or larger G-Rm values compared with the robust SR mixtures.
4.2 Mixture Comparison of Cracking Performance Modeling
This section compares the robust NR and SR mixtures in terms of cracking performance modeling by two different approaches.
4.2.1 Cracking Performance Modeling of NR Mixtures
This section presents and discusses the cracking performance modeling results for the four robust NR mixtures (NR_0.21_58-28Low_LAS, NR_0.37_58-28Low_RA, NR_0.37_70-28_RBA, and NR_0.44_58-28Low_RBA).
As described in Section 2.5.3, the CZM performance modeling approach incorporates two key material properties obtained from the two laboratory mixture tests: dynamic modulus and IDEAL-CT. The IDEAL-CT is used to obtain the fracture properties of the mixtures. The fracture properties, more specifically CZM parameters, are obtained through the FEM calibration process of the IDEAL-CT, as exemplified in Figure 76 for the typical 0.21 RBR NR control mixture (NR_0.21_58-28Low_LAS).
Figure 77 depicts the IDEAL-CT model simulation results for each of the four robust NR mixtures (NR_0.21_58-28Low_LAS, NR_0.37_58-28Low_RA, NR_0.44_58-28Low_RBA, and NR_0.37_70-28_RBA) and compares the experimental results with the final calibrated model simulation results. The resultant fracture properties for the nonlinear viscoelastic CZM are presented in Table 40.
The fracture properties obtained from the IDEAL-CT calibration process were then used as input to run a representative pavement model (FHWA’s accelerated loading facility [ALF] pavement), depicted in Figure 12, to predict the fatigue cracking performance of each NR mixture. Because the loading condition and geometry of the pavement are set to be identical among the cases, the resulting pavement performance measures (e.g., fatigue cracking) can demonstrate the effects of each mixture’s properties. Figure 78 presents the predicted cracking performance of each NR mixture in % cracks developed within the critical region of the pavement section. Results indicate
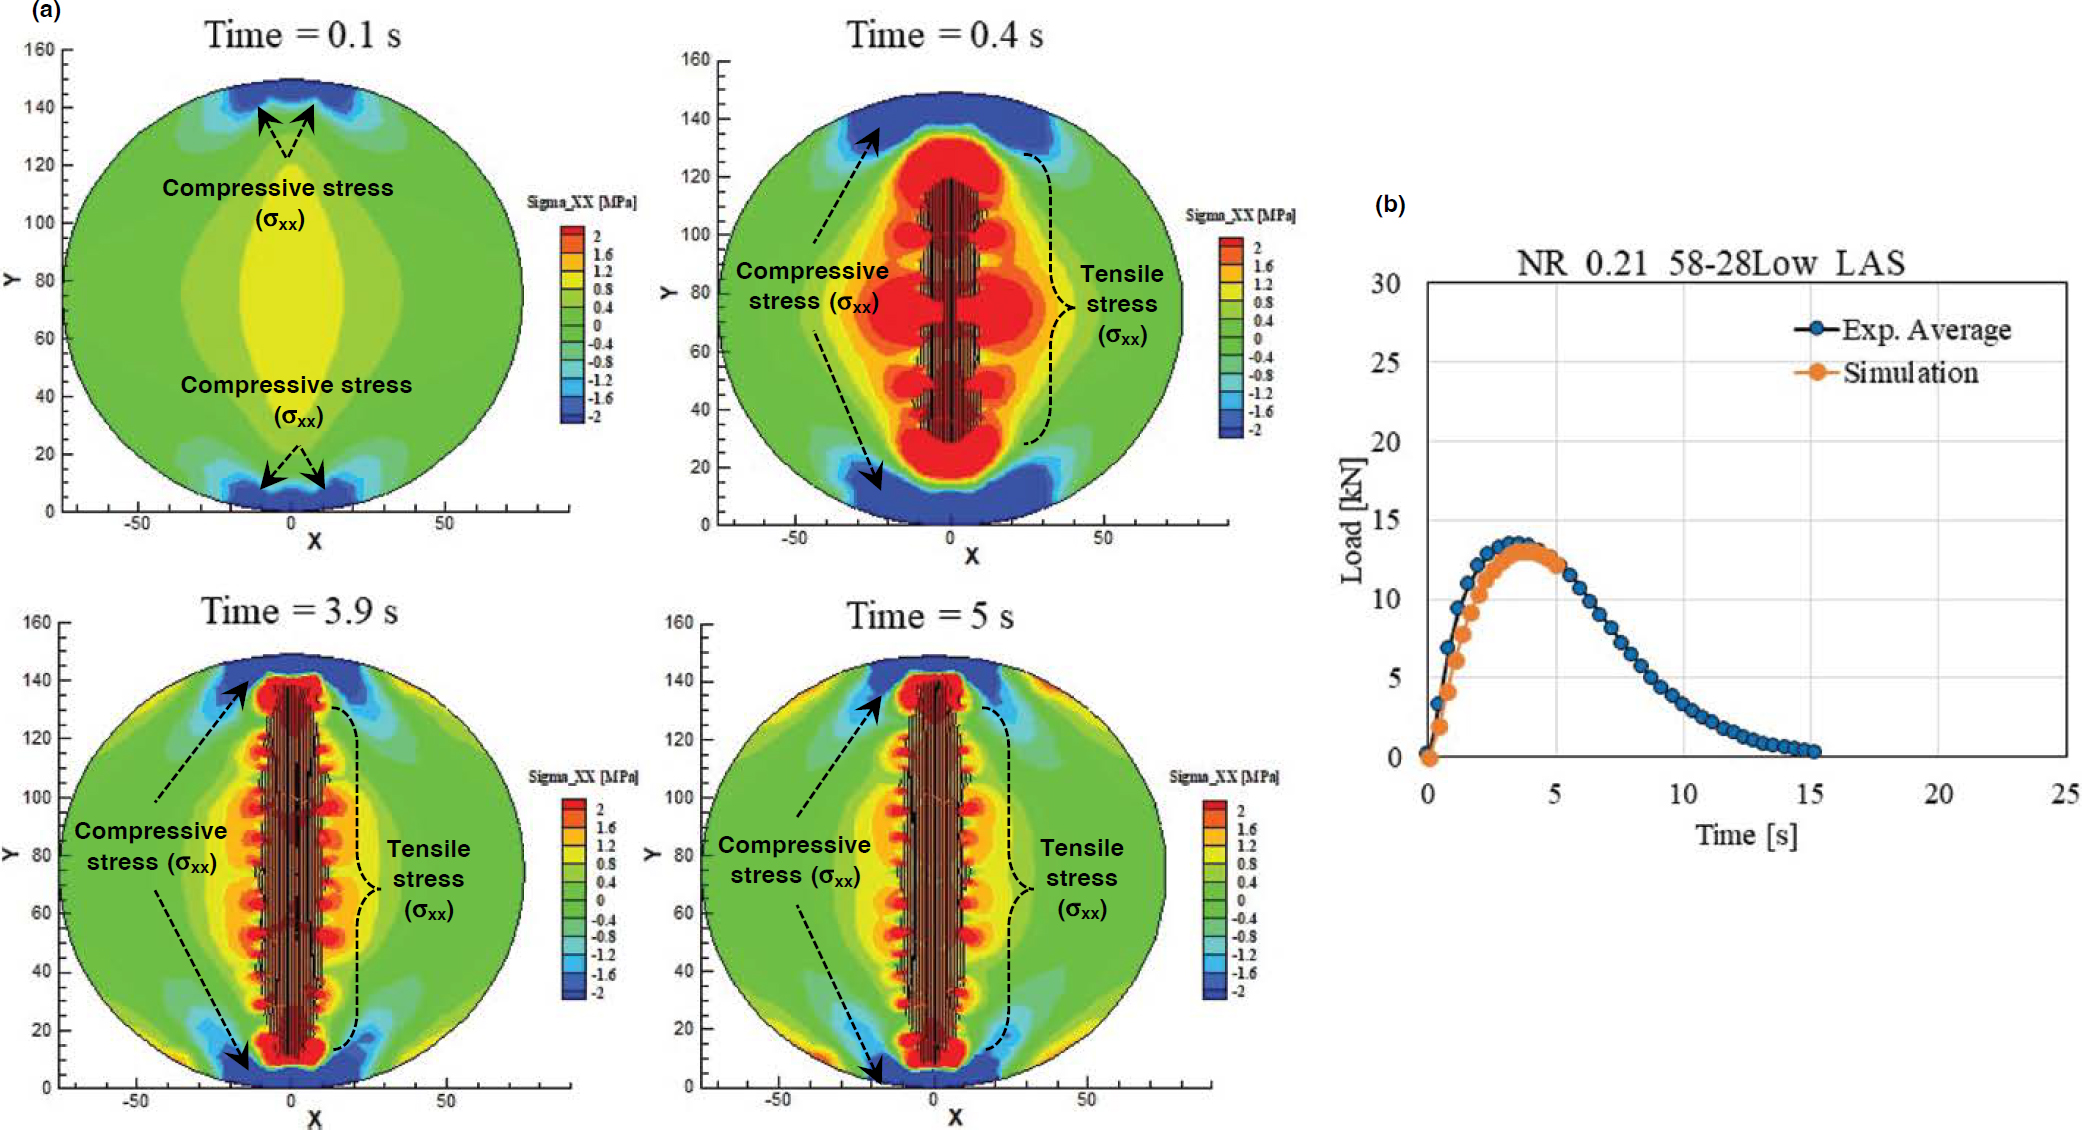
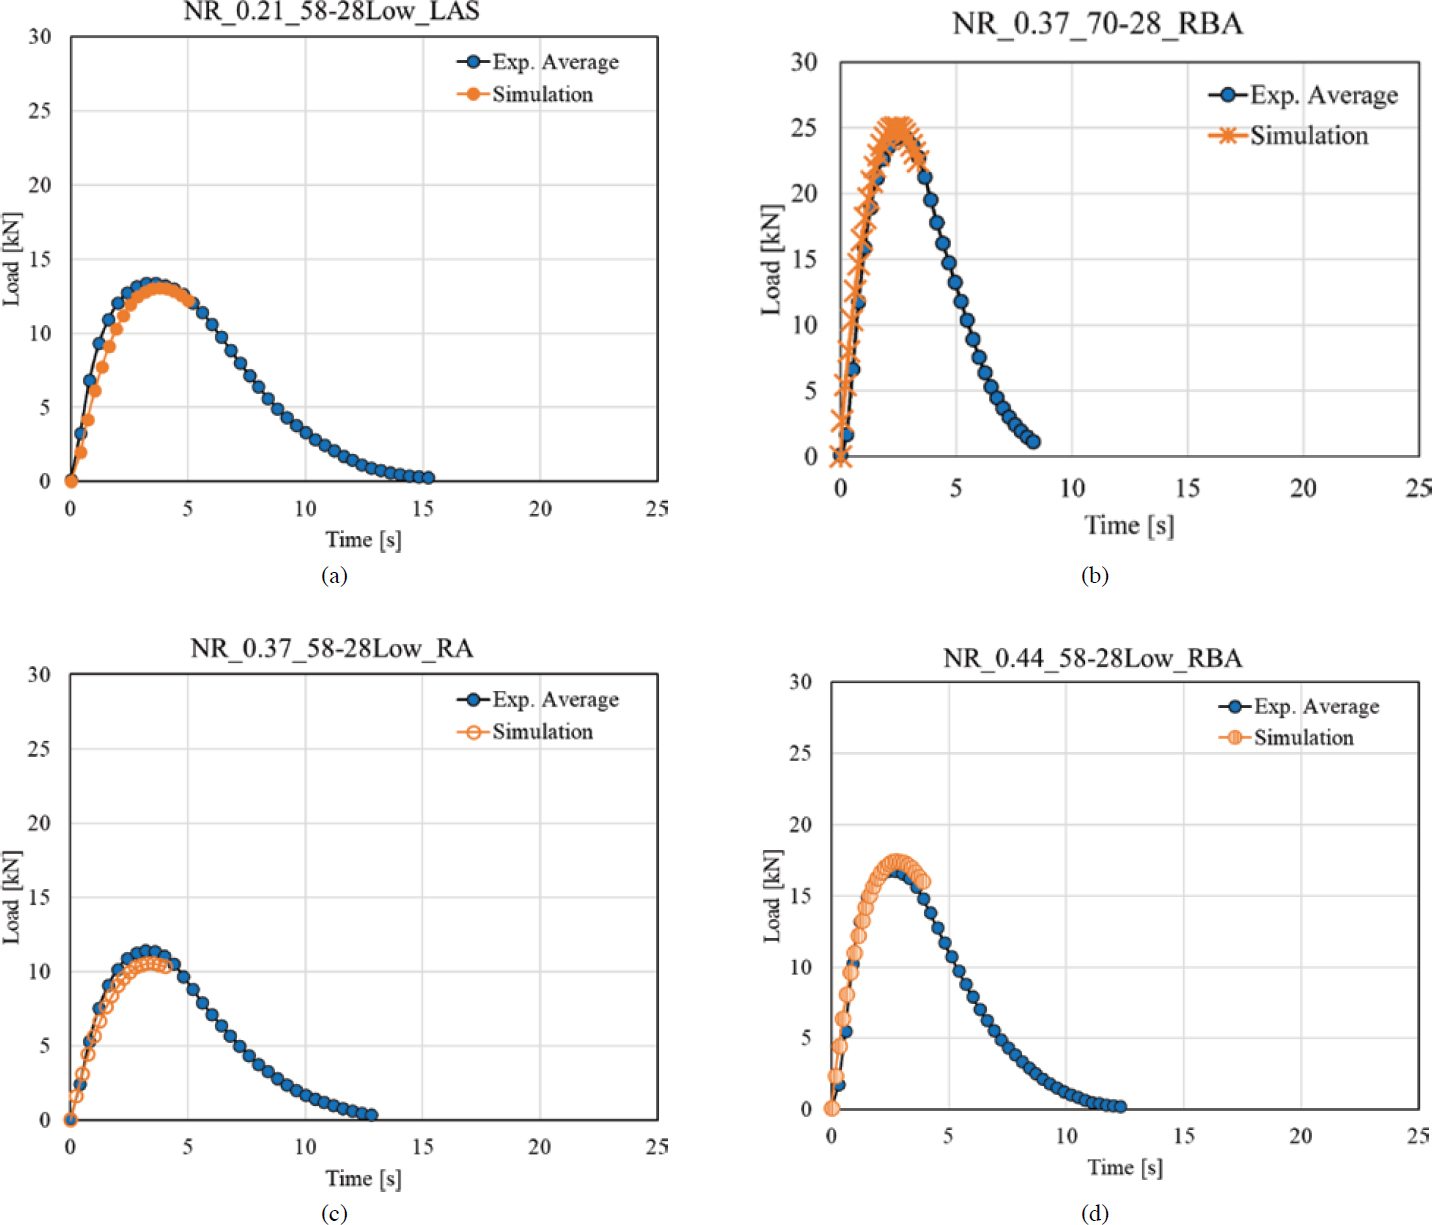
Table 40. Fracture properties of NR mixtures from CZM calibration.
| CZM Parameters | NR Mixture | |||
|---|---|---|---|---|
| 0.21_58-28 (Low_LAS) | 0.37_70-28 (RBA) | 0.37_58-28 (Low_RA) | 0.44_58-28 (Low_RBA) | |
| σn [MPa] | 2.5 | 4.5 | 2.0 | 3.2 |
| δn [m] | 0.020 | 0.015 | 0.018 | 0.015 |
| A | 15 | 25 | 13 | 16 |
| m | 0.9 | 0.7 | 0.9 | 0.8 |

that the high 0.37 RBR NR PMA mixture with decreased RBA provides the best performance, with the least cumulative cracking damage and the largest number of load cycles to crack initiation. In comparison, the typical 0.21 RBR NR control mixture exhibits cracking initiation at a lower number of load cycles and increases in cracking damage at a higher rate than the high RBR NR mixtures using the decreased RBA mitigation strategy. The high 0.37 RBR NR mixture with RA exhibited an early crack initiation, whereas the later crack development trend slowed down, similar to the typical 0.21 RBR NR control mixture. Overall, all mixtures exhibited a % crack less than 5% up to 10,000 loading cycles.
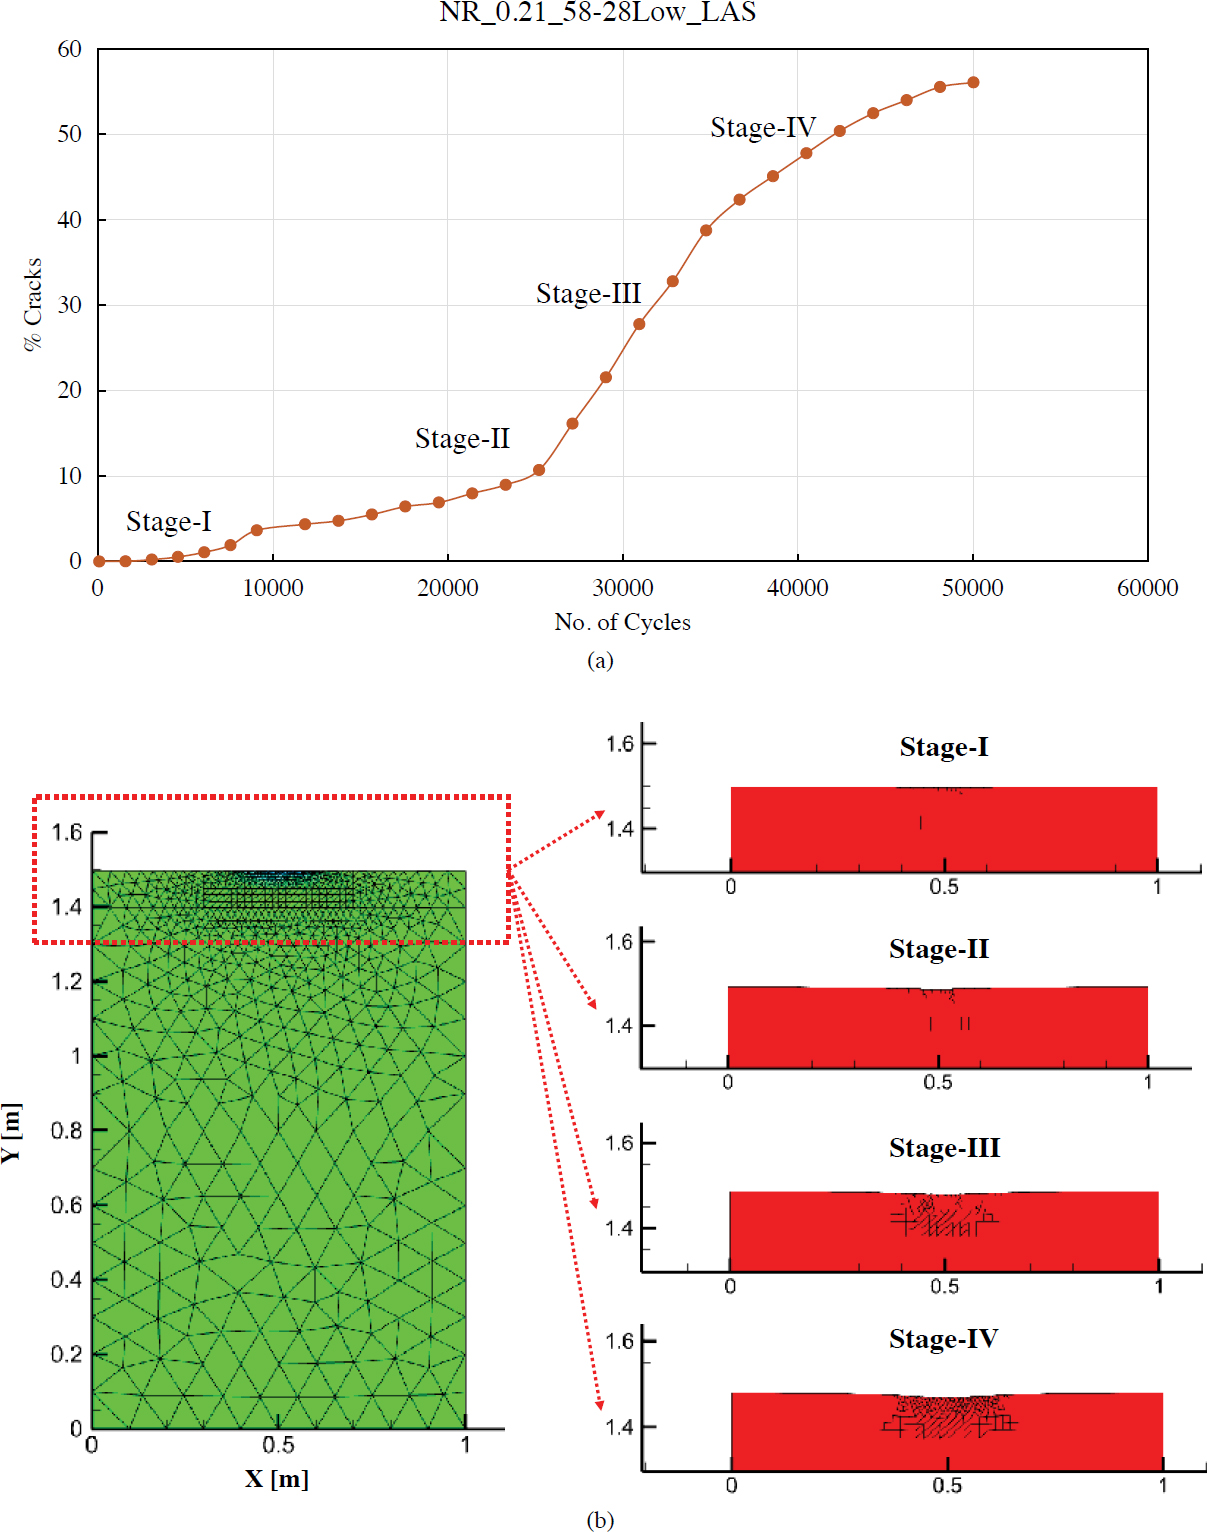
To better evaluate the level of damage up to 10,000 loading cycles, as shown in Figure 78, the model simulation was extended to a longer period of loading cycles for the control case (i.e., NR_0.21_58-28Low_LAS), and Figure 79 presents the results. As shown, the pavement exhibits different crack growth rates. During the early stages of loading cycles (i.e., Stage I and Stage II), fatigue cracking surfaces by both bottom-up and top-down mechanisms, and the total % cracks within the critical zone is about 10% at the end of the initial stages. After these stages, pavement damage evolution accelerates with the coalescence of small cracks within the zone (particularly at the bottom of the asphalt layer), which is sequentially accompanied by slight rutting as shown in the displacement contour plot of Stage III (Figure 79[b]). The damage level reaches about 40% at the end of Stage III. Finally, at Stage IV, the % cracks increases gradually to 50% to 60%, which occurs at around 50,000 loading cycles. Although further investigation of the simulation results is necessary to make any definite conclusions, the long-term damage evolution behavior is S-shaped and considered reasonable, and the 50,000 loading cycles used in this project can be regarded as the number of loading cycles needed for the representative pavement to reach fatigue failure for the example case (NR_0.21_58-28Low_LAS). These findings infer that the predicted performance of all NR mixtures illustrated in Figure 78 is satisfactory because all mixtures presented less than 5% cracks (mostly Stage I), which approximately corresponds to a tenth of fatigue damage to failure at about 20% of loading cycles to the fatigue life. Further evaluation is needed to better assess the respective pavement life and performance behavior.
Using FlexPAVE version 1.1, a structural pavement analysis based on the viscoelastic continuum damage mechanism was also conducted for the four NR mixtures. The analysis was performed based on a single representative pavement structure and traffic level with different asphalt mixtures
used for the surface layer. The analysis focused mainly on fatigue cracking under repeated traffic loadings without further aging of the surface asphalt mixtures or thermal stresses.
The representative structure used was the pavement cross-section of the FHWA ALF, consisting of 100 mm of asphalt and 600 mm of aggregate base (Figure 12). The analysis was conducted for a design life of 10 years with a traffic load of 835 ESALs per day. Loadings were based on a
single axle with a single tire, using a load of 64.4 kN, a tire pressure of 690 kPa, and a design velocity of 4.9 m/s to match the loading applied in the CZM approach.
The data obtained from |E∗| and CF testing were analyzed using FlexMAT to generate inputs for FlexPAVE. FlexPAVE was then used to analyze the four NR mixtures up to the design life. Damage factor spatial distribution contours were obtained from FlexPAVE for all mixtures throughout the asphalt surface layer at the end of the design life, as shown in Figure 80. The typical 0.21 RBR control NR mixture (NR_0.21_58-28_Low_LAS) exhibited some surface cracking damage versus all other robust and PMA NR mixtures with high RAM mitigation strategies.
The cumulative damage evolution over time throughout the pavement structure was also obtained from the FlexPAVE analysis. The results for the NR mixtures are plotted in Figure 81. Among all the NR mixtures, the 0.21 RBR control NR mixture displayed the highest cumulative damage at the end of the design life. Conversely, the high 0.37 RBR NR mixture, which used an RA as a high RAM mitigation strategy, showed the lowest percentage of damage evolution.
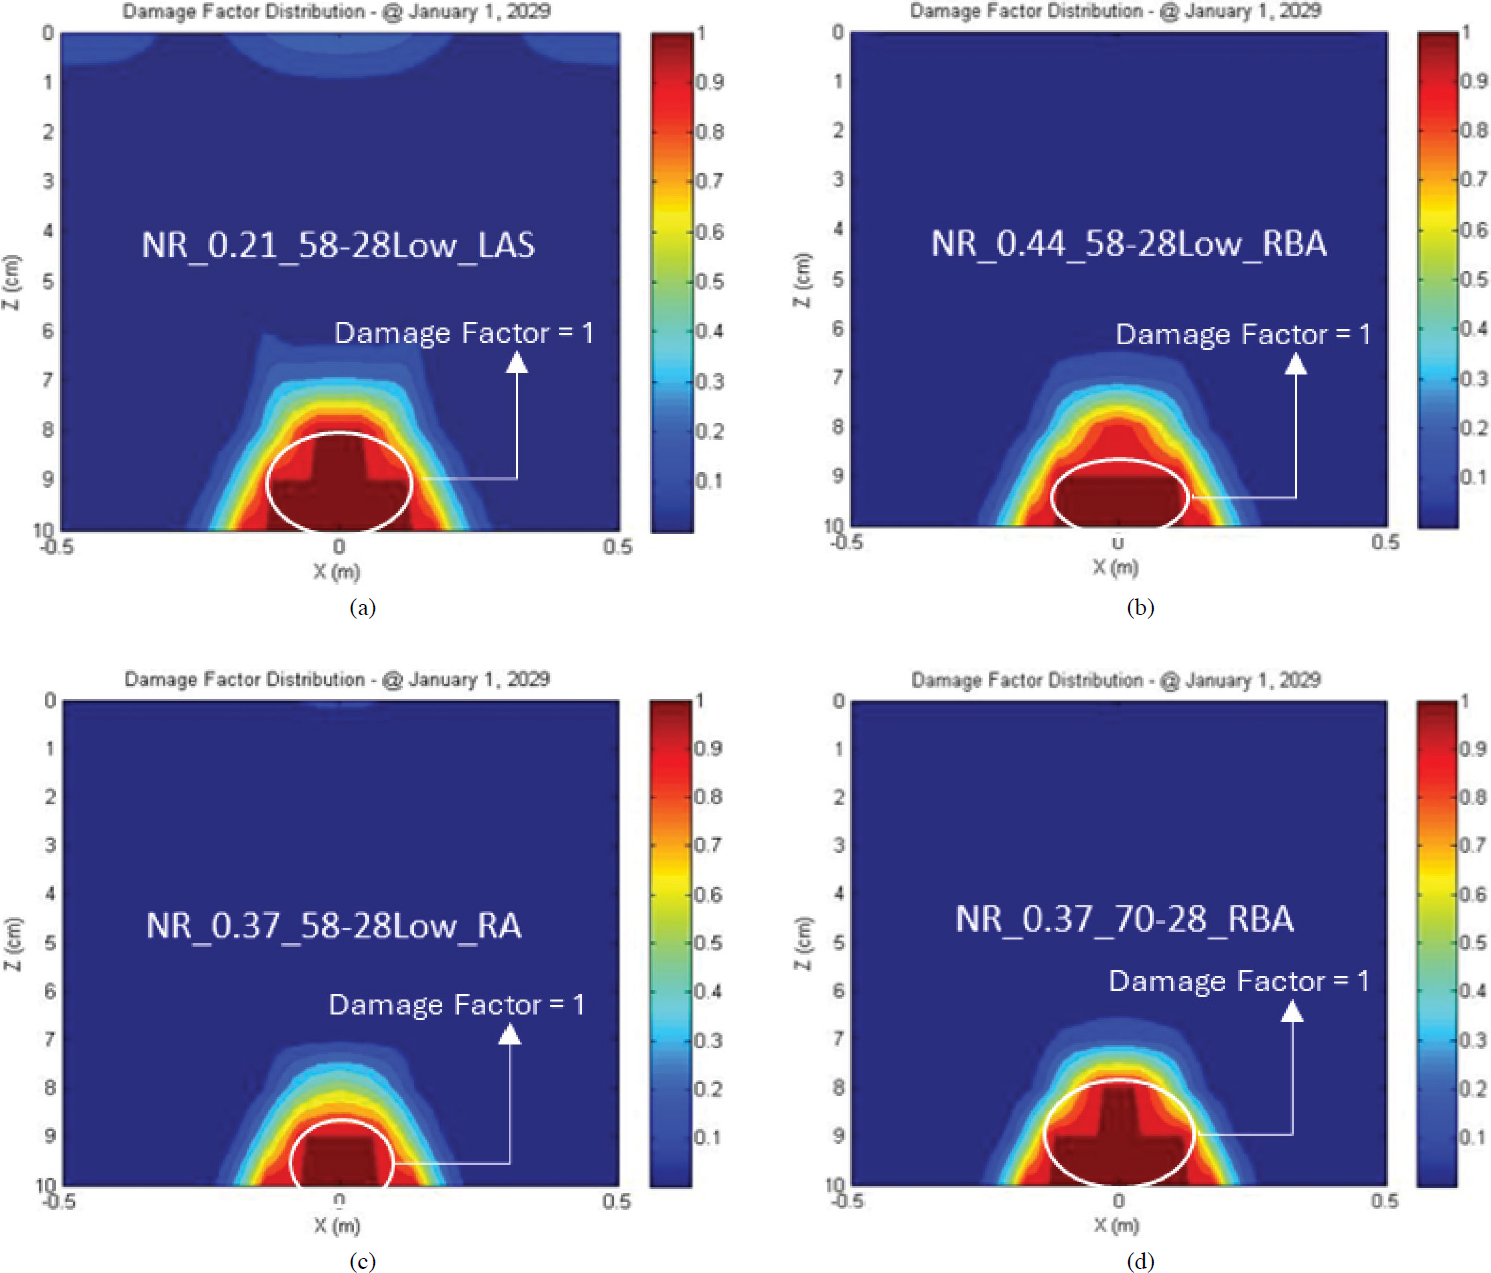
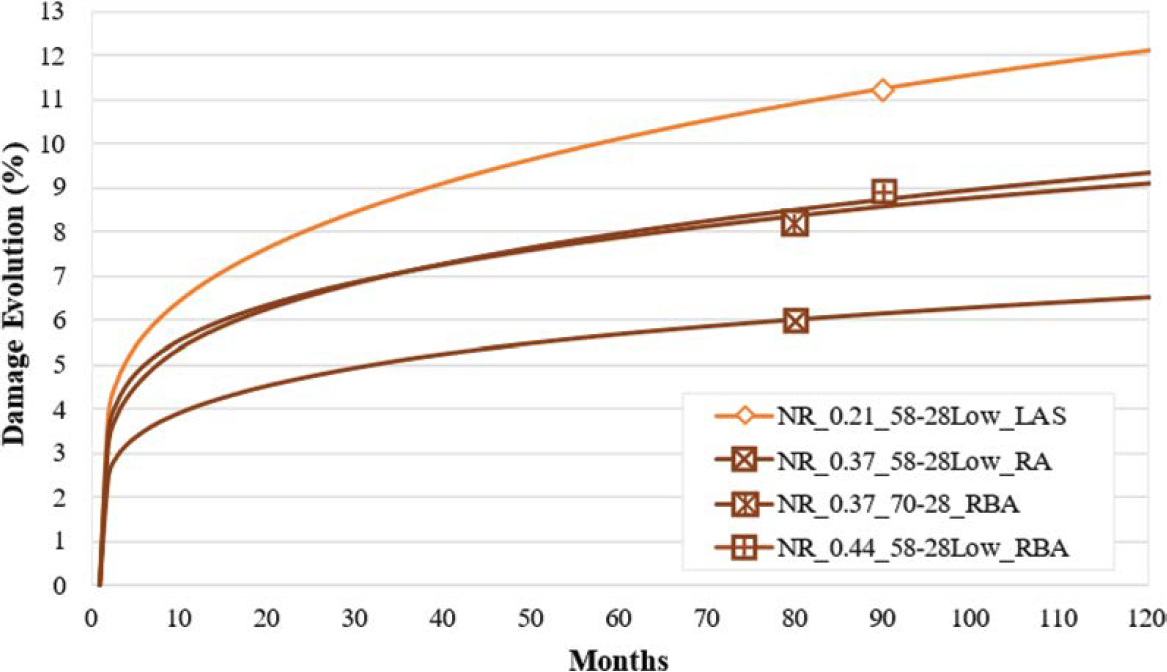
Table 41 compares the FlexMAT and FlexPAVE results for the four NR mixtures. As shown, the two approaches ranked the four mixtures differently.
4.2.2 Cracking Performance Modeling of SR Mixtures
This section presents and discusses the cracking performance modeling results for the two robust SR mixtures (SR_0.16_58-28High_RBA and SR_0.29_64-22Low_RA).
Figure 82 compares the IDEAL-CT model simulation results with the experimental results. The resultant CZM fracture properties, summarized in Table 42, were then used to run the pavement model simulation for cracking performance prediction.
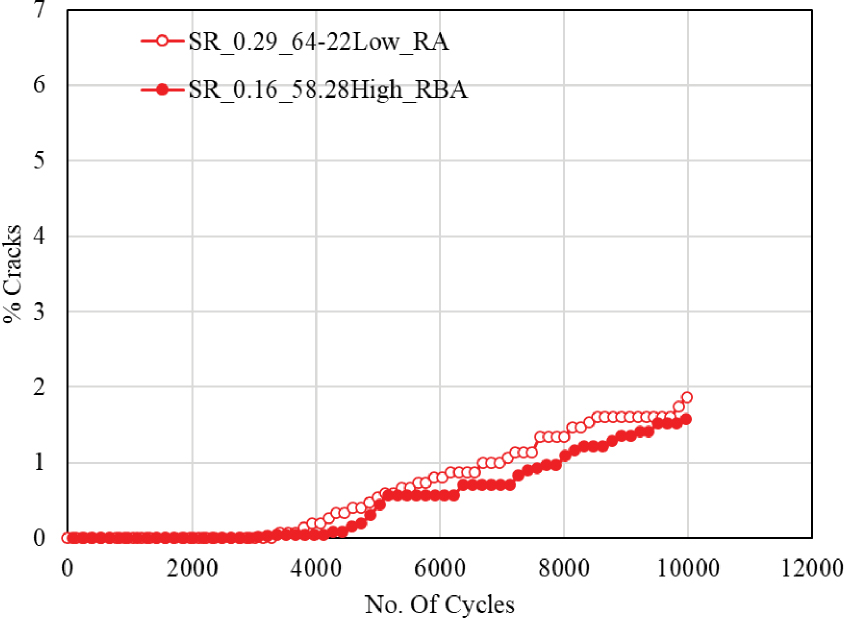
Figure 83 presents the predicted cracking performance of the two SR mixtures in terms of % cracks developed within the critical region of the pavement section. Both mixtures presented a similar performance of less than 2% cracks up to 10,000 loading cycles, considered satisfactory performance as indicated in the previous section for the NR mixtures.
A similar structural pavement analysis was also conducted for two SR mixtures using FlexPAVE version 1.1. Damage factor spatial distribution contours were obtained from FlexPAVE for the two mixtures throughout the asphalt layer at the end of the design life, as shown in Figure 84. The typical SR_0.16_58-28High_RBA mixture showed some surface cracking damage compared with the high RAP mixture with RA.
Table 41. Comparison of FlexMAT and FlexPAVE results for NR mixtures.
| Mixture | Sapp (FlexMAT) | %Damage (FlexPAVE) |
|---|---|---|
| NR_0.21_58-28Low_LAS | 30.8 | 12.1 |
| NR_0.37_58-28Low_RA | 24.5 | 6.5 |
| NR_0.37_70-28_RBA | 19.0 | 9.1 |
| NR_0.44_58-28Low_RBA | 30.9 | 9.3 |
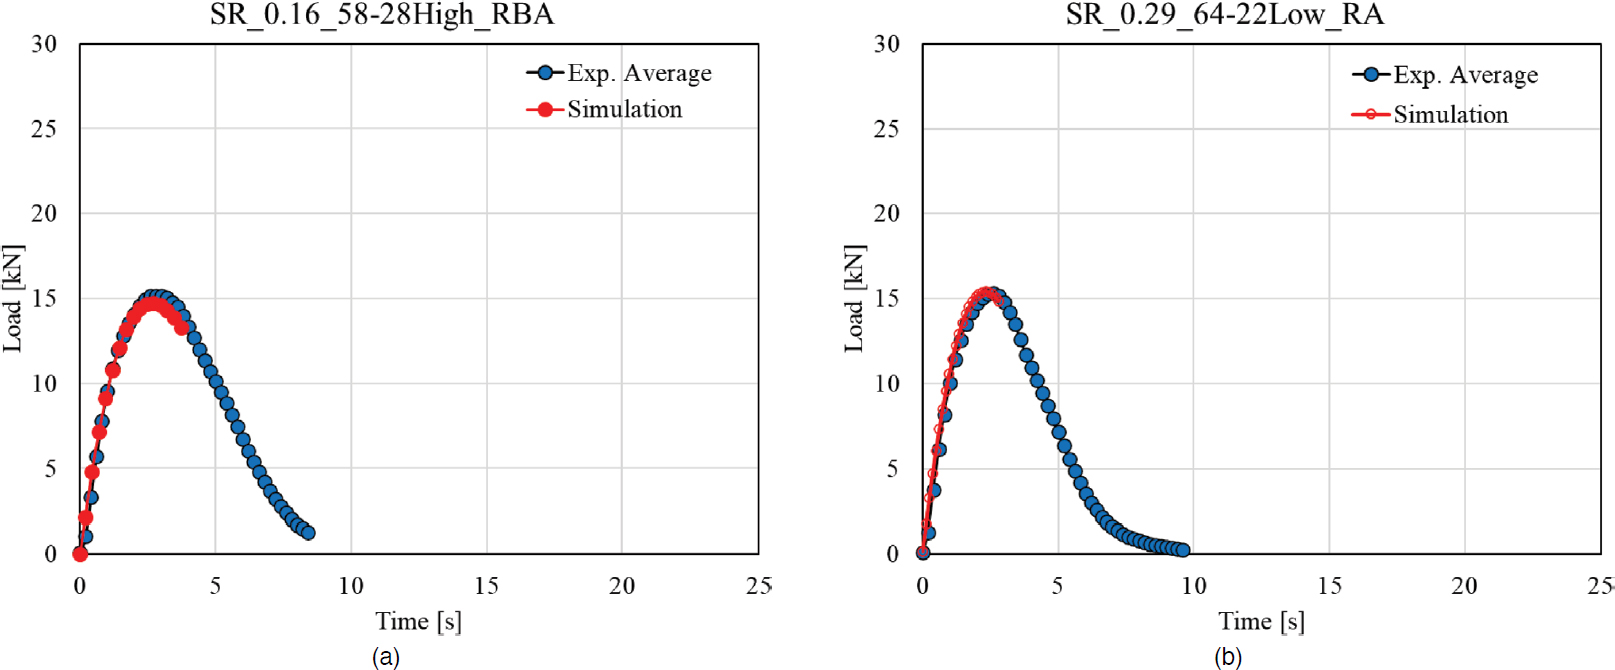
Table 42. Fracture properties of SR mixtures from CZM calibration.
| CZM Parameters | SR Mixture | |
|---|---|---|
| 0.16_58-28 (High_RBA) | 0.29_64-22 (Low_RA) | |
| σn [MPa] | 3.0 | 2.8 |
| δn [m] | 0.015 | 0.013 |
| A | 18 | 18 |
| m | 0.8 | 0.8 |

The cumulative damage evolution throughout the pavement structure with time was also output from the FlexPAVE analysis. The results are plotted in Figure 85. Among the two SR mixtures, even with combination strategies of softer virgin binder and RBA, the lower 0.16 RBR control SR mixture (SR_0.16_58-28High_RBA) had a higher percentage of damage evolution than the high RAP mixture with RA (SR_0.29_64-22Low_RA).
Table 43 shows a comparison of FlexMAT and FlexPAVE results for the two SR mixtures. The two approaches yield consistent results.
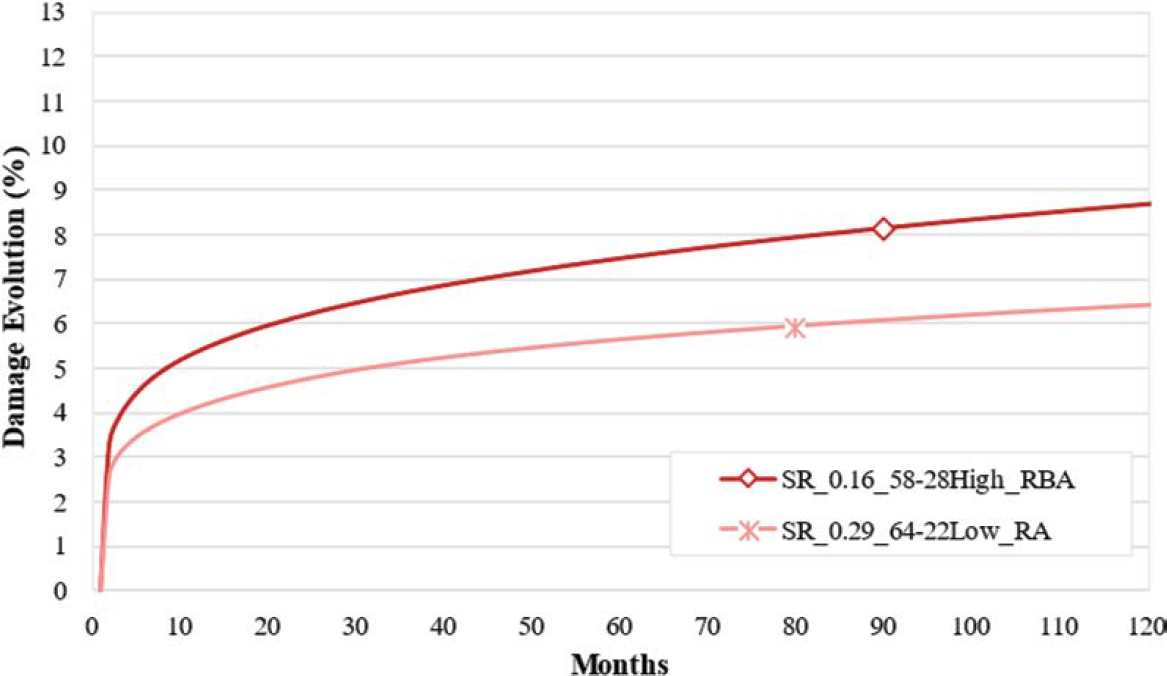
Table 43. Comparison of FlexMAT and FlexPAVE results for SR mixtures.
| Mixture | Sapp (FlexMAT) | %Damage (FlexPAVE) |
|---|---|---|
| SR_0.16_58-28High_RBA | 18.4 | 8.7 |
| SR_0.29_64-22Low_RA | 22.0 | 6.4 |
4.3 Component Materials Screening
Table 9 and Table 10 provide the tools for true performance BMD. However, tests and thresholds or criteria provided for component materials could be used to screen materials and reduce iterative mixture testing efforts, and thus costs and resources. To identify relevant properties, correlations were explored between the properties and proportions of binder blends (virgin and recycled binders and any additives) and virgin binders and corresponding mixture cracking performance in terms of CTIndex. Comparisons across material combinations were explored for the binder blends, and comparisons across a specific mix design were completed to assess the effect of virgin binder. In addition, relationships between RAP binder properties and RAP binder activation parameters DoA and DWT were also evaluated.
Because binder blend properties were not measured in this project, continuous PGH, PGI, and PGL were estimated based on linear blending charts (for blends without recycling agents) or RA dose reports from the material supplier. Other binder properties were not included in the analysis with binder blends because linear superposition may not hold. An initial exploration included separate binder quantity parameters, such as Pb and Pbe, and binder quality parameters, including RBR, PGH, PGI, and PGL. In general, weak relationships were found when each binder quantity and binder quality parameter was considered separately.
Next, correlations between mixture cracking performance and a ratio of total binder content and binder blend continuous PG grade in each temperature range were evaluated, with variable exponents to maximize the coefficient of determination (R2) for each parameter to account for different sensitivities to binder quantity and binder quality. Good correlations were found for the NR, SR, and NS mixtures when the typical 0.20 RBR control mixtures were excluded. This outlier typical 0.20 RBR control NS mixture proved challenging when verifying the mix design, so the relatively high optimum binder content in the job mix formula was used. Table 44 shows the R2 values for CTIndex versus continuous PGH, PGI, and PGL and provides an assessment of the relationship based on ranges in Kaseer et al. (2021). The strength of the correlation (R2) is color coded with green for strong correlation (> 0.8), blue for moderate correlation (0.6–0.8), orange for fair correlation (0.4–0.6), and red for poor correlation (< 0.4). According to this scale, Table 44 indicates that all of the relationships are strong or moderate with PGH, but they vary greatly among different material combinations for PGI with respect to the intermediate-temperature mixture cracking performance after critical aging. This result further validates that rheology (stiffness and embrittlement) plays a key role in mixture cracking performance by CTIndex.
Table 44. Coefficient of determination (R2) for relationships between binder blend properties and CTIndex.
| Material Combination | (Pb Total)X / (Binder Blend Continuous PG)Y | ||
|---|---|---|---|
| PGH | PGI | PGL | |
| North Moisture Resistant | 0.74 | 0.58 | 0.48 |
| South Moisture Resistant | 0.70 | 0.75 | 0.70 |
| North Moisture Susceptible | 0.98 | 0.95 | 0.57 |
A similar analysis was completed across a specific mix design to assess the effect of virgin binder on CTIndex. Additional binder properties were included in the analysis, specifically ΔTc (Table 11); the G-R parameter at multiple different conditions (Table 12, Table 14, Table 19, Table 20, Table 21, Table 22, Table 23, and Table 24); R-value (Table 15); and crossover frequency (ωc), crossover modulus (Gc), crossover temperature (TGc), and δ at different |G∗| values (Table 16, Table 17, and Table 18). All of the binder parameters except ΔTc were evaluated at three aging conditions: unaged, after 20-h PAV aging, and after 40-h PAV aging. The correlation analysis was conducted on RAM mixtures with the same mix design but different virgin binders; thus, the analysis results were mix design specific. A total of 14 mixtures were included based on the four mix designs listed below:
- NR aggregates and RAM with 0.21 RBR (NR_0.21): three mixtures.
- NR aggregates and RAM with 0.37 RBR (NR_0.37): three mixtures.
- SR aggregates and RAM with 0.16 RBR (SR_0.16): four mixtures.
- SR aggregates and RAM with 0.29 RBR (SR_0.29): four mixtures.
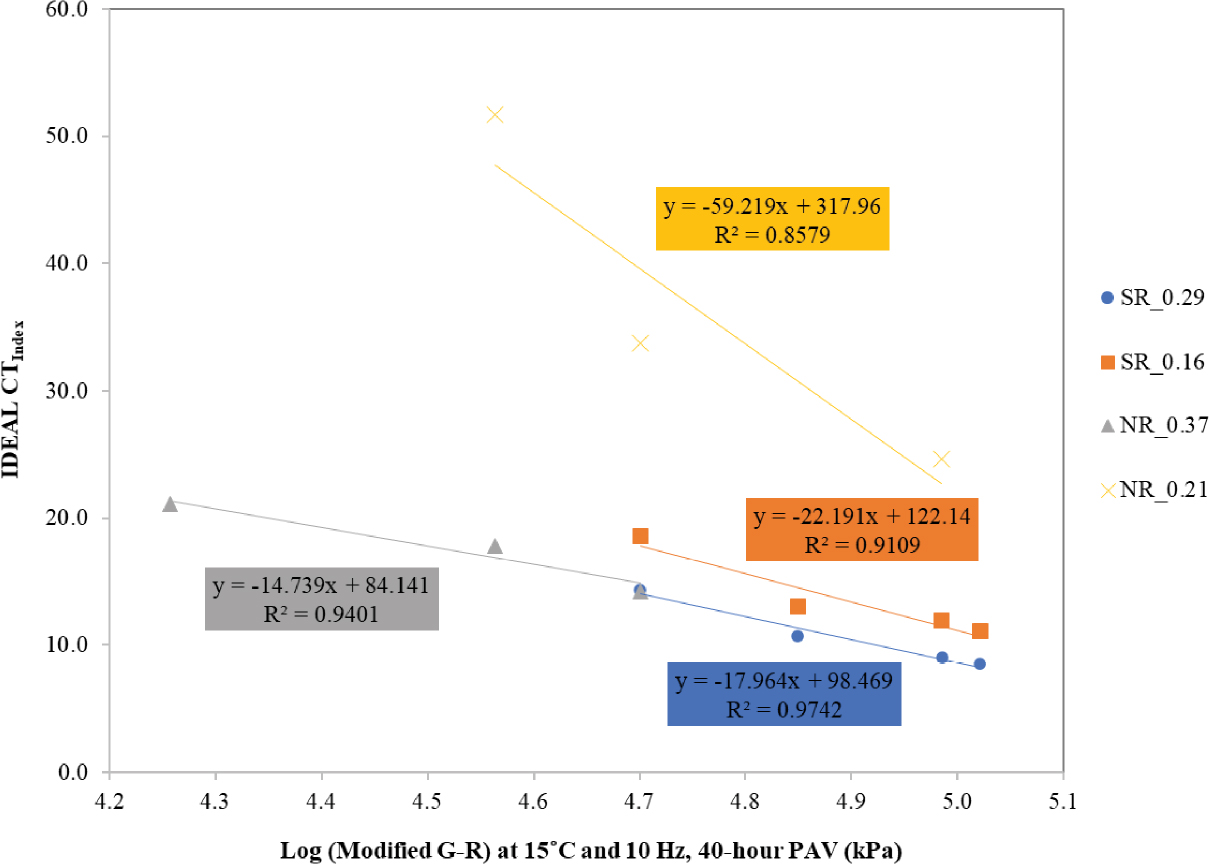
Figure 86 presents the correlation results for the modified G-R parameter at 15°C and 10 Hz after 40-h PAV aging as an illustration example. In all cases, a strong negative correlation existed between the modified G-R parameter (in logarithm) and the mixture IDEAL-CT results, by which the R2 value varied from 0.86 to 0.97, with an average of 0.92. This trend is reasonable because a higher modified G-R parameter indicates a more brittle virgin binder with poor relaxation properties, which is detrimental to the intermediate-temperature cracking resistance of the mixture as measured in the IDEAL-CT.
Figure 87 summarizes the correlation results for all the rheological binder parameters discussed previously. For simplicity, the average R2 of the four mix designs is reported instead of the R2 for each individual mix design. Overall, the modified G-R parameter exhibited stronger correlations to the IDEAL-CT results than the other rheological parameters that include both point and shape
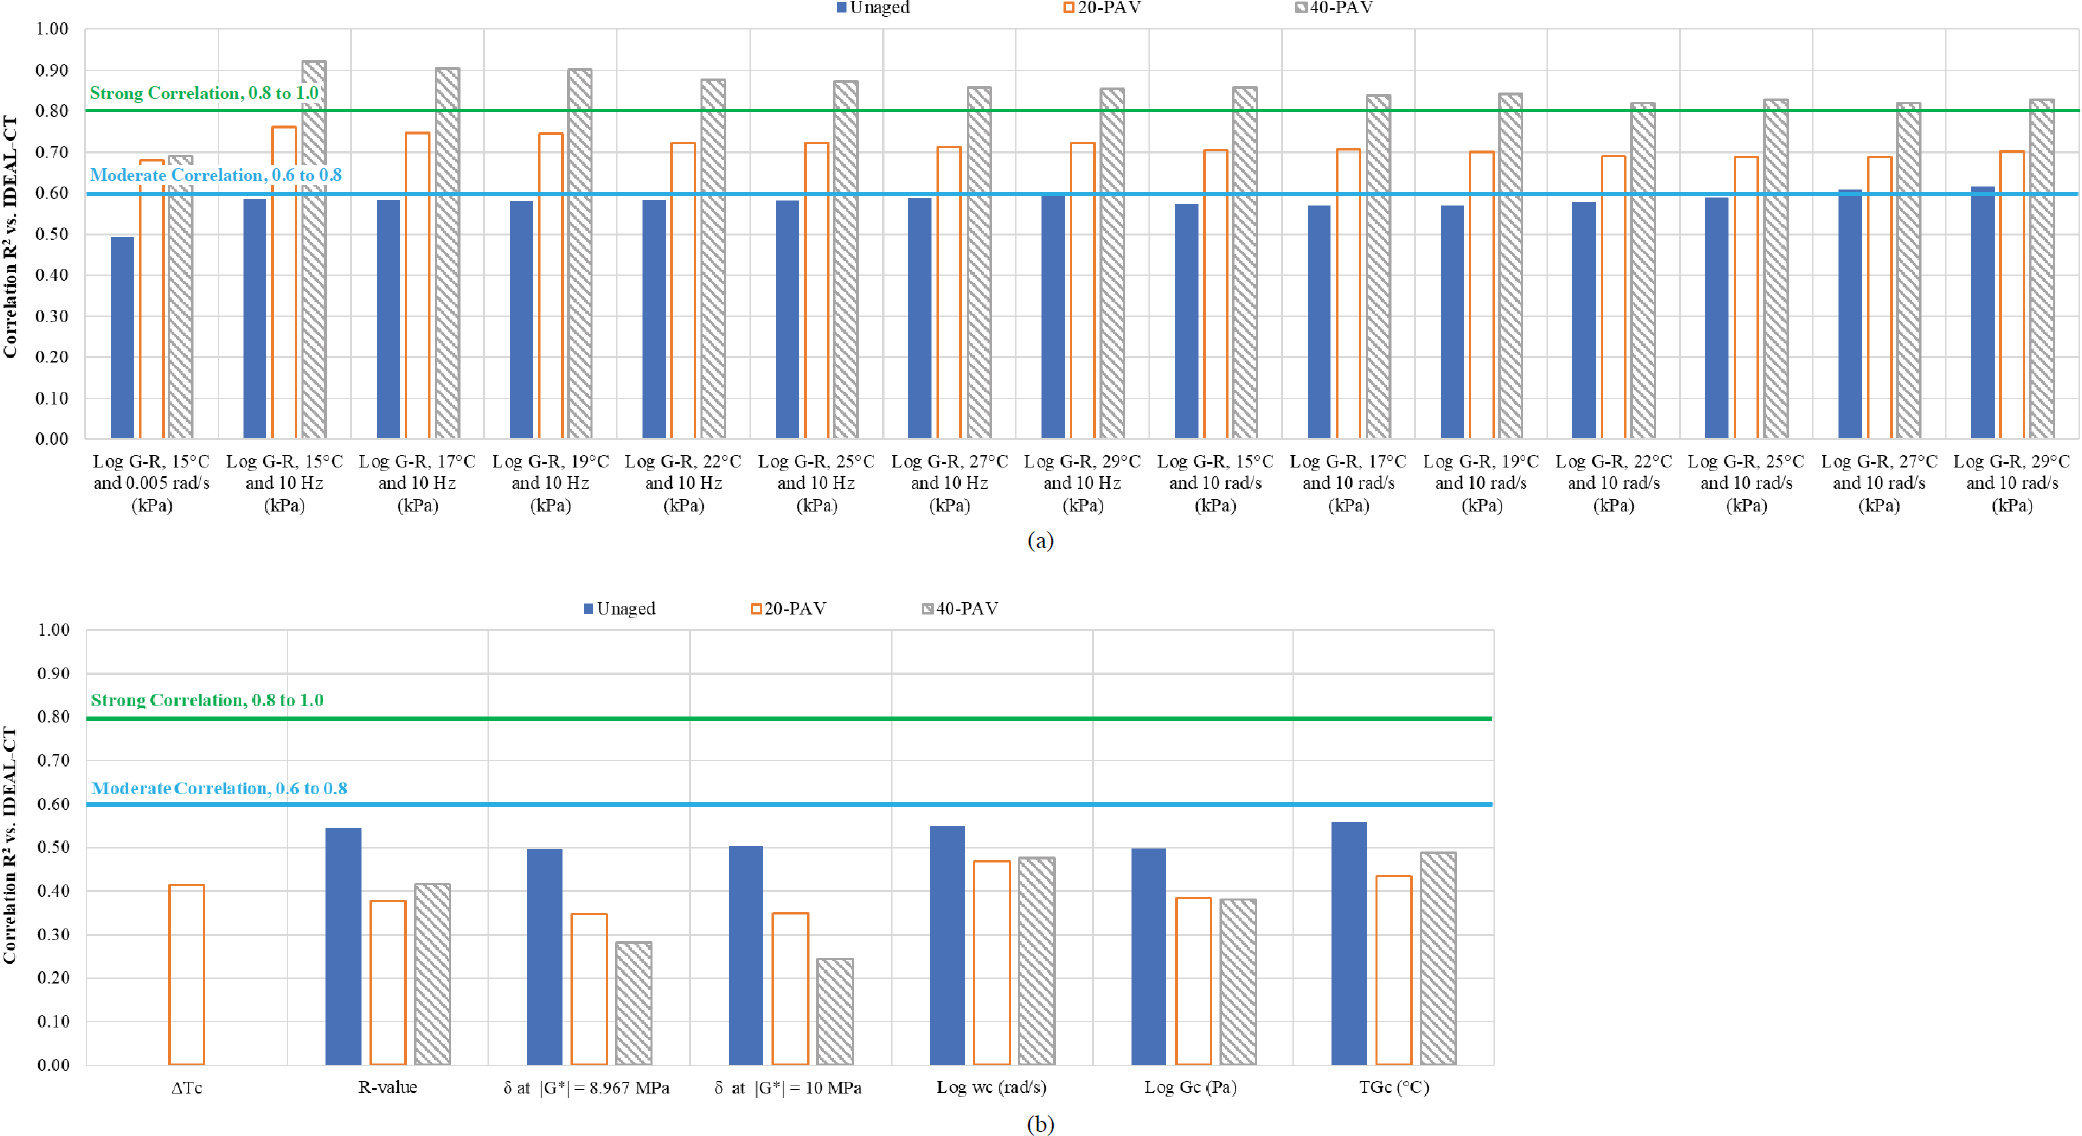
parameters. The average R2 of the modified G-R parameter increased significantly as the aging condition of the virgin binder increased. At 40-h PAV aging, the average R2 among all the temperature-frequency combinations was between 0.82 and 0.92. The modified G-R parameter results also showed that the R2 gradually decreased as the test temperature increased from 15°C to 29°C. These results suggest that the modified G-R parameter after 40-h PAV aging has the potential to be used as a screening tool to select virgin binders that will improve the IDEAL-CT results of RAM mixtures.
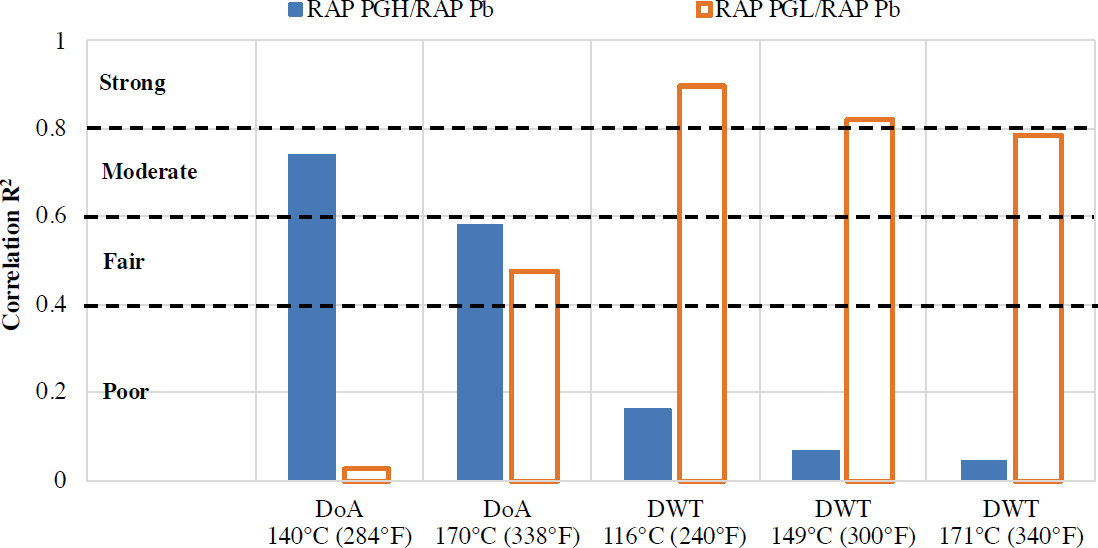
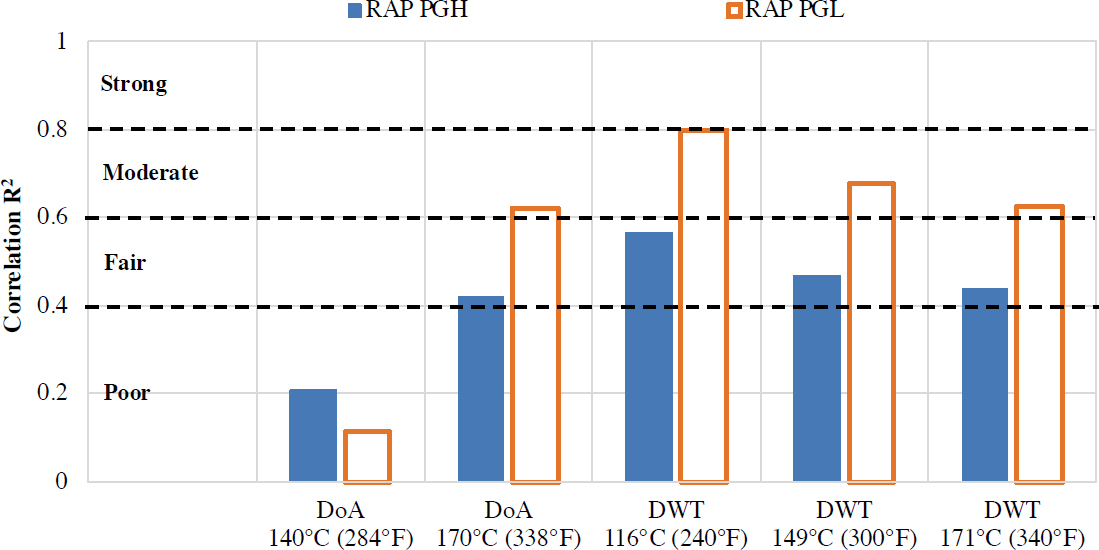
Figure 88 and Figure 89 capture the relationships between RAP binder properties and RAP binder activation parameters DoA and DWT with and without considering RAP binder content. Neither relationship accounts for differences in gradation across different RAP sources. The same ranges are used for the assessment of the strength of the relationships based on R2. Both PGH and PGL provide at least a fair relationship with all RAP binder activation parameters, except for DoA at the lower temperature, with PGL providing a stronger relationship than PGH. When RAP Pb is considered, only PGL provides a moderate or strong relationship with DWT, and stronger relationships were found for PGH with DoA than for PGL.