Capturing the Durability of High Recycled Binder Ratio Asphalt Mixtures (2024)
Chapter: 5 Cost Analysis
CHAPTER 5
Cost Analysis
This chapter describes a simplified cost analysis and compares the cost savings associated with each material combination necessary for producing durable high RBR mixtures with the corresponding typical RBR control mixture.
5.1 Cost Analysis Considerations
A cost analysis was performed to identify the costs associated with incorporating RAM and mitigation strategies into asphalt mixture production to achieve durable mixtures. Costs associated with the mixing plant and equipment on site, transportation to the project location, and quality control and assurance are not included. Table 45 presents the representative price/cost for the component materials in this analysis. The scenario considered reflects a high economic incentive situation, whereby the prices of virgin binder and aggregate are relatively high (at the upper limit of the representative range) while the costs of RAP, RAS, and additives (RA, LAS, lime) are relatively low (at the lower limit of the representative range) (Epps Martin et al. 2014).
5.2 Cost Analysis Results
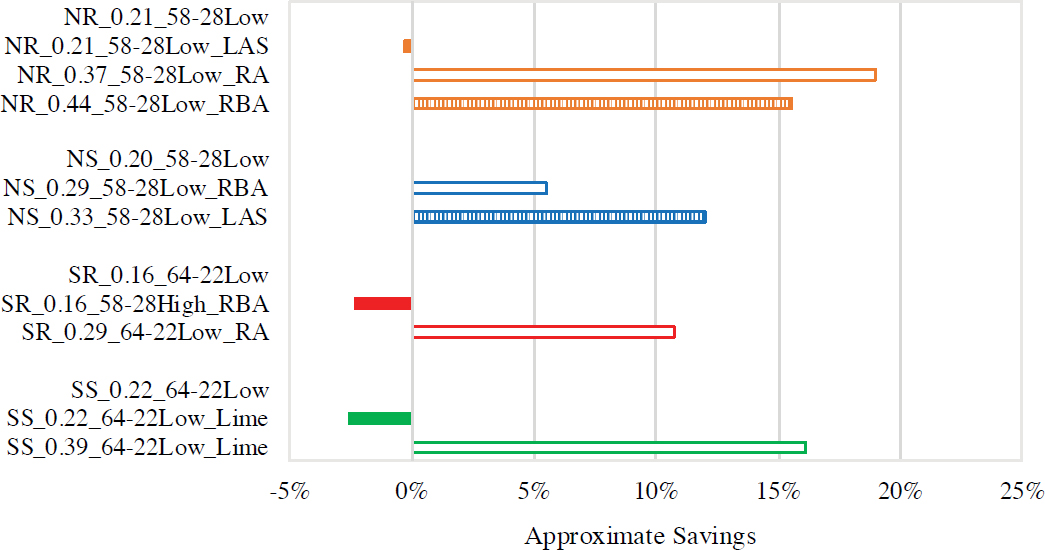
Table 46 and Figure 90 present the costs associated with each typical and robust mixture. This includes the approximate percentage of savings per ton of mixture when compared with the typical RBR mixture, considering a high economic incentive scenario.
For the NR mixtures, the cost savings achieved by increasing the RAP RBR from 0.21 (NR_0.21_58-28Low) to 0.37 with RA (NR_0.37_58-28Low_RA) were more significant (almost 20%) than the savings from increasing to a 0.44 RAP/RAS RBR mixture with decreased RBA strategy (NR_0.44_58-28Low_RBA), which were approximately 16%. For the NS mixtures, the cost savings achieved by increasing the RAP RBR from 0.20 (NS_0.20_58-28Low) to 0.33 RAP/RAS RBR with LAS (NS_0.33_58-28Low_LAS) were 12%, while increasing to 0.29 RAP RBR with decreased RBA (NS_0.29_58-28Low_RBA) was less beneficial, resulting in savings of 6%. In both the NR and NS mixtures, reduced savings were achieved when incorporating additional binder as a result of the decreased RBA mitigation strategy.
For the SR mixtures, increasing the typical RAP RBR from 0.16 (SR_0.16_64-22Low) to 0.29 with RA (SR_0.29_64-22Low_RA) resulted in more substantial savings (11%) than improving the typical RAP RBR mixture with a hybrid RAM strategy involving a softer virgin binder (PG 58-28 virgin binder) and decreased RBA (SR_0.16_58-28High_RBA). Finally, for the SS mixtures, cost savings of approximately 16% were obtained by increasing the RAP RBR from 0.22 (SS_0.22_6422Low) to 0.39 with lime as an anti-stripping agent (SS_0.39_64-22Low_Lime). Thus, all the cases evaluated demonstrated that cost savings are evident when virgin material costs are relatively high, and RAP, RAS, and additives costs (RA, LAS, lime) are relatively low, supporting the economic advantages of recycling in scenarios with elevated virgin material costs.
Table 45. Representative prices/costs associated with asphalt mixture production (Epps Martin et al. 2014).
| Item | Unit | Price/Cost, Dollars | |
|---|---|---|---|
| Representative Range | Representative Value | ||
| Virgin Binder | Per ton | 400–800 | 450 |
| RA, LAS | Per ton | 500–700 | 550 |
| Lime | Per ton | 150–250 | 200 |
| Virgin Aggregate | Per ton | 12–15 | 13 |
| RAP, RAS | Per ton | 5–8 | 6 |
Table 46. Costs associated with high economic incentive scenario.
| Material Combination | Mixture | Material Costs, $/ton | Cost Difference | ||
|---|---|---|---|---|---|
| %/ton of Typical RBR | $/ton of Typical RBR | $/Percent RAP | |||
| North Moisture Resistant | NR_0.21_58-28Low | 49.24 | – | – | – |
| NR_0.21_58-28Low_LAS | 49.39 | (0.3) | (0.15) | (0.01) | |
| NR_0.37_58-28Low_RA | 39.91 | 19 | 9.33 | 0.24 | |
| NR_0.44_58-28Low_RBA | 41.60 | 16 | 7.64 | 0.31 | |
| North Moisture Susceptible | NS_0.20_58-28Low | 44.92 | – | – | – |
| NS_0.29_58-28Low_RBA | 42.43 | 6 | 2.49 | 0.08 | |
| NS_0.33_58-28Low_LAS | 39.54 | 12 | 5.39 | 0.20 | |
| South Moisture Resistant | SR_0.16_64-22Low | 51.01 | – | – | – |
| SR_0.16_58-28High_RBA | 52.19 | (2) | (1.18) | (0.06) | |
| SR_0.29_64-22Low_RA | 45.53 | 11 | 5.48 | 0.17 | |
| South Moisture Susceptible | SS_0.22_64-22Low | 44.36 | – | – | – |
| SS_0.22_64-22Low_Lime | 45.52 | (3) | (1.16) | (0.06) | |
| SS_0.39_64-22Low_Lime | 37.21 | 16 | 7.15 | 0.21 | |
NOTE: (–) = Cost differences are calculated based on materials costs of typical RBR mixtures.