Economic and Social Mobility: New Directions for Data, Research, and Policy (2025)
Chapter: 4 Postsecondary Education
4
Postsecondary Education
Postsecondary education, and in particular the attainment of a 4-year bachelor’s degree, is a key predictor of individual economic well-being. A college degree carries a large premium in terms of wage, earnings, and income, and this premium grows over a lifetime (Autor et al., 2008; Katz & Autor, 1999). A college degree is increasingly important given the growing proportion of jobs characterized by “knowledge” work, which usually require a bachelor’s degree (Autor, 2019; Goldin & Katz, 2008; Kalleberg, 2011) and, increasingly, an advanced degree (Posselt & Grodsky, 2017).1
Attainment of a bachelor’s degree is also associated with noneconomic outcomes such as health, longevity, marriage, parenting, crime, and political participation (Case & Deaton, 2020; Cutler & Lleras-Muney, 2008; Lochner, 2011; Oreopoulos & Salvanes, 2011). Furthermore, the marked propensity of highly educated people to marry each other means that the college premium is increasingly concentrated among high-income, dual-earner households, where both partners have degrees (Hirschl et al., 2022; C. R. Schwartz, 2010).
Postsecondary educational attainment—and, especially, the attainment of a 4-year bachelor’s degree—is also central to the understanding of economic and social mobility in the United States (National Academies of Sciences, Engineering, and Medicine [National Academies], 2023b) because education plays a critical role in the intergenerational transmission of economic well-being. On one hand, education is an avenue for intergenerational
___________________
1Autor (2014, Figure 6A) shows that the growth in the “college premium” is largely driven by people with an advanced degree.
persistence, if advantaged families are able to afford more and better education for their children. In other words, educational attainment is a key mediator between parents’ and adult children’s socioeconomic resources. On the other hand, postsecondary education can be a vehicle for mobility—both absolute and relative—if attaining a degree detaches individuals from their social origins and provides a pathway for upward mobility. A college degree is particularly central not only because of the high economic returns attached to the credential but also because research suggests that the opportunity of economic success (or failure) does not depend from parental resources among bachelor’s degree holders, in contrast to those with lower levels of attainment (Bloome et al., 2018; Chetty et al., 2017; Hout, 1988; Pfeffer & Hertel, 2015; Torche, 2011, 2018).2
Postsecondary education policy can affect the cost of postsecondary education as well as its potential benefits. For example, financial aid and tuition policies affect the cost of college and how it differs across socioeconomic groups. Need-based grants and free tuition policies can increase postsecondary opportunities among low-income families (for a review of this large literature, see Dynarski et al., 2023a). And public (dis)investments in colleges can affect the benefits of a college education; for example, differences in instructional spending across colleges and college sectors have been linked to wide differences in graduation rates and economic benefits of postsecondary attainment (Lovenheim & Smith, 2023).
Yet, as this chapter discusses, many students who enroll in a 4-year program will not finish. Thus, other postsecondary pathways through which individuals may increase their earnings and career prospects must also be considered. These may include career and technical education, community college degrees and certificates, and job training programs. While research showing that a bachelor’s degree confers more economic benefits than other postsecondary education and training is relatively clear, the evidence on the returns to other sub-baccalaureate education is significantly more mixed. Although there are some returns to students who enroll in associate’s degree and certificate programs—especially in the applied health fields—such benefits have to be considered alongside the evidence that these programs may also divert students away from more lucrative 4-year degrees (see Lovenheim & Smith, 2023, for a review).
This chapter discusses trends in postsecondary attainment since the early 20th century and disparities based on family income, race and ethnicity, and gender. It then moves to the institutional organization of the postsecondary educational system and its funding structure and supply-side factors related to the quality of educational institutions. Finally, the
___________________
2This sentence was added after release of the report, correcting for its erroneous deletion during the editing process.
chapter covers alterative pathways to accumulating human capital and transitioning to the labor market. All these topics are central in the role that postsecondary education plays in the mobility process because they shape the two components of the mediating role of education in the process of mobility—namely, the association between parents’ resources and their children’s educational attainment, and the socioeconomic returns of educational attainment for adult children.
The committee’s focus on postsecondary education should not be taken as an indication that prekindergarten (preK), elementary, and secondary education (i.e., preK–12) is unimportant for economic and social mobility. In fact, this is a critical building block period of cognitive and socioemotional development that is essential for future academic and labor market success, both through and independent of postsecondary education. It is also one of the most well-studied periods when it comes to understanding how education shapes mobility; also well studied are interventions intended to identify core investments that improve and equalize mobility-relevant outcomes. Box 4-1 describes what is known about earlier periods of education from prekindergarten to high school, drawing from the recent National Academies report Reducing Intergenerational Poverty (2023b). Postsecondary education, in contrast, has received significantly less attention from research and policy, and it is therefore the focus of the report.
POSTSECONDARY ATTAINMENT IN THE UNITED STATES: TRENDS AND DISPARITIES IN ACCESS AND RETURNS
Given the large economic payoff of a bachelor’s degree, graduating from college could offer a pathway for mobility to young people from low-income households or racial minorities. Conversely, if the chance to enroll in and graduate from college is strongly determined by family income, then postsecondary education will serve as a vehicle for the intergenerational persistence of inequality.
The economic payoff of a college degree is greater in the United States than in any other rich democracy (Autor, 2014). The earnings gap between people with a bachelor’s degree and those with lower levels of schooling grew sharply starting in the late 1970s, driven by a growing demand for highly educated workers that was not met by comparable supply (Goldin & Katz, 2008). Since the early 1980s, the economic payoff to advanced degrees—including master’s, professional, and doctoral degrees—has increased even faster than that of terminal bachelor’s degrees (Autor, 2014). Even if wages of low-skill workers appear to have recovered some lost ground in the last decade (Aeppli & Wilmers, 2022), the college and advanced degree earnings premium remains substantial.
BOX 4-1
PreK–12 Education and Economic and Social Mobility
Reducing Intergenerational Poverty (National Academies, 2023b) reviewed evidence on interventions targeting the elementary and secondary stages of schooling. It emphasized the importance of educational quality, drawing attention to the challenges faced by schools in poor and racially/ethnically segregated communities. Aside from non-schooling-related barriers to education and learning in these communities (e.g., unstable housing, violence), these schools often have worse facilities, underqualified teachers, overcrowded classrooms, and insufficient textbooks and materials. Consequently, reforms that increase school funding—particularly in low-income areas—have positive impacts on educational outcomes, although their long-term effects in adulthood remain unclear. The report cautioned that such funding reforms are no panacea, as persistent school segregation remains a cause of income and racial/ethnic disparities in student success. The report also highlighted the effectiveness of efforts to intervene on educational quality directly, including reducing class sizes, recruiting STEM (science, technology, engineering, and mathematics)–trained teachers, and using personalized tutoring. Charter schools, particularly “no excuses” schools using a stricter educational model, have shown promise in improving outcomes such as test scores and 4-year college enrollment for the low-income urban students they predominantly serve. The importance of the “match” between students and teachers is a promising area as well, with recent research indicating higher rates of high school completion and college enrollment among Black boys who have Black teachers or enroll in ethnic studies–centered curricula, possibly because of higher educational expectations and less harsh disciplining. Finally, Reducing Intergenerational Poverty underscored the importance of well-implemented career and technical education programs that provide an alternative path to better jobs for some students—especially those who return to schooling after starting full-time work.
Figure 4-1 shows trends in educational earnings gaps across levels of schooling from 1963 to 2017 in the United States. In these plots, the vertical axis measures the cumulative change in earnings since 1963. For example, the graph on the left shows that in 1999 male high school dropouts were earning about the same as their counterparts in 1963; by contrast, males with graduate degrees were earning about 55 percent more in 1999 than their counterparts in 1963. The real earnings of workers with a terminal bachelor’s degree have grown by approximately 40 percent for men and more than 50 percent for women during this period. The increase in real earnings reaches 70 percent for those with an advanced degree. In contrast, real earnings have grown little for workers with low levels of schooling and particularly for men with a high school diploma or less. Since the 2010s, workers with the lowest levels of schooling have benefited from some increase in real earnings. Still, low-education workers, particularly men, have
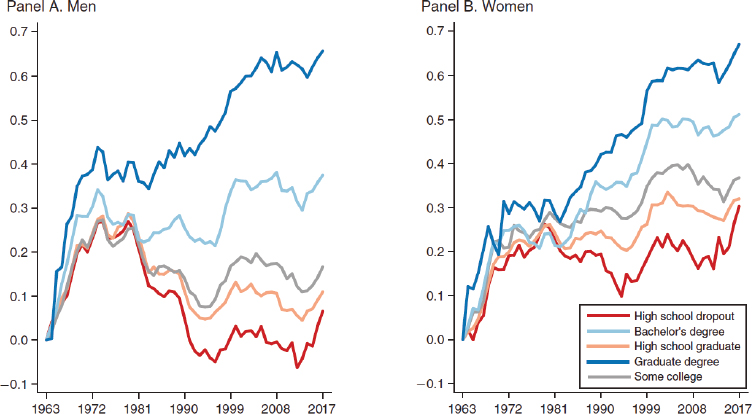
NOTES: Figure uses March Current Population Survey Annual Social and Economic Supplement data for earnings years 1963 to 2017. Series correspond to (composition-adjusted) mean log wage for each group, using data on full-time, full-year workers aged 16–64. The data are sorted into sex-education-experience groups of two sexes, five education categories (high school dropout, high school graduate, some college, college graduate, and postcollege degree), and four potential experience categories (0–9, 10–19, 20–29, and 30–39 years). Educational categories are harmonized following the procedures in Autor et al. (2008). Log weekly wages of full-time, full-year workers are regressed in each year separately by sex on dummy variables for four education categories, a quartic in experience, three region dummies, Black and other race dummies, and interactions of the experience quartic with three broad education categories (high school graduate, some college, and college plus). The (composition-adjusted) mean log wage for each of the 40 groups in a given year is the predicted log wage from these regressions evaluated for White individuals, living in the mean geographic region, at the relevant experience level (5, 15, 25, or 35 years depending on the experience group). Mean log wages for broader groups in each year represent weighted averages of the relevant (composition-adjusted) cell means using a fixed set of weights, equal to the mean share of total hours worked by each group between 1963 and 2005. All earnings numbers are deflated by the chain-weighted (implicit) price deflator for personal consumption expenditures. Earnings of less than $67 per week in 1982 dollars ($112/week in 2000 dollars) are dropped. Allocated earnings observations are excluded in earnings years 1967 and on, using either family earnings allocation flags (1967–1974) or individual earnings allocation flags (1975 earnings year and on). Earnings are in 2022 constant dollars and include wage and salary workers who are employed full time, 25 years and over, excluding incorporated self-employed weekly usual earnings multiplied by 52 to obtain annual estimate.
SOURCE: Autor (2019). Copyright American Economic Association; reproduced with permission of the AEA Papers and Proceedings.
lost substantial economic ground over the last six decades. The earnings of workers with some postsecondary education (including an associate’s degree) have grown somewhat more than those with a high school diploma but far less than those of workers with a bachelor’s degree or more. Educational disparities in earnings have been less pronounced for women than men. Yet women with a high school diploma have experienced no earnings gains between the 1970s and 2017.
Wide earnings gaps by education are directly relevant for intergenerational mobility because there are enormous disparities in degree attainment in the United States by income, race, and other measures of socioeconomic status. It is important to understand that these differences in degree attainment arise not just from postsecondary policies, programs, and institutions but from individual exposure to unequal resources, opportunities, and investments, from birth through adolescence.
Quantitative data and qualitative research reveal some of the mechanisms through which family background shapes postsecondary access and success, perpetuating educational inequality. For example, numerous qualitative studies have found that students from more affluent backgrounds with more educated parents have, even from a young age, much better preparation for college because they know the “hidden rules of the game,” and take honors and advanced placement courses in high school, supplement their coursework with SAT preparation tutoring, and approach teachers for recommendation letters and help (Calarco, 2018; Hamilton et al., 2018; Lareau, 2011; Persell & Cookson, 1985). These same students are also more equipped when applying to colleges and attending them—they understand which colleges are selective, which majors are most lucrative, and how to get the most out of their college experiences through relationships with faculty and advisors (Binder et al., 2016; Hamilton, 2016; Stuber, 2011). Intensive mentoring programs have been shown to increase postsecondary attainment for low-income high school students; an example is Carrell and Sacerdote (2017). Dynarski et al. (2023b) review the broader evidence on this type of intervention.
Many nontraditional students—and even their parents—are less likely to ask for help or leverage institutional settings to their advantage (Hamilton et al., 2018; Jack, 2016, 2019; Lehmann, 2014). Lower-income students at broad-access institutions such as community colleges are very likely to drop out without a degree. Qualitative research suggests they have difficulty covering the cost of basic needs such as food, housing, and transportation while attending college (Hart, 2019; see also Goldrick-Rab et al., 2018). Evidence further suggests that administrative burdens and academic barriers also play a role (Deil-Amen & Rosebaum, 2002, 2003).
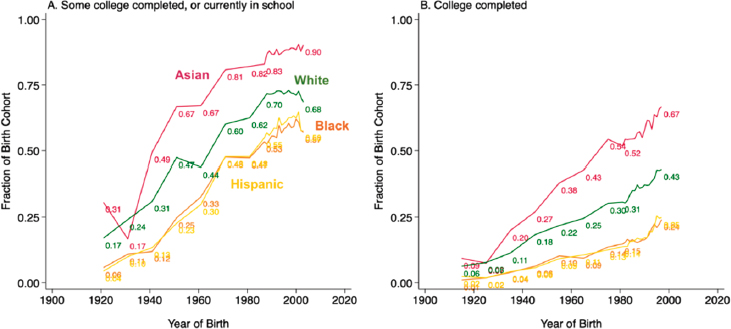
Postsecondary attainment rose steadily over the 20th century (Goldin & Katz, 2008). Among cohorts born around the turn of the 20th century,
a majority of young people had at least some postsecondary experience (Figure 4-2). By contrast, the share of the young people graduating from college—that is, those who attained a bachelor’s degree—has grown much more slowly and fitfully.
Based on the most current data available, about two-thirds of young people born in the late 1990s have attained some postsecondary education. However, only about half of those college entrants have completed a bachelor’s degree and only about a sixth also hold a graduate degree (a master’s, Ph.D., or professional degree). Substantial differences between men and women have emerged since the 1970s birth cohort, when the gender gap in postsecondary attainment favoring men reversed and women started to surpass men. Among the youngest cohorts born in the late 1990s, about a quarter of men but almost a third of women have attained a bachelor’s degree by age 25.
The growing female advantage in college attainment is poorly understood. Factors that have been explored include girls’ superior overall academic performance and motivation, and the narrowing of the gender gap favoring men in math and science scores. Researchers also point to growing educational and professional expectations among women, a rising age of marriage, and faster growth in the economic returns from college for women than men (Buchmann & DiPrete, 2006; DiPrete & Buchmann, 2006, 2013; Goldin et al., 2006; Lundberg, 2020). Buchmann and Di Prete (2006) show that the growing educational advantage of women is larger among low-income, single-parent families (see also Autor et al., 2019).
Researchers are beginning to examine the consequences of the reversal of the educational gender gap for the next generation of children. Recent research highlights that highly educated women are increasingly likely to marry men with lower levels of education (rather than remain single), and their marriages are increasingly stable compared with the past (Van Bavel et al., 2018). Women’s growing educational advantage will likely have broader consequences for intergenerational processes involving fertility, children’s and educational opportunities, and growing gaps between families in which both parents have high or low levels of schooling. Interestingly, a recent study from Sweden suggests that growing gender equality in the labor market reduces intergenerational mobility by increasing intergenerational persistence in women’s earnings and the household income of both men and women (Engzell & Mood, 2023). While no similar studies have been conducted in the United States, the educational and economic gains experienced by women might result in a similar outcome. This finding shows that gender-specific mobility is a complex phenomenon, and in this case, declining mobility can be the result of something that many would see as desirable.
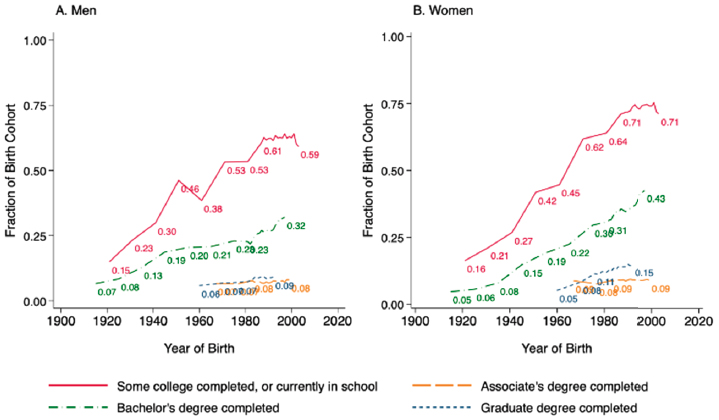
NOTES: Variables measuring educational attainment are operationalized somewhat differently across years because of changes in the U.S. Census and American Community Survey (ACS) questionnaire. Some college completed is defined as a person having attended at least some college at age 19. For 1940–1950 samples, the committee used a person’s highest grade of school attended (higraded) and whether they were in school (school). A person is coded as having attended some college if their highest grade was greater than or equal to “didn’t finish 1st year of college,” or their highest grade was equal to 12th grade and they were in school at the time of the interview. For 1960–1980 samples, we used a person’s highest grade of school attended (higraded) and their current grade (gradeatt). A person is coded as having some college if their highest grade was greater than or equal to “didn’t finish 1st year of college” or if they were “attending college” at the time of interview. For 1990–2022 samples, we used a person’s educational attainment (educd), whether they are currently in school (school), and their current grade (gradeattd). A person is coded as having attended some college if their educational attainment was greater than or equal to some college (including less than 1 year), if their educational attainment was at least 12th grade and they were in school at the time of the interview, or if their recent grade level was at least “college undergraduate.”
Associate’s degree completed is defined as having an associate’s degree, but no higher degree, at age 23. For 1990–2022, we use a person’s educational attainment (educd). A person is coded as having an associate’s degree if they have completed an associate’s degree (which may be occupational or academic). A person is coded as not having an associate’s degree if they have any other higher or lower level of educational attainment. This information is not available prior to 1990. Bachelor’s degree completed is defined as a person having a college degree (i.e., a bachelor’s degree) at age 25. For 1940–1980, we used a person’s highest grade (higraded). A person is coded as having a college degree if their highest grade is greater than or
SOURCES: U.S. Census and ACS samples downloaded from IPUMS USA. U.S. Census samples include 1940–1970 (1%) and 1980–2000 (5%). ACS samples include 2006–2022 (1-year samples). ACS samples 2001–2005 are excluded because they did not include persons living in group quarters.
The overall trends presented mask substantial inequality in college enrollment and college completion by family income. Figure 4-3a shows the probabilities of entering college by household income quartile among people born between 1961 and 1964 (dotted line) and among those born between 1979 and 1982 (solid line). Figure 4-3b shows the same probabilities for college graduation.
The figures reveal two clear patterns. First, the probability of attending and graduating from college strongly depends on household income. Second, the income gap has widened across cohorts. The college graduation rate was 5 percent for youth from the poorest households in the older cohort (born in the early 1960s) and rose to 9 percent for the younger cohort (born around 1980)—an increase of 4 percentage points. In contrast, the highest-income group experienced an increase of 18 percentage points (from 36% to 54%) in college graduation across cohorts. As a result, the income gap in college graduation grew from 4 to 18 percentage points.
A body of literature has examined the relationship between family income and educational attainment, and some have examined changes over time (Belley & Lochner, 2007; Duncan et al., 2017; Jackson & Holzman, 2020). These studies typically rely on small samples, combine different data sources, consider specific historical periods, or lack information about degree attainment. In fact, it is impossible, with the data sources currently available in the United States, to evaluate changes in the association between parents’ income and bachelor’s degree attainment over time—a critical factor of intergenerational mobility. Box 4-2 discusses this issue and outlines avenues for addressing it.
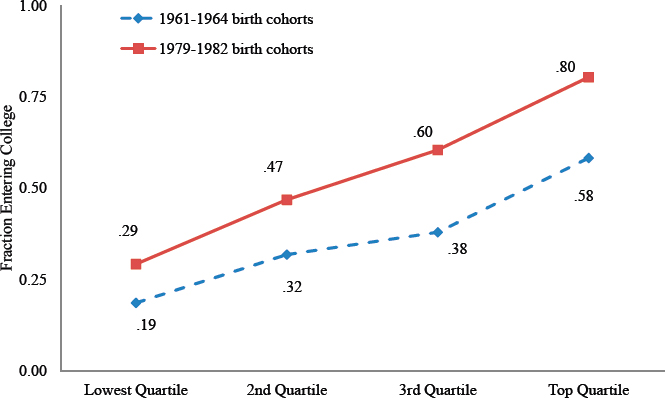
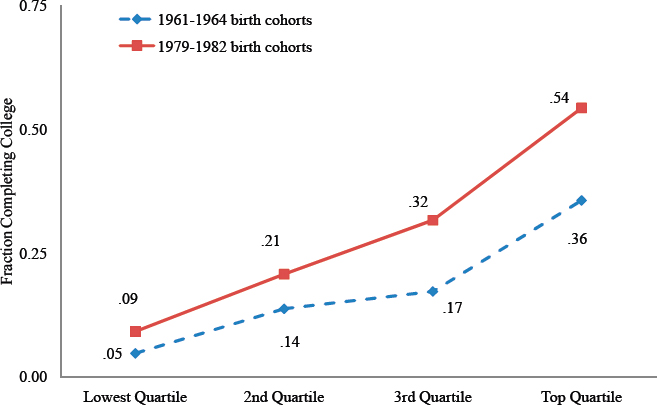
NOTES: Household income measured at the time of each baseline survey, when cohort members were 15–18 years old. pp = percentage points.
SOURCE: Bailey and Dynarski (2011), based on the National Longitudinal Survey of Youth 1979 and 1997, U.S. Bureau of Labor Statistics. © 2011 by Martha J. Bailey and Susan M. Dynarski. All rights reserved.
BOX 4-2
Linking Administrative and Survey Data to Track Educational Mobility in the United States
Understanding whether postsecondary education is an engine for intergenerational mobility or a replicator of inequality requires information linking parental income with children’s postsecondary attainment. Currently available data, however, are limited. For instance, while the National Longitudinal Survey of Youth provides data that allow for high-quality estimates, it is limited to cohorts that are nearly two decades apart (1979 and 1997 cohort). The Panel Study of Income Dynamics includes more cohorts, allowing for estimates of year-by-year changes, but these estimates are noisy, given small sample sizes. The Current Population Survey annual data cannot be used because samples are restricted to coresidential parents and children, creating a selected sample, given that many children leave the parental home to attend postsecondary education. Data from tax records, such as used by Chetty et al. (2014b), can link parental income with college attendance based on the presence of a 1098-T (tuition statement) filed by a college on behalf of the student to the Internal Revenue Service (IRS), but does not provide information on college graduation.
One strategy for addressing these data limitations is to use administrative data to supplement currently available surveys, as suggested by Dynarski (2014). Several sources of administrative data would allow for a robust examination of the link between parental income and degree attainment and its change over time. For instance, because of various federal policies that require reporting of student-level data, states track all students from kindergarten through at least high school. Data from administrative sources cover the entire population of elementary and secondary students in public schools. Data from the National Student Clearinghouse cover as many as 93 percent of students at colleges nationwide. These administrative sources can be linked to survey data on a broader range of variables collected by the National Center for Education Statistics, as well as to administrative data from sources such as the IRS, which contain detailed information on household characteristics, including income. This strategy would conserve resources that could be used to collect survey data that are not available through administrative sources. Because these data sources are available annually, they would support continuous evaluation of the parental income–college attainment link. (The strategy of a national database of student records is also supported by Conclusion 6-3 in Chapter 6.)
SOURCE: Based on Dynarski, 2014.
Gaps in college attendance, and especially college graduation, by race and ethnicity are also pronounced. Figure 4-4 shows trends in college attainment across ethnoracial groups among young people aged 25–29 from 1972 to 2022. About two-thirds of Asian young adults and about 45 percent of White young adults have attained a bachelor’s degree in 2022. In contrast, only 28 percent of Black young adults and 25 percent of Hispanic young adults have earned a degree. While all ethnoracial groups have made progress in bachelor’s degree attainment since the 1970s, the gaps based on race and ethnicity have persisted. Furthermore, disparities in access to selective colleges are more pronounced and have increased over time. Black and Hispanic youth have become increasingly less likely than their White peers to attend selective 4-year colleges (Oh et al., 2024). A recent study shows striking racial differences in the association between parents’ and children’s educational attainment (i.e., educational mobility). While the Black–White gap in upward educational mobility has closed substantially, Black people continue to be much more likely than White people to experience downward mobility from the top of the educational distribution (Karlson, 2023). This suggests that the socioeconomic status achieved by the Black population in the United States continues to be much more precarious than that of the White population.
A clear conclusion from Figures 4-3 and 4-4 is that the college dropout rate is much higher among low-income and minority populations, precluding a critical avenue for upward mobility. The wide socioeconomic gaps in college completion matter because, as shown in Figure 4-1, the attainment of a bachelor’s degree, and not just college attendance, is a dividing line in the U.S. income distribution. Those with some college education, or with a sub-baccalaureate credential (associate’s degree or a certificate) have earnings closer to high school graduates’ than to those with a bachelor’s degree (Autor, 2019). Many interventions supporting 4-year college enrollment and graduation among disadvantaged and minority populations have been tested (Avery et al., 2019; Dawson et al., 2020; Dynarski et al., 2023a,b; Holzer & Baum, 2017; Ibsen & Rosholm, 2024; Scrivener et al., 2015). Given the multiple reasons why young people drop out of college or enroll in less lucrative postsecondary programs—including financial barriers, information, familiarity with the college experience, and academic preparation—no single intervention is likely to be sufficient or to serve all low-income or minority youth.
A key question for mobility researchers is which combination of interventions might most effectively support college persistence and graduation among disadvantaged populations. In order to better understand which interventions might work, one needs to understand not only how one’s family background matters for college success, but also how postsecondary decisions are made. Qualitative research is illuminating on this point, and
NOTES: Variables measuring educational attainment are operationalized somewhat differently across years because of changes in the U.S. Census and American Community Survey (ACS) questionnaire. Some college is defined as a person having attended at least some college at age 19. Samples from 1940–1950 used a person’s highest grade of school attended (higraded) and whether they were in school (school). A person is coded as having attended some college if their highest grade was greater than or equal to “didn’t finish 1st year of college,” or their highest grade was equal to 12th grade and they were in school at the time of the interview. Samples from 1960–1980 used a person’s highest grade of school attended (higraded) and their current grade (gradeatt). A person is coded as having some college if their highest grade was greater than or equal to “didn’t finish 1st year of college” or if they were “attending college” at the time of interview. Samples from 1990–2022 used a person’s educational attainment (educd), whether they are currently in school (school), and their current grade (gradeattd). A person is coded as having attended some college if their educational attainment was greater than or equal to some college (including less than 1 year), if their educational attainment was at least 12th grade and they were in school at the time of the interview, or if their recent grade level was at least “college undergraduate.” College is defined as a person having a college degree (i.e., a bachelor’s degree) at age 25. For 1940–1980, the committee used a person’s highest grade (higraded). A person is coded as having a college degree if their highest grade is greater than or equal to their 4th year of college. Samples from 1990–2022 use a person’s educational attainment (educd). A person is coded as having a college degree if they have completed a bachelor’s degree or more. Estimates of the proportion of each racial group and birth cohort with some college and college were generated using Census weights. Person weights were used for all years except 1950, in which we used sample-line weights. Four racial groups are shown, created based on IPUMS simplified race and Hispanic ethnicity variables (race and hispan). Asian includes persons whose race is categorized as Chinese, Japanese, or Other Asian or Pacific Islander and not categorized as Hispanic. Black includes persons whose race is categorized as Black or African American, and not
SOURCES: Figure created using U.S. Census and ACS samples. U.S. Census samples include 1940–1970 (1%) and 1980–2000 (5%). ACS samples include 2006–2022 (1-year samples). ACS samples 2001–2005 are excluded because they did not include persons living in group quarters.
an emerging body of work has begun to focus on postsecondary choices, revealing some of the mechanisms that underlie inequality in the selectivity of postsecondary institutions students attend by race and income, and why more non-White first-generation college students from low-income backgrounds seem to underinvest in their postsecondary education by starting at community colleges and for-profit sub-baccalaureate programs (with relatively lower returns), while their advantaged counterparts start at selective 4-year institutions. It can be easy to conclude that low-income students are unaware of optimal strategies—which is certainly true for many—but students might also be rationally choosing nontraditional and seemingly suboptimal postsecondary pathways, and policies need to be informed as to how and why.
Some qualitative research finds that traditional college choice models fail to capture the decisions of non-White first-generation college students from low-income backgrounds (Bloom, 2007; Cox, 2016). For example, in interviews, Black students say they choose for-profit occupational programs because they offer transparent connection to work (through these schools’ aggressive targeted advertising) and flexibility (e.g., rolling enrollments, online options, the ability to switch between full- and part-time student status depending on work schedules, the ability to stay near home to care for siblings; DeLuca et al., 2016; Holland & DeLuca 2016; Iloh, 2018; Iloh & Tierney, 2014). They also share that sub-baccalaureate postsecondary credentials are attractive because they are short term, and even high-performing high school graduates from low-income backgrounds and unstable home lives seek credentials they can finish quickly, possibly because they (perhaps accurately) predict a high likelihood of adverse events that could interrupt or derail a longer postsecondary program, such as a 4-year degree (DeLuca et al., 2016; Holland & DeLuca, 2016).
Other students from low-income backgrounds worry about failure to complete a degree and career payoff, and some decide to put off 4-year
college or any college until they have settled on a major/career, gained occupational experience, and attained residential or economic independence in an effort to hedge against what they reasonably believe might derail their degree: distractions, inexperience, and financial shocks (Cilesiz & Drotos, 2014; DeLuca & Burland, 2023; DeLuca et al., 2021; Young & DeLuca, 2020).
THE STRUCTURE OF POSTSECONDARY EDUCATION AND INTERGENERATIONAL MOBILITY
The U.S. postsecondary system is heterogeneous and stratified (Labaree, 2017). Colleges vary dramatically in their inputs (spending per student, student preparation, governance) and their outcomes (graduation rates, economic payoff for graduates). Furthermore, the most disadvantaged students attend the institutions with the fewest resources and the worst outcomes (Lovenheim & Smith, 2023). A key question for research, therefore, is whether U.S. postsecondary education serves as an engine for upward economic mobility by disentangling low-income people from their social origins, or if it functions as an intergenerational replicator of inequality by providing privileged access to wealthy families. The answer to this question requires considering variation across the vast and heterogeneous postsecondary sector, with broad-access universities playing a different role from that of selective institutions (see Box 4-3).
The U.S. postsecondary system is highly decentralized. It comprises thousands of institutions that vary by institutional control, mission, and degrees or credentials offered. While in many developed countries, the postsecondary sector is in the federal domain, in the United States, it is the states that have the greatest responsibility in provision, with cities and counties also playing a relevant role in some states. States heavily subsidize and oversee public postsecondary institutions.
In addition to public colleges, there are thousands of private nonprofit colleges and universities (there is also a considerably smaller sector of for-profit colleges and universities). Private-sector universities educate roughly 25 percent of students. They are enormously diverse; this group includes both highly selective Ivy League institutions and very small trade schools.
In the public sector, colleges and universities are primarily funded, controlled, and operated by state governments. In the private sector, colleges and universities are controlled by nongovernmental agencies and funded primarily through private funds. Private institutions may be either nonprofit, including those affiliated with religious organizations, or for profit. Postsecondary institutions are generally structured to offer either 4- or 2-year programs. Four-year institutions offer bachelor’s degrees and may additionally grant graduate degrees, including master’s, professional,
BOX 4-3
What About Elite Colleges?
Elite colleges, such as those in the Ivy League, draw significant attention from the media and politicians. In the United States, these colleges are an extremely narrow gateway to political, cultural, economic, and intellectual power—to the elite 1 percent or even 0.1 percent. Research shows that students from families in the top 1 percent of the income distribution are much more likely than middle-class students to be admitted to these institutions, even when they have similar test scores. Additionally, attending an elite school increases the chances of reaching the top 1 percent of the earning distribution by 60 percent (Chetty et al., 2023). A critical determinant of the high-income admissions advantage at elite colleges is legacy admissions—the preferential treatment of applicants who are children or other relatives of alumni. This policy, often framed as a way to strengthen alumni loyalty and boost fundraising, disproportionately benefits wealthy, predominantly White families who have historically been overrepresented at these institutions, giving them an advantage over capable candidates from underrepresented or lower-income backgrounds (Golden, 2007; Kahlenberg, 2010).
Who goes to these schools has a substantial impact on the makeup of the country’s elite leadership. These schools train the politicians, journalists, jurors, owners, and investors who wield enormous power. If these schools do not admit and graduate students who mirror society, they help to perpetuate a rigid social, economic, and political structure that limits mobility. The discussions around affirmative action policies for disadvantaged groups are especially salient in this sector.
While elite colleges shape who is in the very top echelons of power and prestige, the mobility of the other 99 percent is driven by the education programs, policies, and institutions that are the focus of this chapter. These include job training programs, career and technical education, community colleges, and thousands of 4-year colleges across the country.
and doctoral degrees. Two-year institutions offer credentials or degrees up to the level of associate’s degrees and potentially provide students credits that they can transfer to 4-year institutions.
In 2021–2022, there were 3,899 postsecondary institutions serving more than 18.6 million students in the United States. About half of students were enrolled in 4-year public universities, about one-fifth were enrolled each at 4-year private nonprofit (21.9%) and 2-year public (24.0%) institutions, while a small minority attended 4- and 2-year private for-profit institutions (5.3%; Figure 4-5). Public colleges educated almost three-quarters of students in the United States in 2022, particularly those with lower incomes (Reber & Smith, 2023). As such, public institutions have the greatest potential to provide opportunity for upward intergenerational mobility.
The postsecondary educational landscape has changed substantially in the last few decades. Many 2-year institutions have begun to offer 4-year
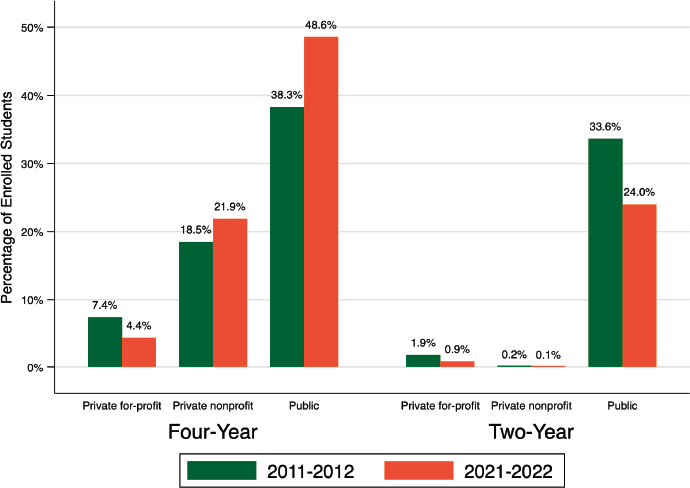
NOTES: Figure generated using data from 2022 Digest of Education Statistics from the National Center for Educational Statistics. See Table 303.25 (enrolled students). Enrolled students documented as of Fall 2011 and Fall 2021.
SOURCE: U.S. Department of Education, National Center for Education Statistics, 2011–2012 and 2021–2022.
bachelor’s programs, leading to a reclassification of some 2-year institutions as 4-year institutions (Lederman, 2011). More dramatically, the past two decades have seen the rise and fall of private, for-profit institutions (Beaver, 2017). In the early 2000s, for-profit institutions grew in number and size, facilitated by new infrastructure for online education. Under the Obama administration, the Department of Education increased scrutiny of these institutions—which often left students with high levels of debt—leading to new regulations and enforcement of rules that limited students’ ability to use federal student aid to attend. Since then, regulatory development and enforcement has shifted depending on partisan control of federal executive offices, with the Trump administration removing some regulations and the Biden administration reinstating them (Nadworny, 2023). Nonetheless, the cumulative result of these regulatory efforts is that many private for-profit institutions have closed. Between 2011–2012 and 2021–2022, the proportion of students served by private for-profit institutions dropped from 7.4 percent to 4.4 percent.
VARIATION ACROSS POSTSECONDARY INSTITUTIONS: RESOURCES, GOVERNANCE, AND GRADUATION RATES
The amount of economic resources colleges use to educate their student bodies varies substantially across institutions, resulting in considerable heterogeneity in cost and quality. For example, among 4-year institutions, total expenses per full-time-equivalent student in year 2020–2021 were $69,145 in private nonprofit colleges, $52,897 in public colleges, and only $17,660 in private for-profit institutions (National Center for Education Statistics [NCES], 2023). Even within the public sector, there is considerable variation, with 2-year colleges expending about half as many resources as 4-year colleges.
Institutional resources have consequences for mobility, but more information is needed. These disparities have consequences for mobility because low-income and minority students are more likely to be served by institutions with reduced investments (Hamilton et al., 2024; Lovenheim & Smith, 2023). In elementary and secondary education, research has shown that spending matters for student outcomes, both in the near and long terms (National Academies, 2023b). There is far less evidence on this link in postsecondary education, but the existing research strongly supports the hypothesis that fewer resources translate into worse outcomes in college (Lovenheim & Smith, 2023). This is therefore an important research priority.
The degree of government oversight, governance, and coordination of public colleges also varies, especially across states. California has the most coordinated system of community colleges, state universities, and flagships, with clear standards for who can be admitted to each of these schools and how students can transfer between them. Michigan is at the opposite extreme, with a constitutional ban on a statewide higher education coordinating board.
Governance can have relevant implications for students. In California, students can transfer from community colleges to state universities with relative ease, carrying with them their credits earned. In Michigan, the ability of a student to transfer credits depends on whether the two colleges have agreed on which credits can transfer.
Governance can have consequences for mobility. Community colleges have traditionally been the entryway to postsecondary education for disadvantaged populations. When students can easily transfer from community colleges to schools that grant bachelor’s degrees, the former serve as a gateway to the economic mobility associated with a bachelor’s degree. When students cannot easily transfer, community colleges can serve as a barrier to mobility.
Graduation rates also have consequences for mobility and vary substantially across institutions. Among students entering 4-year colleges in 2015, graduation rates within 4 years reached 58 percent at private nonprofit colleges, but only 44 percent at public colleges, and a very low 23 percent at private for-profit colleges (NCES, 2022). College dropout is, then, a critical barrier to upward economic mobility for youth from disadvantaged backgrounds. Among college dropouts, students who take student loans are particularly vulnerable, as their debt burden compounds the limited returns to their educational investments, hampering their financial well-being. As discussed in the next section, a growing number of students rely on loans to fund their educational investments, and student loan debt is stratified by family income and race and ethnicity.
THE FUNDING OF POSTSECONDARY EDUCATION IN THE UNITED STATES AND THE GROWING IMPORTANCE OF LOANS
While private postsecondary institutions have always charged tuition, historically, public colleges had tuition prices near zero, enabled by the large subsidies provided by state governments. This began to change in the 1980s as a series of tax revolts swept the states. In the past 40 years, states have disinvested from their public institutions, and those schools have turned to tuition to prop up their revenues. As a result, the cost of a public college education has shifted from taxpayers to individual students (The Pew Charitable Trusts, 2019).
As tuition prices have risen, the federal government has stepped in to assist students and families with grants and, particularly, loans. Borrowing for college is now much more common than it was just a few decades ago (Lochner & Monge-Naranjo, 2016). The shift to loans has been particularly marked at public 2-year colleges. In 2000, just 5 percent of students at community colleges took out loans; in 2012, that figure had tripled, to 17 percent (Looney & Yannelis, 2024). These students, who are disproportionately disadvantaged, are among the most likely to default on their loans, leading to substantial financial distress.
Borrowing has always been very high at for-profit schools, which enroll a population similar to community colleges and where default rates are also very high (Looney & Yannelis, 2024). A key question for future research is whether for students at these schools, which have low graduation rates, the downside risks of borrowing outweigh the benefits of attending college. As this chapter has documented, there is extensive research estimating how college costs, borrowing, graduation, or labor market returns differ across sectors and socioeconomic status (see Lovenheim & Smith, 2023, for a comprehensive review). To the committee’s knowledge, however, no
research has integrated these estimates into a comprehensive, distributive analysis of the net costs, benefits, and risks of college.
A relevant source of public support for higher education expenses is tax benefits such as the American Opportunity Tax Credit; the Lifetime Learning Credit; deductions for student loan interest; and tax-advantaged savings plans, such as 529 accounts. These policies aim to reduce the cost of education by lowering tax liability or encouraging savings. However, the benefits disproportionately accrue to middle- and upper-income families who are more likely to have the financial literacy and resources to take advantage of them. Furthermore, research indicates that these tax-based subsidies have no impact on increasing educational attainment, as the delayed nature of the benefits fails to incentivize enrollment decisions for financially constrained families (Bulman & Hoxby, 2015; Dynarski & Scott-Clayton, 2016). Instead, these programs often function as a post hoc subsidy for families who are already able to afford higher education, thereby reinforcing existing disparities.
The United States is unusual in having students pay tuition and borrow for vocational training, which is typically provided by community colleges and for-profit schools. In much of the world, by contrast, students seeking vocational training do not pay tuition or borrow to fund their training. There is also a closer link between this training and the labor market (e.g., Germany’s apprenticeship system). A key question for mobility research is whether funding models in other countries are more effective in generating economic mobility through vocational training than the U.S. model.
There is also room for historical research because the responsibility for career and technical training has shifted over time in the United States. Career and technical training, including that for displaced workers, was once funded primarily by the U.S. Department of Labor in the form of free training programs. Now it is largely the responsibility of the postsecondary sector.3 Unemployed workers seeking job retraining are steered toward community colleges or for-profit training schools, where they may borrow for college costs. What was considered a societal obligation to train workers is now framed as the private responsibility of individual students investing in their education. It is important to understand how this has affected individual welfare, incentives to invest in education, and economic mobility. (The effectiveness of job training programs is discussed below, in the section “Alternative Transitions and Pathways to the Labor Market.”)
___________________
3Overall funding for federal training programs peaked in the 1970s, both in real dollars and as a share of gross domestic product (GDP), and it has declined precipitously since then (Mueser et al., 2023). By fiscal year 2021, funding for training programs relative to GDP had fallen by 90 percent since the 1970s and, compared with funding in 2014, had fallen by 21 percent.
POSTSECONDARY EDUCATION: BALANCING RISKS AND RETURNS
A college degree, on average, more than pays for itself, even after accounting for tuition costs and wages forgone while in school (Daly & Bengali, 2014). Beyond earnings, a college degree yields benefits in terms of health, family stability, and social connections (Hout, 2012). Research using quasi-experimental data to identify causal effects suggests a substantial effect of 2-year and 4-year colleges on students’ probability of college graduation and later earnings (Chetty et al., 2023; Goodman et al., 2017; Mountjoy, 2022, 2024). This effect is usually measured for “marginal students” (i.e., those who are on the threshold of enrolling in college, rather than for students that would enroll with certainty). Critical for upward mobility, the economic benefits of both associate’s and bachelor’s degrees is larger for disadvantaged students (Goodman et al., 2017; Mountjoy, 2022) and for students who are the least likely to enroll, who usually come from families with low levels of schooling and earnings (Brand, 2023). There is also substantial variation in the return to college across school and college characteristics. The U.S. Department of Education’s College Scorecard website4 reports the earnings of former students by school and shows substantial variation even restricted to 4 -year bachelor degrees. While some of this variation can be attributed to the characteristics of the student body, a growing literature shows that at least some of the variation across schools and sectors is causal (e.g., Chetty et al., 2023; Conzelmann et al., 2023; Goodman et al., 2017; Mountjoy, 2022, 2024).
Like any investment, education is not without risk. This risk includes variation in the payoff of a credential from a given school and major, as well as substantial uncertainty in whether a student will graduate. The growing literature on heterogeneous returns to college shows that returns vary by student race and family income. The field of study selected by students has emerged as a key stratifying mechanism, which suggests that the payoff to postsecondary attainment can vary not only across institutions but also within them (Bleemer & Quincy, 2024; Kim & Tamborini, 2019; see review in Lovenheim & Smith, 2023). On the one hand, the United States has a very flexible postsecondary system with expansive options across sectors and degree programs, and many “on- and off-ramps.” On the other hand, this flexibility can exacerbate inequality and hamper mobility, as students from less advantaged backgrounds must navigate this complex institutional landscape with fewer resources.
A key question for policy is who bears these risks. And for mobility researchers, a key question is whether the benefits of a college education
___________________
4https://collegescorecard.ed.gov/compare/?togglepercent3Dinstitutions
outweigh its risks, particularly for students from low-income backgrounds, first-generation college students, immigrants, and racial minorities. These students often have much to gain from a postsecondary education (Brand, 2023; Goodman et al., 2017; Mountjoy, 2022). But they are more likely to attend institutions with fewer resources needed to support degree completion (Fry & Cilluffo, 2019, p. 3; Reber & Smith, 2023, Figure 2). These students also have little in the way of a safety net if the investment does not pay off. In particular, the for-profit sector disproportionately enrolls students of lower socioeconomic status while generating limited educational benefits (Gelbgiser, 2018) and no observable economic benefits (in some cases even negative returns; Cellini & Turner, 2019). Enrollment in this sector is countercyclical, booming during recessions when stressed community colleges and job training programs cannot serve the surge in people seeking to build their job market skills (Looney & Yannelis, 2024).
The growth of alternative and industry-provided credentials, bootcamps, and certifications means that the postsecondary landscape has also become even more complex and uncertain for students most at risk (Stevens & Kirst, 2015). While alternative credential providers have grown exponentially over the last decade, and such programs may serve an important need for those not pursuing college or transitioning between jobs, very little is known about the experiences students have in these programs and what the returns are on these investments. Given that many students choosing these programs may come from relatively disadvantaged families, these programs might have implications for upward mobility. More research in this area would be relevant.
Public policy can play a role in mediating risk. If tuition is low and grants support living expenses, then the risk to the individual student is minimized. If tuition is high and students borrow to pay for tuition and living expenses, then the risk to the individual is very high. Policies such as need-based aid and income-based loan repayment lie between these two extremes.
FROM DEMAND SIDE TO SUPPLY SIDE: RESEARCH ON IMPROVING COLLEGE QUALITY
There is now a large body of rigorous evidence on stimulating student demand for postsecondary education (Dynarski et al., 2023a,b). Research now needs to move to designing policies that stimulate demand for particular populations and settings. Evidence about specific populations defined by level of academic preparation, race and ethnicity, income levels, and age is needed, as is evidence for settings defined by proximity to nearby colleges (including higher education “deserts”) and for type of institutions, including community colleges, nonselective 4-year, and selective 4-year.
Research is also needed on how to improve the quality of postsecondary education at all levels (Arum & Roksa, 2011; Holzer & Baum, 2017; Lovenheim & Smith, 2023). In the United States, as in many other countries, the postsecondary sector has grown through the establishment and expansion of schools that receive relatively few resources, as described in the previous section. Community colleges, less-selective 4-year colleges, and for-profit colleges spend far less per student than do selective, elite colleges. Yet the former service the students with the most challenges.
This is the opposite of the pattern in funding in elementary and secondary education, where additional federal money flows to schools that serve more students who live in poverty, are English learners, or have disabilities (Jackson et al., 2016; Johnson, 2015; Wong, 1999). This priority in funding reflects the understanding that it is more expensive to educate students who come to school with more disadvantages.
A recent literature has shown convincingly that spending matters in elementary and secondary education (Jackson et al., 2016). Districts and schools that receive more funding per student produce better outcomes for those students, both in the short and long terms. Analogous research is now needed on how spending affects outcomes in the postsecondary sector.
Furthermore, research needs to explore how to use that funding to achieve the desired outcomes. An enormous amount of literature has examined the effect of inputs, policies, and practices on children’s education from preschool through high school, answering basic questions, such as
- How does class size affect learning?
- How does teacher training affect student outcomes?
- What curricula are most effective in teaching math and reading?
- Which pedagogical techniques and curricula boost learning and improve graduation rates?
- How does school size affect student learning?
- How does the composition of classrooms affect learning?
- When and where does ability grouping improve student learning?
By contrast, analogous literature addressing these questions in the postsecondary setting is astoundingly thin. Instead, research on postsecondary education has focused overwhelmingly on who goes to college, whether they finish, who pays for it, and how much they pay. Although these are important questions, they have overshadowed the equally important question of how to improve the quality of education in the postsecondary sector. Given the heterogeneity in returns to college (observed at all levels), more information is needed about what kinds of programs and inputs work for which students, not only in terms of graduation rates but also in terms of job placement, career growth, and earnings.
ALTERNATIVE TRANSITIONS AND PATHWAYS TO THE LABOR MARKET
This chapter, as does most research on postsecondary education, refers largely to educational experiences that happen shortly after high school graduation and that precede a transition to paid employment. Yet the distinction between periods of education and work in the life course has never been this clear. Table 4-1 shows that students have long worked while attending both high school and college, although research is mixed on the benefits of such employment while attending school (Bozick, 2007; Davis, 2023; Lee & Staff, 2007; Mortimer, 2010; Scott-Clayton, 2012). Nearly one out of six students—especially non-White students from low-income backgrounds—delay college in order to get work experience, figure out what they want to study in college, or save money for college (Bozick & DeLuca, 2005, 2011; Holland & DeLuca, 2016; Roksa & Velez, 2010).
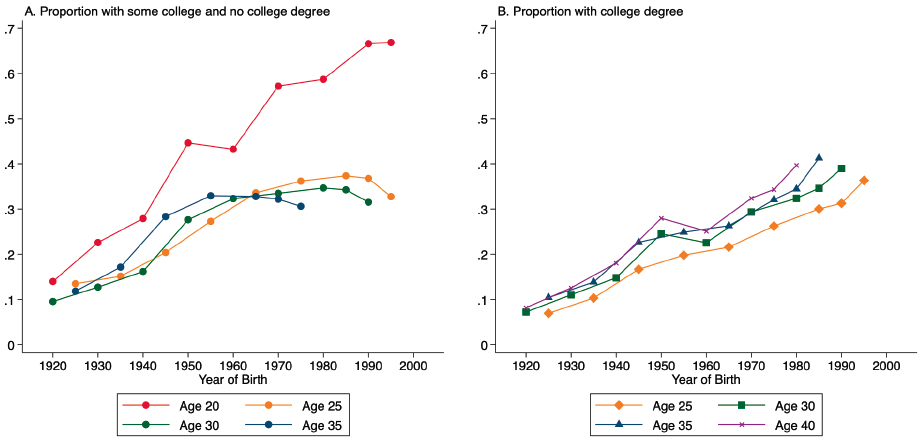
Over time there has also been an increase in the share of people earning a college degree at age 30 and older (Figure 4-6), reflecting delayed enrollments, longer times to degree completion, and periods of “stopping out” during one’s college trajectory, during which time individuals are working or looking for work (see also Hart, 2019; Turner, 2004). The growing “some college but no degree” group (Figure 4-6) also means that many young adults are entering work sooner and perhaps with less training or preparation than hoped for. Such trends mean that the transitions from school to work (and back again) are relevant when considering policies for economic mobility. In other words, people are dipping into and out of school and work throughout their lives, much more than current policy recognizes. However, not enough is known about how work experiences in high school and college shape career transitions and choices, and thus how these experiences hinder or facilitate economic mobility.
There is therefore a critical need to support transition-to-work pathways for large segments of the population throughout the life course (see Bailey et al., 2015; Holzer & Baum, 2017; Rosenbaum et al., 2006). This includes younger adults who do not plan to go to college (or pursue a bachelor’s degree), those completing or dropping out of any postsecondary education, and any adults who want to change jobs or need to transition into different fields because of changing labor demands. Given longer lifespans, growing numbers of current U.S. workers are likely to pursue further education and training throughout their lives (Stevens et al., 2022). Yet no coherent policy approach is in place to best support the economic mobility of students and workers during these transitions, both for those with a bachelor’s degree and for those without one or who hold a sub-baccalaureate credential (Gardyan et al., 2024).
TABLE 4-1 Proportion of College Students Who Worked, by Birth Cohort, 1940–2002
| Birth Cohort | ||||||||
|---|---|---|---|---|---|---|---|---|
| 1940 | 1950 | 1960 | 1970 | 1980 | 1990 | 2000 | 2002 | |
Proportion employed (not self-employed) | 0.41 | 0.42 | 0.48 | 0.55 | 0.58 | 0.51 | 0.51 | 0.54 |
Proportion worked at least 1 week last year | 0.82 | 0.86 | 0.86 | 0.88 | 0.85 | 0.74 | 0.73 | 0.74 |
Proportion worked at least 14 or more weeks last year | 0.46 | 0.52 | 0.59 | 0.66 | 0.68 | 0.56 | 0.51 | 0.54 |
NOTES: The sample includes students in college, measured at age 20. Person weights were used for all waves. College students are defined as persons who were in college. For U.S. Census waves 1960–1980, this is defined as persons who were attending college (identified using gradeatt). For U.S. Census and American Community Survey (ACS) waves greater than 1990, this includes persons whose educational attainment is greater than or equal to grade 12 and less than or equal to 3 years of college and who were in school (identified using educ). U.S. Census and ACS waves after 2000 additionally include persons who report their grade as college undergraduate or 1st to 4th year of college (identified using gradeattd). The first row of the table shows whether students were employed or not. Students are coded as 0 if they were unemployed, not in the labor force, or self-employed, and 1 if they were employed (but not self-employed) (identified using empstat and classwkr). The second row of the table shows the proportion of students who worked at least 1 week in the prior year. Students are coded as 0 if they did not work at least 1 week in the prior year and 1 if they worked 1 or more weeks in the prior year (identified using wkswork2). The third row of the table shows the proportion of students who worked at least 14 weeks in the prior year, included to avoid confusing changes in the proportion of students who work seasonally (e.g., summer internships) with changes in the proportion of students who work more than a single season. Students are coded as 0 if they did not work at least 14 weeks, and 1 if they worked 14 weeks or more.
SOURCES: Estimates based on data from the U.S. Census (1960, 1970, 1980, 1990, and 2000) and the ACS (2010, 2020, and 2022), downloaded from IPUMS USA.
Other efforts help support labor market transitions for individuals outside of the education sector, including enlistment in the military (see Box 4-4) and job training programs. These are especially important for those who may not be interested in or perform well in educational institutions, those with some college who earned no degree, workers displaced because of labor market shocks, and others who want to move from low- to higher-wage employment. The existing evidence on job training programs, especially those targeted to youth or dislocated workers, shows mixed results (e.g., Stanley et al., 1998). However, more recent research indicates that these programs do provide positive benefits to participants. The multisite Career Academies randomized controlled trial, which used a random research design in a diverse group of high schools across the United States, showed that the programs (which combined academic and technical
SOURCES: Estimates based on data from the U.S. Census (1960, 1970, 1980, 1990, and 2000) and the American Community Survey (2010, 2020, and 2022), downloaded from IPUMS USA.
BOX 4-4
Enlistment in the U.S. Military as a Pathway to Upward Mobility
The postsecondary landscape in the United States is vast, such that the educational and training tracks highlighted in this chapter are not the only postsecondary pathways available to Americans completing high school. The military has historically been, and remains, a key social institution promising “individual opportunity” to millions of Americans (Bailey, 2009), especially in working-class and minority communities, for whom it provides valuable educational, training, and skill-development opportunities that can engender labor market success (Bailey & Sykes, 2018; Greenberg et al., 2022; Kleykamp, 2013; National Academies, 2019). Indeed, it is quite distinct from either education or training, separately, as a flexible postsecondary option. It often represents a transitionary stage in young people’s career trajectories, serving as a critical springboard to continued education and/or postservice employment (Kelty et al., 2010). However, it also can provide a stable and well-paying career path in its own right (Asch et al., 2010; Hosek et al., 2018), with defined criteria for advancement rooted in a meritocratic orientation toward skill-based promotion (Kelty et al., 2010).
Military service provides adults with access to educational benefits, such as tuition assistance, scholarships, and training programs, that can provide avenues for career advancement and social mobility upon leaving the military (Barr, 2019; National Academies, 2019; Skocpol, 1995). Likewise, military service provides training in a range of technical, leadership, and interpersonal skills that are valued in civilian employment sectors (Kleykamp, 2009), in addition to the positive “signaling” value of military service in the labor market (Bailey & Sykes, 2018). Beyond the direct mobility-relevant resources that the military provides vis-à-vis career advancement, it also provides adults with a degree of baseline economic and/or social stability that is necessary to pursue upward mobility within or across generations, as might be the case for the various health care, housing assistance, and retirement benefits that servicemembers and families receive both during and after military service (Chevan, 1989; Skocpol, 1995; Wilson & Kizer, 1997).
Extant research further suggests that these economic and social benefits can prove particularly valuable for upward mobility among socially disadvantaged men, who are historically overrepresented in the military (National Academies, 2019), although research shows that at least some of these benefits have been limited to White men (Greenberg et al., 2022; Sampson & Laub, 1996; Teachman & Tedrow, 2004; Turner & Bound, 2003). Greenberg et al.’s (2022) analysis of army applicants from 1990 to 2011—linked to tax records and other administrative data—is an example of recent empirical work suggesting that the military is a key institution for reducing the Black–White earnings gap.
curricula around a career theme and established partnerships with local employers) led to earnings gains of 11 percent (about $27,000 in 2024 dollars) on average, sustained through the 8-year follow-up, and primarily for young men (Kemple & Willner, 2008). Both experimental and quasi-experimental evaluations (Andersson et al., 2024; Fortson et al., 2017; Heinrich et al., 2008, 2013) find significant impacts on earnings of the Workforce Innovation and Opportunity Act Adult worker program, while training services had a minimal impact on earnings for participants in the Dislocated Worker program. In a meta-analysis of job training programs from a wide range of countries, Card et al. (2018) found increased rates of employment of 5–10 percent within 2–3 years after participation. The best indication of the impact of providing training to young people comes from the Schochet (2021) experimental evaluation of Job Corps; the study found that older participants (those who enrolled at ages 20–24) were more successful than individuals in the control sample, but that differences to the younger participants faded after the initial 3-year evaluation window.
The most promising evidence to date shows large earning benefits for participants in targeted training programs that provide participants the skills necessary to obtain a high-quality job with career advancement opportunities in health care, informational technology, or advanced manufacturing (Hendra et al., 2016). Katz et al. (2022) summarized the results from four experimental evaluations of sectoral training programs, showing they produce annual earnings gains of as much as 35 percent. Baird et al. (2019) find that a training program in New Orleans funded through the Department of Labor’s Workforce Innovation Fund (WIF) produced similar results for recently unemployed workers, while Bollinger and Troske (2023) found smaller returns at lower cost from an online training program in Louisville that was also funded through WIF.
SUMMARY, KEY CONCLUSIONS, AND RECOMMENDATIONS
Elementary and secondary education (i.e., K–12) is a critical building block period of cognitive and socioemotional development that is essential for future academic and labor market success, both through and independent of postsecondary education. Indeed, it is one of the most well-studied periods when it comes to understanding how education shapes mobility, as are interventions intended to identify core investments that improve and equalize mobility-relevant outcomes. The committee’s focus in this chapter is on the postsecondary stage, not because it is the most important point in the emergence of inequities in education and training, but because it requires significantly more attention from research and policy.
Postsecondary educational attainment—and, especially, the attainment of a 4-year bachelor’s degree—is central to the understanding of the economic and social mobility in the United States. In effect, college has become something of a prerequisite to the subsequent maintenance of economic well-being and security within and across generations. The economic payoff of a college degree is also greater in the United States than in any other rich democracy. The earnings gap between people with a bachelor’s degree and those with lower levels of schooling has grown since the late 1970s, partly driven by a growing demand for highly educated workers that was not met by comparable supply. It is important to note that a bachelor’s degree, and not just college attendance, is a dividing line in the U.S. income distribution; those with some college education or with a sub-baccalaureate credential (associate’s degree or a certificate) have earnings closer to high school graduates’ than to those with a bachelor’s degree.
Trends in postsecondary attainment mask substantial inequality in college enrollment and college completion by family income. The probability of attending and graduating from college strongly depends on household income, and this income gap has remained large across cohorts. Disparities in college attendance, and especially college graduation, by race and ethnicity are also pronounced. There is a growing female advantage in college attainment, which will likely have broader consequences for intergenerational processes involving fertility, children’s educational opportunities, and growing gaps between families in which both parents have high or low levels of schooling.
Conclusion 4-1: Postsecondary education in the United States is a very strong predictor of economic well-being and is a critical determinant of intergenerational mobility. However, there are considerable disparities in college enrollment and completion by family income, location of residence, and race and ethnicity. There are also growing disparities by gender, favoring women, the consequences of which are poorly understood.
Recommendation 4-1: Researchers should examine the implications for economic and social mobility of growing gender differences in college completion.
It is not possible with existing data sources to annually measure the association between parents’ income and bachelor’s degree attainment—a critical fact of intergenerational mobility. One strategy for addressing these data limitations is using existing sets of large, high-quality administrative data to supplement currently administered surveys.
Conclusion 4-2: Existing data sources cannot be used to properly evaluate current changes in the association between parent’s income and bachelor’s degree attainment. This data limitation can be addressed by linking survey data with administrative data.
The U.S. postsecondary system is heterogeneous, decentralized, and stratified. It comprises thousands of institutions that vary by institutional control, mission, and degrees or credentials offered. Colleges vary dramatically in their inputs (spending per student, student preparation) and outcomes (graduation rates, economic payoff for graduates). Furthermore, the most disadvantaged students attend the institutions with the fewest resources and the worst outcomes. Although a college education can result in a large economic payoff, there is enormous variation around the averages. Like any investment, education is not without risk. Risk is particularly salient in the sub-baccalaureate sector, which includes both public community colleges and private for-profit schools; the students in this sector are also the most disadvantaged. A key question for research and policy, therefore, is whether U.S. postsecondary education serves as an engine for upward economic mobility by disentangling students from low-income backgrounds from their social origins, or if it functions as an intergenerational replicator of inequality by providing privileged access to wealthy families (including, among other things, through legacy admissions at elite colleges and tax benefits to reduce the costs of higher education). The answer to this question requires considering variation across the vast and heterogeneous postsecondary sector, with broad-access universities playing a different role from that of selective institutions.
As tuition prices have risen, the federal government has stepped in to assist students and families. Some of this aid has taken the form of grants, but much has been in the form of student loans. Borrowing for college is now much more common than it was just a few decades ago. The shift has been particularly marked at community colleges, where traditionally, students did not borrow for their educations. This may have consequences for mobility because it shifts onto the most disadvantaged students the cost (and risks) of postsecondary education. There is extensive research estimating how college costs, borrowing, default, graduation, or labor market returns differ across sectors and socioeconomic status. To the committee’s knowledge, however, no research has integrated these estimates into a comprehensive, distributive analysis of the net costs, benefits, and risks of college.
Conclusion 4-3: Although the attainment of a 4-year bachelor’s degree is a very strong predictor of economic well-being and security, postsecondary education has become an increasingly risky proposition for
many adults and families, especially those who have low incomes and are racial minorities. Broad-access institutions, certificate programs, and the growth of for-profit schools and other educational providers has increased the menu of options but has not necessarily increased completion rates or returns.
Recommendation 4-2: Researchers should conduct comprehensive, distributive analyses of the economic costs, benefits, and risks of college and explore the question of the extent to which U.S. postsecondary education is a replicator of intergenerational inequality rather than an engine for intergenerational mobility. Attention should be paid to variations in returns across the heterogeneous postsecondary sector, with broad-access institutions playing a central role for the vast majority of the population, different from that of more elite and selective universities.
In the United States, students are funded by the same federal grant and loan programs whether they are pursuing career and technical training at a community college or a bachelor’s degree at a university. In much of the world, by contrast, the funding models for the baccalaureate and sub-baccalaureate sectors are distinct. Baccalaureate students are typically charged tuition and take out loans, while this is rarely true for students in the sub-baccalaureate sector. Organizational and funding models in other parts of the world may provide useful insights for the United States.
Recommendation 4-3: Researchers should explore whether postsecondary funding models in other countries—especially with regard to sub-baccalaureate education—are more effective in generating economic mobility than the U.S. model.
There is a large body of rigorous evidence on how to stimulate student demand for postsecondary education, and research now needs to move to designing policies that stimulate demand within particular populations (defined, e.g., by level of academic preparation, race and ethnicity, income level, and age) and settings (e.g., rural). On the “supply side,” the postsecondary sector in the United States has grown through the establishment and expansion of schools that receive relatively few resources but serve students with the most challenges, in contrast to the more redistributive K–12 education funding.
Better understanding is needed on how to improve the quality of postsecondary education. A vast literature has examined the effect of inputs, policies, and practices on K–12 education. However, the analogous literature addressing these questions in the postsecondary setting is astoundingly
thin. Research on postsecondary education has focused overwhelmingly on who goes to college, whether they finish, who pays, how much they pay, and what happens at the entry and exit points—but it rarely looks at what is happening in college and what kinds of programs and inputs work for which students. Given the heterogeneity in returns to college, the committee calls for a comparative body of work that will address questions about the quality of higher education, including the ways in which curricula, pedagogical techniques, and class size improve learning and graduation rates as well as job placement, career growth, and earnings.
Recommendation 4-4: Researchers should study ways to stimulate demand for postsecondary education for particular populations and settings. Evidence is needed about specific populations defined by level of academic preparation, race and ethnicity, income levels, residential location, and age.
Recommendation 4-5: Researchers should study the effects of inputs, policies, and practices (e.g., curricula, pedagogical techniques, class size, connections to employment opportunities) on the quality of postsecondary education and the implications for economic and social mobility.
People transition into and out of school and work throughout their lives, including the growing “some college” group without bachelor’s degrees, much more than currently policy recognizes. And, although transitions to work and transitions between careers are important to shaping economic mobility, they receive far less attention than the transition into college. This is despite the rapidly changing technological landscape and the fact that many students end up working sooner than they expect (given low college completion rates) and will have longer working lives. It is important to recognize the need for multiple pathways to mobility, commensurate with people’s many starting points.
There is considerable evidence that job training programs, especially sectoral employment approaches, can increase earnings. Career and technical training, including that for dislocated workers, was once funded by the U.S. Department of Labor in the form of free training programs; now, however, such training is largely the responsibility of the postsecondary sector. It is important to understand how this has affected individual welfare, incentives to invest in education, and economic mobility. A better data infrastructure is also needed to track participants nationally and to incorporate job training data into other longitudinal record data efforts. There is also a need to understand the role of alternative credential programs, immersive training programs (e.g., educational bootcamps), and certifications for
preparing for the transition to work or changes in careers; this sector has grown significantly, and little is known about student experiences, quality of programs, or labor market returns.
Conclusion 4-4: People transition between school and work and between careers throughout their lives and in different ways. Economic and social mobility can be enhanced by recognizing the need for multiple pathways to mobility beyond a college degree, commensurate with people’s many starting points and transitions.
Recommendation 4-6: Researchers should study the effectiveness of programs and policies to support the trajectories of those without bachelor’s degrees, as well as multiple transitions and pathways between schooling, training, and work.
This page intentionally left blank.


