Veterans, Prescription Opioids and Benzodiazepines, and Mortality, 2007–2019: Three Target Trial Emulations (2025)
Chapter: Appendix F: Report of Preliminary Results: Opioid Dose Reduction Trial Emulation
F
Report of Preliminary Results: Opioid Dose Reduction Trial Emulation
Erin E. Krebs, MD, MPH; Barbara Clothier, MS; Elizabeth S Goldsmith, MD, PhD; Amy S Bohnert, PhD; Brian C. Martinson, PhD; Siamak Noorbaloochi, PhD
ABSTRACT
Introduction: We conducted an observational study designed to emulate a randomized parallel-arm trial using an existing cohort of Department of Veterans Administration (VA) patients who received long-term opioid therapy (LTOT) in 2016. Aims were to 1) compare effects of each of two active opioid dose reduction strategies (small reduction, large reduction) vs. no dose reduction control on all-cause mortality (primary outcome) and suicide mortality (secondary outcome) in VA primary care patients receiving LTOT and 2) to assess for varying treatment effects in subgroups defined by presence or absence of concomitant benzodiazepine treatment at baseline.
Methods: Eligibility was determined in 2016. Patients who had received opioids for at least 6 months and had a baseline daily dose of at least 20 morphine-equivalent (ME) mg were eligible for inclusion. Active treatment strategies were 1) small dose reduction (decrease of 15% to <50% in daily dosage from baseline) and 2) large dose reduction (decrease of 50% or more from baseline); the control group was no dose reduction (<15% decrease from baseline). Treatment group assignment was determined during a six-month treatment implementation period and outcomes were assessed over 12 months (including the implementation period). Randomization was emulated by cloning of patients. Inverse-probability-of-censoring weights (IPCW) were created to address selection bias introduced by censoring of clones. Weighted Cox proportional hazards models were used to separately compare small dose reduction vs. control and large dose reduction vs. control. Analyses were stratified by baseline opioid daily dose category and presence or absence of benzodiazepine treatment at baseline.
Results: Over 12 months, 9,646 (4.7%) patients died of all causes, including 208 who died of suicide. Overall, there was no difference in risk of all-cause mortality between small reduction and control groups (HR 1.01, 95% CI 0.98, 1.04). The large dose reduction group had a small, statistically significant increase in all-cause mortality risk compared to the control group (HR 1.23; 95% CI 1.20, 1.27). Results for both small reduction vs. control and large reduction vs. control were similar among patients with and without concomitant benzodiazepine treatment at baseline. There was no difference in risk of suicide mortality for small reduction vs. control (HR 1.09, 95% CI 0.89, 1.35) or large reduction vs. control (HR 1.01, 95% CI 0.77, 1.33). Among patients who died during one-year follow-up, there was no difference in risk of suicide death (as opposed to other cause of death) for either treatment comparison.
Discussion: This study has several important limitations. First, results may be dependent on design decisions such as exposure definitions and time windows. The large dose reduction group in particular was heterogeneous and likely included patients with unplanned gaps in opioid dispensing, as well as those with planned dose reduction or discontinuation. Second, the trial emulation approach does not eliminate bias caused by unmeasured confounding. Factors such as opioid misuse or diversion are important confounders that are not adequately captured in data. Third, we had limited power to detect differences in suicide.
Conclusions: Results should be considered preliminary
INTRODUCTION
Long-term opioid therapy (LTOT) is associated with serious harms, including include death due to unintentional overdose and suicide, as well as all-cause and out-of-hospital mortality. Studies suggest harms increase with longer duration of therapy, higher dosages, and concomitant benzodiazepine use. Following recognition of a U.S. opioid crisis defined by epidemic levels of opioid-overdose deaths, numerous policy and practice initiatives have encouraged opioid dose reduction or discontinuation for patients receiving LTOT. One goal of these initiatives is to reduce opioid-related mortality. At the same time, clinical concerns have been raised about potential negative consequences of opioid dose reduction, especially aggressive or abrupt reductions that could cause opioid withdrawal or psychiatric destabilization. In theory, any mortality benefits (reduction in deaths) due to opioid dose reduction would accrue gradually over time, whereas risks (increase in deaths) would manifest early. A substantial early increase in risk of death could preclude future benefits. Using an approach recommended by a National Academies of Sciences, Engineering, and Medicine committee, this study aimed to evaluate effects of opioid dose reduction strategies on all-cause mortality and suicide mortality among VA patients receiving LTOT with and without concomitant benzodiazepine treatment (NASEM, 2019).
TRIAL EMULATION DESIGN
This observational study was designed to emulate a parallel-arm randomized controlled trial (the “target trial”) to compare effects of each of two active opioid dose reduction strategies (small reduction, large reduction) vs. control (no dose reduction) on mortality in patients treated with LTOT for chronic pain. The target trial has a pragmatic approach to implementation of the active interventions, in which opioid prescribers are instructed to work with patients to implement the assigned dose reduction strategy within 6 months. Table F-1 shows design features of the target trial and observational trial emulation study.
ELIGIBILITY
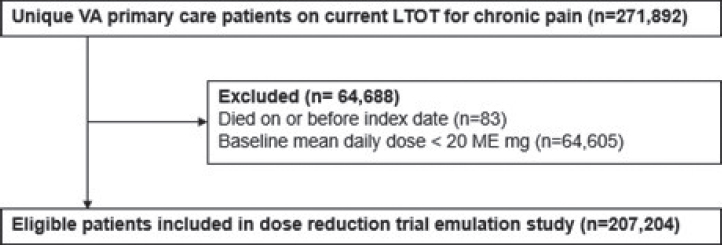
This study used data from the existing Effects of Prescription Opioid Changes in Veterans (EPOCH) population cohort of VA primary care patients on current long-term opioid therapy for chronic pain. (Krebs et al., 2020) Eligibility for the EPOCH cohort was determined using seven data extractions (February 2016 and monthly from June to November 2016) from the VA Corporate Data Warehouse (CDW). EPOCH population cohort eligibility criteria are described in Annex 1. Figure F-1 shows how patients were selected from the EPOCH cohort for this present study.
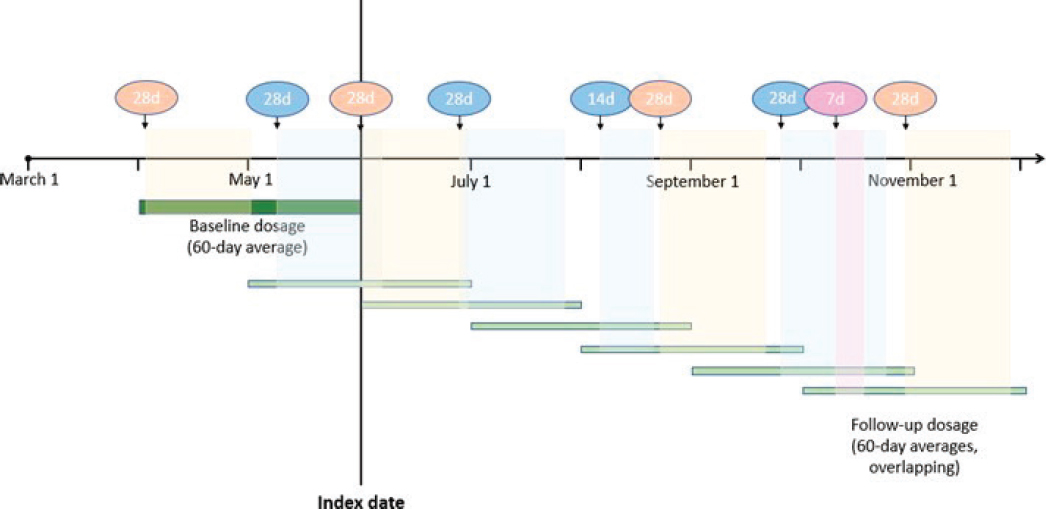
- Opioid prescriptions were determined from VA outpatient pharmacy dispensing data. Opioid dosage was standardized by calculating morphine-equivalent (ME) mg using CDC-recommended conversion factors (Annex 2). Average daily doses were calculated within 60-day windows to provide stable estimates in the presence of such factors as overlapping prescriptions and variable dispensing dates, while allowing for detection of dosage changes (Annex 3). Baseline opioid daily dosage was calculated as the total dosage (sum of ME mg for all opioids dispensed in the 60 days before and including the index date prescription) divided by the number of days from the first opioid dispensed in the window to the index prescription’s
TABLE F-1 Target Trial and Observational Trial Emulation Design Teatures
| Target trial design | Observational trial emulation design | |
|---|---|---|
| Eligibility | Inclusion criteria: VA primary care patients receiving long-term opioid therapy for chronic pain with current daily dose of ≥20 ME mg. Exclusion criteria: Opioids for end of life care, active cancer, or opioid use disorder; life expectancy < one year; moderate-severe cognitive impairment; nursing home residence. | Inclusion criteria: Same Exclusion criteria: Opioid use disorder treatment, dementia diagnosis or treatment, cancer treatment, end-of-life care, or adult day care in the past 12 months; nursing home residence. |
| Opioid treatment strategies | Small dose reduction (decrease of 15% to <50% from baseline) | Small dose reduction (decrease of 15% to <50% from baseline) |
| Large dose reduction (decrease of 50% or more from baseline) | Large dose reduction (decrease of 50% or more from baseline) | |
| Control (no dose reduction) | Control (<15% decrease from baseline) | |
| Treatment assignment | Blocked randomization with blocks defined by baseline daily dose category. | Randomization emulated by cloning of patients. Analysis stratified by baseline daily dose category. |
| Treatment implementation | Six-month period for individualized implementation of target dose reduction | Six-month treatment implementation period |
| Outcome | Time to all-cause mortality (primary); time to suicide mortality (secondary) | Same |
| Follow up | Follow up for one year following randomization date | Follow up for one year following index date |
| Contrast | Intention-to-treat effect and per-protocol effect of each dose reduction strategy vs. control | Per-protocol effect of each dose reduction strategy vs. control |
- end date (i.e., dispensing date + days’ supply). Average daily dosage at successive monthly time points after the index date was calculated similarly; each month, the total dosage for the prior 60 days was divided by the number of days from the first dispensing date to the end date of the last prescription dispensed in the window. If no opioids were dispensed in the 60-day window, the daily dosage was considered to be zero. Baseline opioid daily dosage was categorized using conventional cutoffs into three groups: 20 to <50 mg, 50 to <100 mg, ≥100 mg. Analyses treated opioid daily dosage as a continuous variable in 10 ME mg increments.
- Benzodiazepine treatment at baseline was defined as any benzodiazepine prescription dispensed in the 60 days before and including the index date.
- All-cause mortality and survival were evaluated using the CDW patient table and vital status file. The CDW patient table was used as the primary source for date of death, with the vital status file as a second source. Suicide mortality was evaluated using ICD-10 codes X60-X84 and Y87.043 in National Death Index (NDI) cause-of-death data (Ilgen et al., 2016).
EMULATION METHODS
We took the following steps to implement the trial emulation approach (Hernán and Robins, 2016):
- First, we determined whether each patient received one of the two active mutually exclusive opioid treatment strategies (small reduction or large reduction) within the 6-month treatment implementation period. Those who received neither active strategy were in the control (no reduction) group.
- Second, we created two datasets corresponding to the two sets of analyses comparing 1) small dose reduction vs. control and 2) large dose reduction vs. control.
KEY VARIABLES
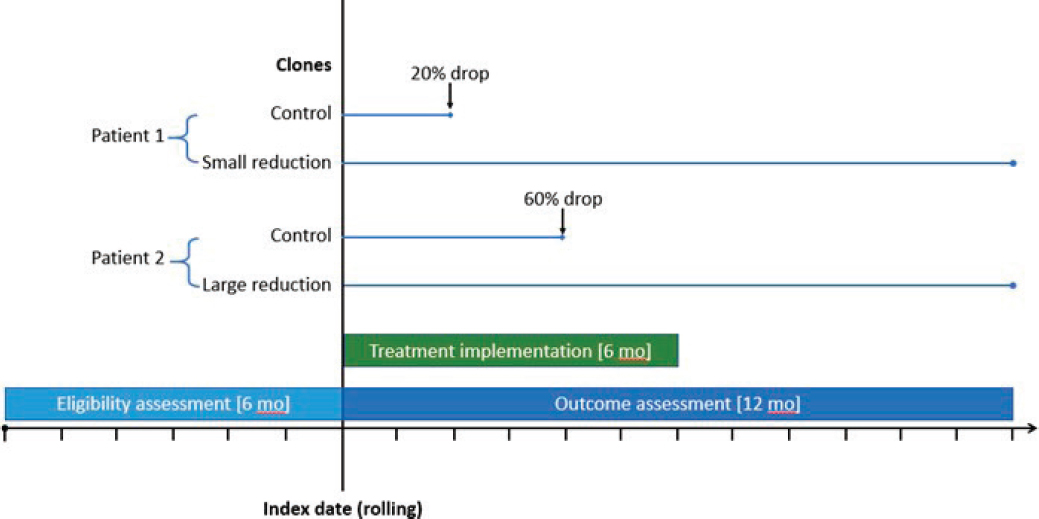
- Within each dataset, patient records were replicated at the index date, creating “clones” that were assigned to the alternate treatment group (active dose reduction strategy or control). Clones assigned to an active dose reduction strategy were censored at 6 months (the end of the treatment implementation period) when the patient did not meet criteria for the active treatment strategy by 6 months. Clones assigned to the control group were censored when the patient met criteria for the active dose reduction strategy during the treatment implementation period. Annex 4 provides an illustration of cloning and censoring.
- Inverse-probability-of-censoring weights (IPCW) were created using a Cox regression model for each set of analyses. We used standardized differences to examine balance in potential confounding variables between active treatment and control in each dataset (Annex 5). We found only small differences in weighted variables, which indicates good balance of measured confounders.
- Two sets of IPCW-weighted Cox proportional hazards models were used for analysis of cloned data, to separately compare 1) small dose reduction vs. control and 2) large dose reduction vs. control. In each set, pre-planned analyses were conducted for baseline opioid daily dose strata (20 to <50 mg, 50-<100 mg, and 100+ mg) and presence or absence of benzodiazepine treatment at baseline
- Because cloning artificially increases the number of events, model-based standard errors (SE) may be underestimated. (Maringe et al., 2020) To check for this problem, we used non-parametric bootstrapping to obtain SE estimates for selected results. We found that bootstrapping did not produce substantially different SE estimates.
RESULTS
Baseline characteristics of eligible patients by treatment assignment and by 12-month vital status are shown in Annex 6 and Annex 7, respectively. Of the 207,204 eligible patients, 9,646 (4.7%) died of all causes during the year after the index date (Table F-2). The cause of death was suicide for 208 (2.2%) of deaths overall, including 18 (2.1%) of 851 patients who died with less than 1 month of observation. Suicide was the cause of death for 2.3% of all deaths in the control (no dose reduction) group, 2.7% of deaths in the small dose reduction group, and 1.5% of deaths in the large dose reduction group.
Table F-3 shows the main results of the trial emulation. During 1-year follow-up, there was no difference in risk of all-cause mortality between small reduction and control groups overall (HR 1.01, 95% CI 0.98, 1.04) or in the low and moderate baseline daily dose subgroups. There was a small, statistically significant increase in risk for the small reduction group within the high baseline daily dose subgroup.
All-cause mortality was statistically significantly higher for the large dose reduction group than the control group overall (HR 1.23; 95% CI 1.20, 1.27) and within each of the baseline daily dose subgroups.
Results for both small reduction vs. control and large reduction vs. control were similar among patients with and without concomitant benzodiazepine treatment at baseline.
| Patients with at least one follow-up month | Patients who survived less than one month n=851 | |||
|---|---|---|---|---|
| Small dose reduction group n=29,835 | Large dose reduction group n=46,734 | Control (no dose reduction) group n=129,784 | ||
| All cause death, n (column %) | 1056 (3.5%) | 2008 (4.3%) | 5731 (4.4%) | 851 (100%) |
| Suicide death, n (column %) | 28 (0.09%) | 30 (0.06%) | 132 (0.10%) | 18 (2.1%) |
| Median 1-year survival in months [range] | 7 [1-12] | 8 [2-12] | 6 [2-12] | NA |
NOTE: NA = not applicable.
| Small dose reduction group n=29,835 | Large dose reduction group n=46,734 | |
|---|---|---|
| Overall | 1.01 (0.98, 1.04) | 1.23 (1.20, 1.27) |
| Baseline daily dose category | ||
| Low (20 to < 50 mg) | 0.98 (0.94, 1.02) | 1.22 (1.17,1.27) |
| Moderate (50 to <100 mg) | 1.01 (0.95,1.08) | 1.25 (1.18,1.33) |
| High (100+ mg) | 1.10 (1.02,1.19)* | 1.25 (1.16, 1.35) |
| Baseline benzodiazepine treatment | ||
| Benzodiazepine | 1.06 (0.98, 1.15) | 1.22 (1.13, 1.31) |
| No benzodiazepine | 1.01 (0.97, 1.04) | 1.23 (1.19, 1.27) |
* Bootstrapped 95% CI =1.02, 1.17.
During 1-year follow-up, there was no difference in risk of suicide mortality for small reduction vs. control (HR 1.09, 95% CI 0.89, 1.35) or large reduction vs. control (HR 1.01, 95% CI 0.77, 1.33). Among patients who died during 1-year follow-up, there was no difference in risk of suicide death (as opposed to other cause of death) for small reduction vs. control (HR 1.11, 95% CI 0.89, 1.38) or large reduction vs. control (HR 0.88, 95% CI 0.71, 1.09).
EXPLORATORY ANALYSIS OF DOSING CHANGES
To better understand the main results, we explored opioid dosing changes within the assigned treatment groups. Figure F-2 shows the trajectories of mean daily dosage by treatment group within baseline daily dose categories.
By definition, only the large dose reduction group includes patients whose opioids were discontinued during the 6-month treatment implementation period. Of 46,734 patients in the large dose reduction treatment group, 30,802 (65.9%) had their daily opioid dosage reduced to zero (i.e., no dispensed opioids in a 60-day window) at some point during the 6-month treatment implementation period. Of these patients, more than half (n=16,646, 53.7%) subsequently filled opioid prescriptions during the remainder of the 12-month study period. Among those patients who had a zero dosage and subsequently filled additional opioid prescriptions, most restarted opioids within 1 month (Table F-4). This suggests the large dose reduction treatment group is heterogeneous in terms of opioid prescribing, comprising patients with reduction to a substantially lower dose, those with opioid discontinuation, and those with prolonged gaps or variability in opioid dispensing.
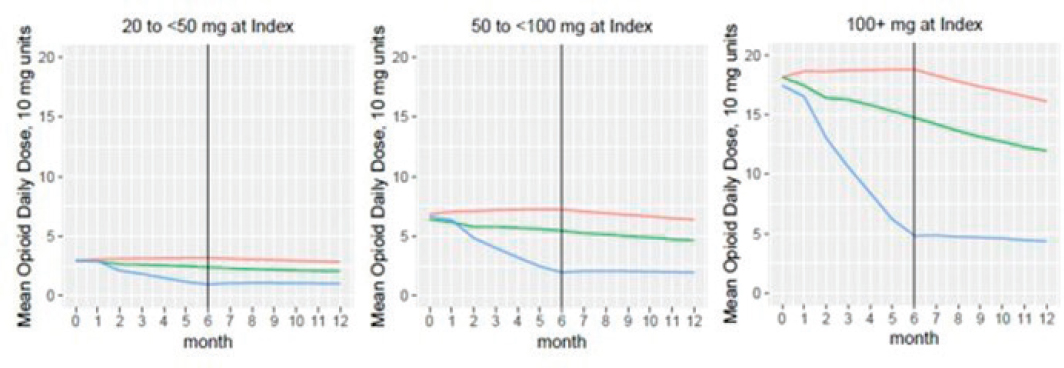
NOTES: Figure legend: red = control (no reduction) group, green = small reduction group, blue = large reduction group.
| Months following zero dosage | 1 | 2 | 3 | 4 | 5 | 6 | 7 | 8 | 9 | 10 |
| Number (%) of patients who restarted | 8978 (53.9%) |
2924 (17.6%) |
1466 (8.8%) |
976 (5.9%) |
742 (4.5%) |
537 (3.2%) |
403 (2.4%) |
272 (1.6%) |
169 (1.0%) |
79 (0.5%) |
To explore potential mortality risk within the large dose reduction treatment group, we repeated weighted Cox models with two subsets of patients: (a) those whose daily dosage remained more than 0 mg (n=15,932) and (b) those whose dosage decreased to 0 mg (n=30,802). Results are in Table F-5. In the subgroup with dosage > 0 mg, there was no difference in mortality risk between large dose reduction treatment and control. In the subgroup with a dosage of zero, risk of all-cause mortality was higher for the treatment group vs. control.
| Small dose reduction group N=29,835 | Large dose reduction group N=46,734 | ||
|---|---|---|---|
| Daily dosage > 0 mg N=15,932 |
Daily dosage = 0 mg N=30,802 |
||
| Overall | 1.01 (0.98, 1.04) | 1.03 (0.97, 1.10) | 1.33 (1.30, 1.38) |
| Baseline daily dose category | |||
| Low (20 to < 50 mg) | 0.98 (0.94, 1.02) | 1.03 (0.98, 1.07) | 1.28 (1.23, 1.33) |
| Moderate (50 to <100 mg) | 1.01 (0.95,1.08) | 1.02 (0.95, 1.09) | 1.41 (1.32, 1.50) |
| High (100+ mg) | 1.10 (1.02,1.19) | 1.07 (0.98, 1.16) | 1.46 (1.35, 1.58) |
LIMITATIONS AND NEXT STEPS
- The presented results are design-dependent and should be interpreted with care. By design-dependent, we mean that results are affected by decisions including intervention definitions, assignment of interventions based on a single dosage decrease during the implementation period, the chosen baseline calendar year (2016), the 6-month implementation period and relatively short (12 months) follow-up time, and the treatment of patients with apparent opioid discontinuation (defined as zero daily dosage).
- The trial emulation approach evaluates effects of treatment strategies defined at a point in time within a pre-defined treatment implementation period, but prescribing changes are dynamic in reality. Further, variability in opioid dosing/dispensing is associated with overdose and not addressed by this study design (Glanz et al., 2019).
- Approaches to defining opioid dose change exposures have tradeoffs in terms of sensitivity for detecting changes in the presence of common factors as multiple opioids, overlapping prescriptions, and variable dispensing dates. Seemingly small changes in exposure definitions can affect results.
- The study population is large and diverse. Opioid dose reduction strategies may have differing effects in various patient subgroups defined by clinical conditions (e.g., substance use disorder) or characteristics (e.g., old age).
- The trial emulation approach does not eliminate bias caused by unmeasured confounding. For example, common reasons for opioid dose reduction and discontinuation are behaviors (e.g., opioid misuse) and clinical signs (e.g., sedation) that increase the risk of death and are not well captured in CDW data.
- Suicide deaths are rare events, so we have limited power to detect differences between treatments.
We are using alternative analytic approaches to model dose decreases both as a static (non-time-varying) intervention and as a dynamic time-varying intervention. Completion of additional analyses will provide context for interpretation of trial emulation results.
ACKNOWLEDGEMENTS
This work was supported by Merit Review Awards # I01 HX001752 and #I01 HX003063 from the United States (U.S.) Department of Veterans Affairs Health Services Research and Development (HSR&D) Service. It was submitted as a report to VA HSR&D on 4/30/2021 and has not been peer-reviewed. The contents do not represent the views of the U.S. Government or the U.S. Department of Veterans Affairs.
REFERENCES
Glanz, J. M., I. A. Binswanger, S. M. Shetterly, K. J. Narwaney, and S. Xu. 2019. Association between opioid dose variability and opioid overdose among adults prescribed long-term opioid therapy. JAMA Netw Open 2(4):e192613. https://doi.org/10.1001/jamanetworkopen.2019.2613.
Hernán, M. A., and J. M. Robins. 2016. Using big data to emulate a target trial when a randomized trial is not available. American Journal of Epidemiology. 183(8):758-764. https://doi.org/10.1093/aje/kwv254.
Ilgen, M. A., A. S. B. Bohnert, D. Ganoczy, M. J. Bair, J. F. McCarthy, and F. C. Blow. 2016. Opioid dose and risk of suicide. Pain 157(5):1079-1084. https://doi.org/10.1097/j.pain.0000000000000484.
Krebs, E. E., B. Clothier, S. Nugent, A. C. Jensen, B. C. Martinson, E. S. Goldsmith, M. T. Donaldson, J. W. Frank, I. Rutks, and S. Noorbaloochi. 2020. The Evaluating Prescription Opioid Changes in Veterans (EPOCH) study: Design, survey response, and baseline characteristics. PLoS One 15(4):e0230751. https://doi.org/10.1371/journal.pone.0230751.
Maringe, C., S. Benitez Majano, A. Exarchakou, M. Smith, B. Rachet, A. Belot, and C. Leyrat. 2020. Reflection on modern methods: Trial emulation in the presence of immortal-time bias. Assessing the benefit of major surgery for elderly lung cancer patients using observational data. International Journal of Epidemiology 49(5):1719-1729. https://doi.org/10.1093/ije/dyaa057.
NASEM (National Academies of Sciences, Engineering, and Medicine), 2019. An approach to evaluate the effects of concomitant prescribing of opioids and benzodiazepines on veteran deaths and suicides. Washington, DC: The National Academies Press. https://doi.org/10.17226/25532.
ANNEX 1. EPOCH POPULATION COHORT INCLUSION AND EXCLUSION CRITERIA
The study population was defined as community-dwelling VA primary care patients receiving long-term opioid analgesic therapy (LTOT) for chronic pain.
| Criteria | Definition |
|---|---|
| Inclusion criteria | |
| VA primary care | At least one encounter in a primary care clinic (stop codes 322, 323) within the 12 months before the most recent opioid prescription. |
| Current long-term opioid therapy | A qualifying opioid analgesic* dispensed within the prior 30 days and 150 days’ supply of qualifying opioid with no gaps >40 days between fills in the 180 days before the most recent dispensing date. |
| Exclusion criteria | |
| Opioid use disorder treatment | Any outpatient encounter in prior 12 months with a code for Opioid Substitution (523). |
| Dementia | Any outpatient encounter in prior 12 months with a code for Dementia Clinic (320); any problem list or outpatient encounter in the prior 12 months with any of the following diagnosis codes: ICD-9 290, 290.1, 290.11, 290.12, 290.13, 290.2, 290.21, 290.3, 290.4, 290.41, 290.42, 290.43, 290.8, 290.9, 331, 331.1, 331.11, 331.19, 331.2, 331.6, 331.7, 331.82 or ICD-10 F01.5, F01.50, F01.51, F02.80, F02.81, F03.90, F03.91, G30.0, G30.1, G30.8, G30.9, G31.01, G31.09, G31.1,G31.83, R41.81 |
| Cancer treatment | Any outpatient encounter in prior 12 months with a code for Radiation Oncology/Therapy (149), Brachytherapy (158), or Oncology Tumor (316) |
| End-of-life care | Any outpatient encounter in prior 12 months with a code for Hospice Care (351) or Palliative Care (353) |
| Adult day care | Any outpatient encounter in prior 12 months with a code for Adult Day Health Care (190), Community Adult Day Health Care Follow-up (191) |
| Nursing home residence | An inpatient census record without a corresponding discharge; index opioid dispensed between admission and discharge dates for any of the following bed section codes: Respite Care NHCU (47), NH Short Stay Restorative (66), NH Short Stay Continuing Care (67), NH Short Stay Mental Health (68), NH Short Stay Dementia Care (69), Nursing Home Care (80), NH Short Stay Skilled Nursing (95), Hospice (96), Short Stay GRECC NHCU (100), Long Stay GRECC NHCU (101), Short Stay GRECC GEM NHCU (102), or Hospice for Acute Care (105) |
* See Annex 2. Opioid formulations and dosage conversion factors.
ANNEX 2. OPIOID FORMULATIONS AND DOSAGE CONVERSION FACTORS
| Opioid | Included formulation(s) | Conversion factor |
|---|---|---|
| Codeine | Capsule, elixir, tablet; sole ingredient and combination products including acetaminophen, butalbital, caffeine | 0.15 |
| Fentanyl | Patch | 7.2 |
| Hydrocodone | Capsule, elixir, tablet; sole ingredient and combination products including acetaminophen, ibuprofen; immediate release and sustained action | 1 |
| Hydromorphone | Suppository, tablet; immediate release and sustained action | 4 |
| Levorphanol | Tablet | 11 |
| Meperidine | Tablet | 0.1 |
| Methadone | Tablet, solution | 3 |
| Morphine | Capsule, solution, suppository, tablet; immediate release and sustained action | 1 |
| Oxycodone | Capsule, solution, tablet; sole ingredient and combination products including acetaminophen; immediate release and sustained action | 1.5 |
| Oxymorphone | Tablet; immediate release and sustained action | 3 |
| Pentazocine | Tablet | 0.37 |
| Tapentadol | Tablet; sustained action | 1 |
| Non-qualifying opioids with conversion factors if applicable for dosage calculations | ||
| Opioid | Non-qualifying formulation(s) and rationale | Conversion factor |
| All | Injectable solutions (indicated for acute or palliative care) | n/a |
| All | Combination products including antitussives or antihistamines (indicated for cough) | n/a |
| Buprenorphine | Patch (added to VA formulary in July 2016; limited use in VA) | 2.2 |
| Buprenorphine | Sublingual tablets and films (indicated for opioid use disorder) | n/a |
| Fentanyl | Lozenge (indicated for cancer or palliative care) | 0.13 |
| Tramadol | All formulations (weak opioid agonist) | 0.1 |
SOURCE: National Center for Injury Prevention and Control. CDC compilation of benzodiazepines, muscle relaxants, stimulants, zolpidem, and opioid analgesics with oral morphine milligram equivalent conversion factors, 2018 version. Available from: https://www.cdc.gov/drugoverdose/resources/data.html.
ANNEX 3. ILLUSTRATION OF OPIOID DOSAGE CALCULATIONS
Baseline daily opioid dosage was calculated as the total dosage for all opioids dispensed in 60 days before and including index date divided by the number of days from the first opioid dispensed in the window to the index prescription’s end date (i.e., dispensing date + days’ supply). Follow-up daily opioid dosage was calculated as the average daily dosage at successive calendar months: the total opioid dosage dispensed over the prior 60 days divided by the number of days from the first dispensing date in the window to the end date of the last prescription dispensed in the window.
The figure illustrates opioid dispensing data and calculation of baseline and follow-up opioid daily dosages for a hypothetical patient with an index date of June 1. For this patient, the average daily dosage for the December 1 time point was calculated using the three prescriptions that fell within the prior 60 days. The average daily dosage for the December 1 time point was calculated by summing the total dosage dispensed for the three prescriptions divided by the number of days from when the first prescription was released to when the third prescription was released plus the 28 days’ supply of the last prescription.
Dispensed opioid prescriptions are shown above the timeline, with d=days’ supply. 60-day dosage windows overlap as shown by the horizontal green bars. Different colors represent different opioid medications.
Prescriptions contribute to the overlapping 60-day average dose windows as shown by the shaded vertical bars.
ANNEX 4. ILLUSTRATION OF TRIAL EMULATION DESIGN
Eligibility is assessed over the 6 months prior to each patient’s index date. The treatment implementation period comprises the 6 months following the index date. Outcomes are assessed over the 12 months following the index date.
The figure shows the cloning and censoring approach for two example patients. Patient 1 had a 20% drop in opioid dose at month 2, causing the clone in the control arm to be censored, while the clone in the small reduction arm was followed until the end of outcome assessment at 12 months. Patient 2 had a 60% drop in opioid dose at month 4, causing the clone in the control arm to be censored, while the clone in the large reduction arm was followed until the end of outcome assessment at 12 months.
ANNEX 5. BALANCE OF WEIGHTED AND UNWEIGHTED COVARIATES
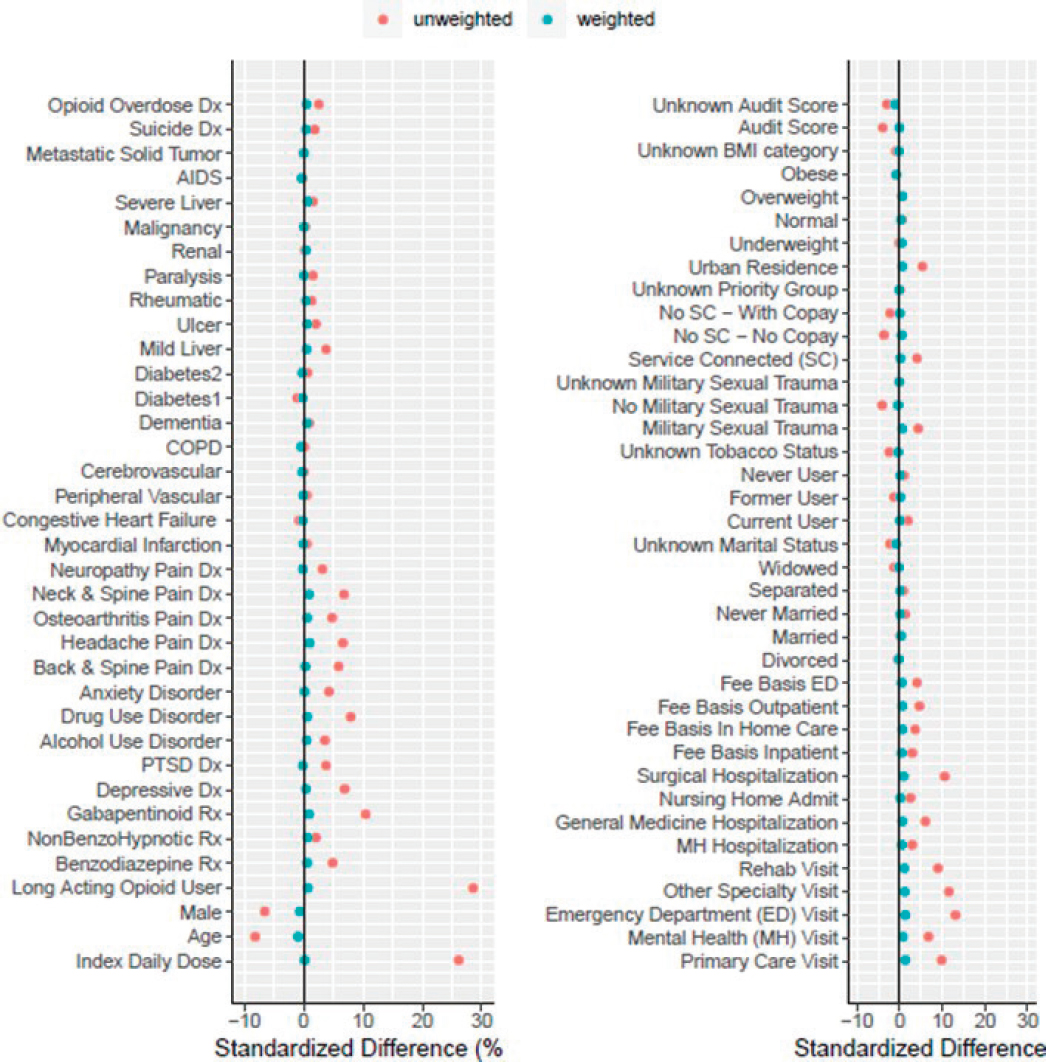
NOTE: AUDIT score and BMI were not included in final models due to missing data.
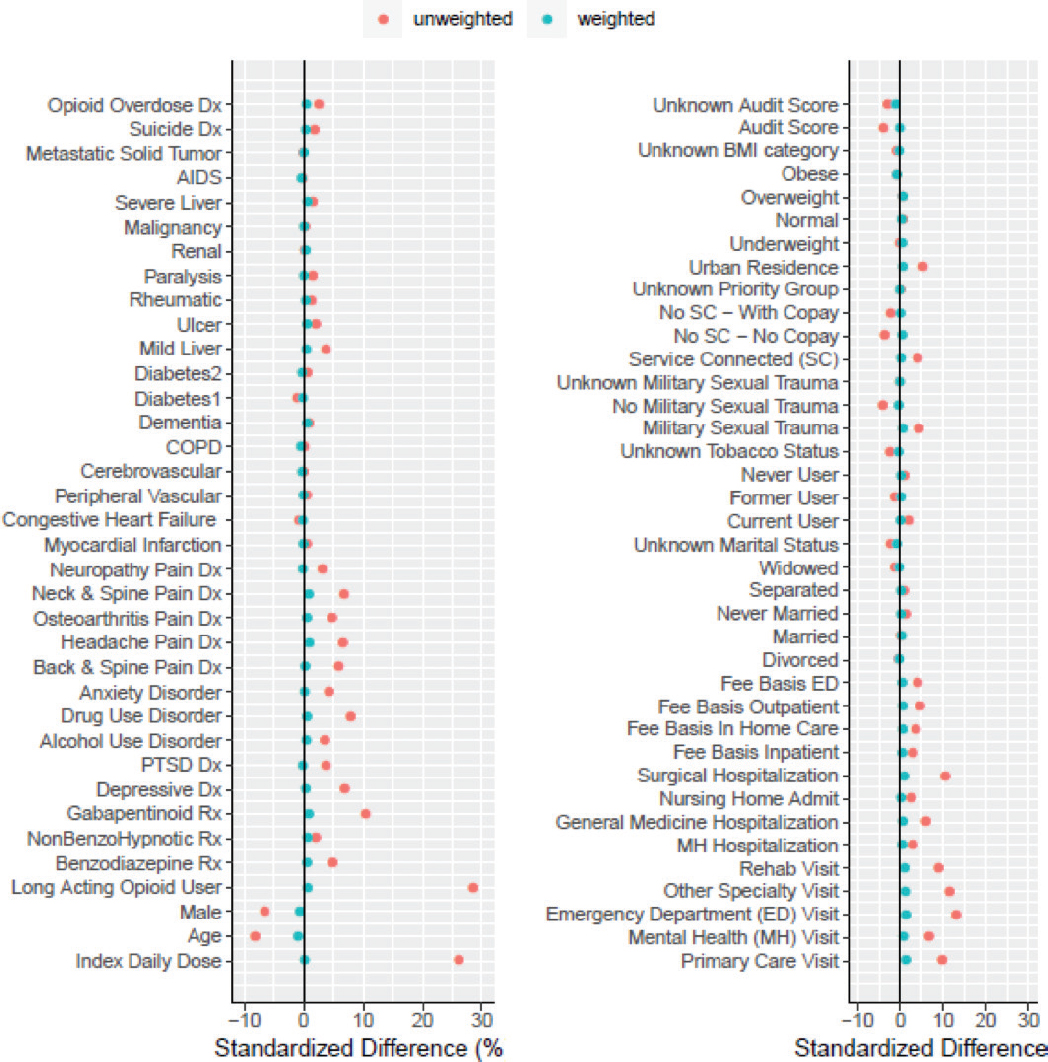
NOTE: AUDIT score and BMI were not included in final models due to missing data.
ANNEX 6: BASELINE CHARACTERISTICS BY TREATMENT GROUP
| Trial emulation treatment group defined by opioid daily dose change from baseline within 6 months | |||
|---|---|---|---|
| Characteristic | Large dose reduction N=46,734 (22.6%) | Small dose reduction N=29,835 (14.4%) | No dose reduction N=129,784 (62.6%) |
| Age in Years | 61.2 (12.4) | 61.6 (11.4) | 62.5 (11.2) |
| Sex, Male | 43101 (92.2%) | 27478 (92.1%) | 121600 (93.7%) |
| Race1 | |||
| White | 36193 (77.4%) | 23418 (78.5%) | 101857 (78.5%) |
| Black | 7092 (15.2%) | 4285 (14.4%) | 18295 (14.1%) |
| American Indian | 686 (1.5%) | 445 (1.5%) | 1935 (1.5%) |
| Asian | 148 (0.3%) | 94 (0.3%) | 386 (0.3%) |
| Pacific Islander | 486 (1.0%) | 298 (1.0%) | 1371 (1.1%) |
| Unknown | 2560 (5.5%) | 1614 (5.4%) | 7259 (5.6%) |
| Hispanic Ethnicity | |||
| Yes | 1905 (4.1%) | 1196 (4.0%) | 4673 (3.6%) |
| No | 43186 (92.4%) | 27593 (92.5%) | 120495 (92.8%) |
| Unknown | 1643 (3.5%) | 1046 (3.5%) | 4616 (3.6%) |
| Marital Status | |||
| Married | 23537 (50.4%) | 15640 (52.4%) | 68006 (52.4%) |
| Never Married | 4384 (9.4%) | 2646 (8.9%) | 11071 (8.5%) |
| Divorced | 14115 (30.2%) | 8775 (29.4%) | 38378 (29.6%) |
| Separated | 2170 (4.6%) | 1340 (4.5%) | 5605 (4.3%) |
| Widowed | 2230 (4.8%) | 1320 (4.4%) | 6021 (4.6%) |
| Unknown | 298 (0.6%) | 114 (0.4%) | 703 (0.5%) |
| Urban Residence | 26699 (57.1%) | 16923 (56.7%) | 70208 (54.1%) |
| VA Enrollment Priority Group | |||
| Service Connected (SC; group 1-4) | 28802 (61.6%) | 18507 (62.0%) | 77992 (60.1%) |
| Not SC, No Copay (group 5-6) | 14017 (30.0%) | 8919 (29.9%) | 40002 (30.8%) |
| Not SC, with Copay (group 7-8) | 3770 (8.1%) | 2336 (7.8%) | 11469 (8.8%) |
| Unknown | 145 (0.3%) | 73 (0.2%) | 321 (0.2%) |
| Post-9/11 Military Service | 3322 (7.1%) | 1687 (5.7%) | 6522 (5.0%) |
| Military Sexual Trauma | |||
| Yes | 2306 (4.9%) | 1453 (4.9%) | 5214 (4.0%) |
| No | 44277 (94.7%) | 28299 (94.9%) | 124196 (95.7%) |
| Unknown | 151 (0.3%) | 83 (0.3%) | 374 (0.3%) |
| Tobacco Use Status | |||
| Current | 20975 (44.9%) | 13460 (45.1%) | 57312 (44.2%) |
| Former | 12318 (26.4%) | 8336 (27.9%) | 37023 (28.5%) |
| Never | 7978 (17.1%) | 5007 (16.8%) | 21344 (16.4%) |
| Unknown | 5463 (11.7%+) | 3032 (10.2%) | 14105 (10.9%) |
| Characteristic | Large dose reduction N=46,734 (22.6%) | Small dose reduction N=29,835 (14.4%) | No dose reduction N=129,784 (62.6%) |
|---|---|---|---|
| BMI Category2 | |||
| Below 18.5: Underweight | 820 (1.8%) | 439 (1.5%) | 1899 (1.5%) |
| 18.5 to < 25: Normal | 8969 (19.2%) | 5373 (18.0%) | 23001 (17.8%) |
| 25 to <30: Overweight | 14473 (31.1%) | 9267 (31.1%) | 40073 (30.9%) |
| 30+: Obese | 22342 (47.9%) | 14712 (49.4%) | 64588 (49.9%) |
| Pain Diagnoses3 | |||
| Back/Spine Disorders | 32075 (68.6%) | 20835 (69.8%) | 87119 (67.1%) |
| Neck/Spine Disorders | 10283 (22.0%) | 6692 (22.4%) | 25617 (19.7%) |
| Osteoarthritis | 14583 (31.2%) | 9094 (30.5%) | 36752 (28.3%) |
| Neuropathy | 9365 (20.0%) | 6019 (20.2%) | 24477 (18.9%) |
| Headache | 4120 (8.8%) | 2606 (8.7%) | 9129 (7.0%) |
| Mental Health Diagnoses3 | |||
| Depressive Disorder | 14190 (30.4%) | 9144 (30.6%) | 35791 (27.6%) |
| Anxiety Disorder | 7658 (16.4%) | 4706 (15.8%) | 18522 (14.3%) |
| PTSD | 12090 (25.9%) | 7196 (24.1%) | 29280 (22.6%) |
| Alcohol Use Disorder (AUD) | 3749 (8.0%) | 1950 (6.5%) | 7367 (5.7%) |
| Drug Use Disorder | 4193 (9.0%) | 2280 (7.6%) | 7477 (5.8%) |
| Opioid Use Disorder | 2225 (4.8%) | 1400 (4.7%) | 4247 (3.3%) |
| AUD Identification Test (AUDIT) Score2 | 0.94 (1.79) | 0.80 (1.60) | 0.87 (1.65) |
| Suicide-Related Diagnosis | 139 (0.3%) | 70 (0.2%) | 203 (0.2%) |
| Opioid Overdose Diagnosis | 98 (0.2%) | 60 (0.2%) | 139 (0.1%) |
| Charlson Comorbidity Index Score3 | 1.47 (1.78) | 1.47 (1.76) | 1.44 (1.72) |
| Charlson Index Conditions3 | |||
| Myocardial Infarction | 1305 (2.8%) | 779 (2.6%) | 3249 (2.5%) |
| Congestive Heart Failure | 3704 (7.9%) | 2289 (7.7%) | 10061 (7.8%) |
| Peripheral Vascular Disease | 2078 (4.4%) | 1185 (4.0%) | 4976 (3.8%) |
| Cerebrovascular Disease | 1566 (3.4%) | 826 (2.8%) | 3560 (2.7%) |
| COPD | 11436 (24.5%) | 7381 (24.7%) | 31855 (24.5%) |
| Dementia | 168 (0.4%) | 86 (0.3%) | 305 (0.2%) |
| Diabetes without Complications | 15125 (32.4%) | 9875 (33.1%) | 43507 (33.5%) |
| Diabetes with Complications | 7059 (15.1%) | 4575 (15.3%) | 19511 (15.0%) |
| Mild Liver Disease | 3875 (8.3%) | 2533 (8.5%) | 9680 (7.5%) |
| Moderate or Severe Liver Disease | 356 (0.8%) | 217 (0.7%) | 759 (0.6%) |
| Peptic Ulcer Disease | 526 (1.1%) | 362 (1.2%) | 1283 (1.0%) |
| Rheumatic Disease | 1236 (2.6%) | 863 (2.9%) | 3470 (2.7%) |
| Hemiplegia or Paraplegia | 593 (1.3%) | 391 (1.3%) | 1475 (1.1%) |
| Renal Disease | 3803 (8.1%) | 2350 (7.9%) | 10070 (7.8%) |
| Any Malignancy | 3654 (7.8%) | 2406 (8.1%) | 10275 (7.9%) |
| Metastatic Solid Tumor | 317 (0.7%) | 212 (0.7%) | 886 (0.7%) |
| AIDS/HIV | 194 (0.4%) | 103 (0.3%) | 465 (0.4%) |
| Characteristic | Large dose reduction N=46,734 (22.6%) | Small dose reduction N=29,835 (14.4%) | No dose reduction N=129,784 (62.6%) |
|---|---|---|---|
| Admissions in Prior Year | |||
| Any Mental Health Hospitalization | 772 (1.7%) | 284 (1.0%) | 900 (0.7%) |
| Any Medical Hospitalization | 4366 (9.3%) | 2731 (9.2%) | 9651 (7.4%) |
| Any Surgical Hospitalization | 2925 (6.3%) | 1696 (5.7%) | 4679 (3.6%) |
| Any Nursing Home Admission | 363 (0.8%) | 168 (0.6%) | 501 (0.4%) |
| VA Visits, Number in Prior Year | |||
| Primary Care Visits | 4.7 (4.1) | 4.7 (4.2) | 4.3 (3.8) |
| Mental Health Visits | 4.4 (12.3) | 3.9 (11.0) | 3.3 (9.6) |
| Emergency Department Visits | 1.0 (2.2) | 0.9 (2.0) | 0.7 (1.6) |
| Rehabilitation Visits | 2.7 (7.2) | 2.6 (6.9) | 2.0 (6.3) |
| Specialty Clinic Visits | 5.3 (7.4) | 5.5 (7.3) | 4.7 (6.6) |
| Any Fee Basis in Prior Month | |||
| Inpatient Care | 639 (1.4%) | 275 (0.9%) | 786 (0.6%) |
| Home Health Care | 1741 (3.7%) | 957 (3.2%) | 3332 (2.6%) |
| Outpatient Care | 3151 (6.7%) | 1735 (5.8%) | 6180 (4.8%) |
| Emergency Department | 1223 (2.6%) | 650 (2.2%) | 2042 (1.6%) |
| Opioid Daily Dose in Prior 60 Days | |||
| ME mg/Day, Mean (SD) | 56.9 (58.7) | 75.0 (78.0) | 57.6 (60.9) |
| ME mg/Day, Median (IQR) | 40.0 (30.7) | 48.7 (59.5) | 40.0 (30.7) |
| 20 to < 50 mg | 31269 (66.9%) | 15055 (50.5%) | 87964 (67.8%) |
| 50 to < 100 mg | 9946 (21.3%) | 8320 (27.9%) | 26637 (20.5%) |
| 100+ mg | 5519 (11.8%) | 6460 (21.7%) | 15183 (11.7%) |
| Opioid Formulation in Prior 60 Days | |||
| Any Long-Acting | 12844 (27.5%) | 11271 (37.8%) | 32541 (25.1%) |
| Short-Acting Only | 33890 (72.5%) | 18564 (62.2%) | 97243 (74.9%) |
| Benzodiazepine in Prior 60 Days | 7660 (16.4%) | 4998 (16.8%) | 19433 (15.0%) |
| Non-Benzo Hypnotic in Prior 60 Days | 3661 (7.8%) | 2455 (8.2%) | 9940 (7.7%) |
| Gabapentinoid in Prior 60 Days | 12626 (27.0%) | 8836 (29.6%) | 32445 (25.0%) |
1 18,511 missing AUDIT Score and 410 missing BMI.
2 From ICD-9 and ICD-10 diagnoses in the prior 12 months.
3 Includes opioid use disorder.
NOTES: 851 died before the 1-month follow-up time point and were therefore not assigned to a treatment group. Categories are not mutually exclusive.
ANNEX 7: BASELINE CHARACTERISTICS BY VITAL STATUS
TABLE F-8 Baseline Characteristics by Vital Status at 1 Year (n=207,204)
| Characteristic | Total N=207,204 |
Alive N=197,558 (95.3%) |
Dead (all cause) N=9,646 (4.7%) |
Dead (suicide cause) N=208 (0.1%) |
|---|---|---|---|---|
| Age in Years | 62.1 (11.5) | 61.8 (11.5) | 69.5 (10.1) | 63.5 (12.9) |
| Sex, Male | 193002 (93.1%) | 183654 (93.0%) | 9348 (97%) | 205 (98.6%) |
| Race1 | ||||
| White | 162177 (78.3%) | 154203 (78.1%) | 7974 (82.7%) | 186 (89.4%) |
| Black | 29743 (14.4%) | 28835 (14.6%) | 908 (9.4%) | 1 (0.5%) |
| American Indian | 3077 (1.5%) | 2952 (1.5%) | 125 (1.3%) | 2 (0.1%) |
| Asian | 628 (0.3%) | 615 (0.3%) | 13 (0.1%) | 0 |
| Pacific Islander | 2160 (1.0%) | 2079 (1.1%) | 81 (0.8%) | 0 |
| Unknown | 11493 (5.5%) | 10859 (5.5%) | 634 (6.6%) | 20 (9.6%) |
| Hispanic Ethnicity | ||||
| Yes | 7801 (3.8%) | 7543 (3.8%) | 258 (2.7%) | 4 (1.9%) |
| No | 192051 (92.7%) | 183065 (92.7%) | 8986 (93.2%) | 188 (90.4%) |
| Unknown | 7352 (3.5%) | 6950 (3.5%) | 402 (4.2%) | 16 (7.7%) |
| Marital Status | ||||
| Married | 107587 (51.9%) | 102990 (52.1%) | 4597 (47.7%) | 83 (39.9%) |
| Never Married | 18175 (8.8%) | 17513 (8.9%) | 662 (6.9%) | 17 (8.2%) |
| Divorced | 61523 (29.7%) | 58510 (29.6%) | 3013 (31.2%) | 84 (40.4%) |
| Separated | 9147 (4.4%) | 8749 (4.4%) | 398 (4.1%) | 8 (3.8%) |
| Widowed | 9649 (4.7%) | 8753 (4.4%) | 896 (9.3%) | 14 (6.7%) |
| Unknown | 1123 (0.5%) | 1043 (0.5%) | 80 (0.8%) | 2 (0.1%) |
| Urban residence | 114244 (55.1%) | 109261 (55.3%) | 4983 (51.7%) | 102 (49.0%) |
| VA Enrollment Priority Group | ||||
| Service Connected (SC; group 1-4) | 125720 (60.7%) | 120943 (61.2%) | 4777 (49.5%) | 101 (48.6%) |
| Not SC, No Copay (group 5-6) | 62394 (30.5%) | 59349 (30.0%) | 3945 (40.9%) | 83 (39.9%) |
| Not SC, with Copay (group 7-8) | 17650 (8.5%) | 16737 (8.5%) | 913 (9.5%) | 24 (11.5%) |
| Unknown | 540 (0.3%) | 529 (0.3%) | 11 (0.1%) | 0 (0.0%) |
| Post-9/11 Military Service | 11538 (5.6%) | 11449 (5.8%) | 89 (0.9%) | 10 (4.8%) |
| Military Sexual Trauma | ||||
| Yes | 8995 (4.3%) | 8736 (4.4%) | 259 (2.7%) | 9 (4.3%) |
| No | 197499 (95.4%) | 188231 (95.3%) | 9368 (97.1%) | 198 (95.2%) |
| Unknown | 610 (0.3%) | 591 (0.3%) | 19 (0.2%) | 1 (0.5%) |
| Tobacco Use Status | ||||
| Current User | 92085 (44.4%) | 87809 (44.4%) | 4276 (44.3%) | 106 (51.0%) |
| Former User | 57918 (28.0%) | 55150 (27.9%) | 2768 (28.7%) | 46 (22.1%) |
| Never User | 34442 (16.6%) | 33128 (16.8%) | 1314 (13.6%) | 27 (13.0%) |
| Unknown | 22759 (11.0%) | 21471 (10.9%) | 1288 (13.4%) | 29 (13.9%) |
| Characteristic | Total N=207,204 |
Alive N=197,558 (95.3%) |
Dead (all cause) N=9,646 (4.7%) |
Dead (suicide cause) N=208 (0.1%) |
|---|---|---|---|---|
| BMI Category2 | ||||
| Below 18.5: Underweight | 3216 (1.6%) | 2627 (1.3%) | 589 (6.2%) | 2 (1.0%) |
| 18.5 to < 25: Normal | 37572 (18.2%) | 34808 (17.6%) | 2764 (28.9%) | 59 (28.5%) |
| 25 to <30: Overweight | 64025 (31.0%) | 61451 (31.2%) | 2574 (26.9%) | 65 (31.4%) |
| 30+: Obese | 101981 (49.3%) | 98343 (49.9%) | 3638 (38.0%) | 81 (39.1%) |
| Pain Diagnoses3 | ||||
| Back/Spine Disorders | 140549 (67.8%) | 134767 (68.2%) | 5782 (59.9%) | 135 (64.9%) |
| Neck/Spine Disorders | 42731 (20.6%) | 41302 (20.9%) | 1429 (14.8%) | 42 (20.2%) |
| Osteoarthritis | 60671 (29.2%) | 57883 (29.3%) | 2788 (28.9%) | 50 (24.0%) |
| Neuropathy | 40082 (19.3%) | 37561 (19.0%) | 2521 (26.1%) | 45 (21.6%) |
| Headache | 15887 (7.7%) | 15509 (7.9%) | 378 (3.9%) | 18 (8.7%) |
| Mental Health Diagnoses3 | ||||
| Depressive Disorder | 59327 (28.6%) | 57001 (28.9%) | 2326 (24.1%) | 69 (33.2%) |
| Anxiety Disorder | 30978 (15.0%) | 29688 (15.0%) | 1290 (13.4%) | 43 (20.7%) |
| PTSD | 48709 (23.5%) | 47013 (23.8%) | 1696 (17.6%) | 45 (21.6%) |
| Alcohol Use Disorder (AUD) | 13131 (6.3%) | 12370 (6.3%) | 761 (7.9%) | 13 (6.2%) |
| Drug Use Disorder4 | 14000 (6.8%) | 13320 (6.7%) | 680 (7.0%) | 30 (14.4%) |
| Opioid Use Disorder | 7903 (3.8%) | 7519 (3.8%) | 384 (4.0%) | 19 (9.1%) |
| AUD Identification Test (AUDIT) Score2 | 0.88 (1.68) | 0.88 (1.67) | 0.78 (1.77) | 0.96 (1.93) |
| Suicide-Related Diagnosis | 413 (0.2%) | 389 (0.2%) | 24 (0.2%) | 4 (1.9%) |
| Opioid Overdose Diagnosis | 300 (0.1%) | 261 (0.1%) | 39 (0.4%) | 1 (0.5%) |
| Charlson Comorbidity Index Score3 | 1.46 (1.75) | 1.38 (1.67) | 2.99 (2.59) | 1.50 (1.79) |
| Charlson Index Conditions3 | ||||
| Myocardial Infarction | 5388 (2.6%) | 4785 (2.4%) | 603 (6.3%) | 6 (2.9%) |
| Congestive Heart Failure | 16299 (7.9%) | 14112 (7.1%) | 2187 (22.7%) | 11 (5.3%) |
| Peripheral Vascular Disease | 8330 (4.0%) | 7393 (3.7%) | 937 (9.7%) | 10 (4.8%) |
| Cerebrovascular Disease | 6015 (2.9%) | 5410 (2.7%) | 605 (6.3%) | 6 (2.9%) |
| COPD | 51082 (24.7%) | 46685 (23.6%) | 4397 (45.6%) | 68 (32.7%) |
| Dementia | 574 (0.3%) | 489 (0.2%) | 85 (0.9%) | 1 (0.5%) |
| Diabetes without Chronic Complications | 68892 (33.2%) | 64746 (32.8%) | 4146 (43.0%) | 59 (28.4%) |
| Diabetes with Chronic Complications | 31363 (15.1%) | 29101 (14.7%) | 2262 (23.5%) | 24 (11.5%) |
| Mild Liver Disease | 16183 (7.8%) | 15006 (7.6%) | 1177 (12.2%) | 25 (12.0%) |
| Peptic Ulcer Disease | 2197 (1.1%) | 1997 (1.0%) | 200 (2.1%) | 0 (0.0%) |
| Rheumatic Disease | 5595 (2.7%) | 5251 (2.7%) | 344 (3.6%) | 5 (2.4%) |
| Hemiplegia or Paraplegia | 2477 (1.2%) | 2313 (1.2%) | 164 (1.7%) | 7 (3.4%) |
| Renal Disease | 16390 (7.9%) | 14573 (7.4%) | 1817 (18.8%) | 19 (9.1%) |
| Any Malignancy | 16527 (8.0%) | 14508 (7.3%) | 2019 (20.9%) | 16 (7.7%) |
| Moderate or Severe Liver Disease | 1355 (0.7%) | 1118 (0.6%) | 237 (2.5%) | 0 (0.0%) |
| AIDS/HIV | 765 (0.4%) | 727 (0.4%) | 38 (0.4%) | 0 (0.0%) |
| Metastatic Solid Tumor | 1463 (0.7%) | 967 (0.5%) | 496 (5.1%) | 2 (1.0%) |
| Characteristic | Total N=207,204 |
Alive N=197,558 (95.3%) |
Dead (all cause) N=9,646 (4.7%) |
Dead (suicide cause) N=208 (0.1%) |
|---|---|---|---|---|
| Admissions in Prior Year | ||||
| Any Mental Health Hospitalization | 1964 (0.9%) | 1876 (0.9%) | 88 (0.9%) | 7 (3.4%) |
| Any Medical Hospitalization | 16917 (8.2%) | 15080 (7.6%) | 1837 (19.0%) | 18 (8.7%) |
| Any Surgical Hospitalization | 9348 (4.5%) | 8792 (4.5%) | 556 (5.8%) | 10 (4.8%) |
| Any Nursing Home Admission | 1046 (0.5%) | 940 (0.5%) | 106 (1.1%) | 2 (1.0%) |
| VA Visits, Number in Prior Year | ||||
| Primary Care Visits | 4.4 (3.9) | 4.4 (3.9) | 5.1 (4.9) | 4.4 (5.5) |
| Mental Health Visits | 3.6 (10.5) | 3.7 (10.5) | 2.6 (10.1) | 4.4 (16.0) |
| Emergency Department Visits | 0.8 (1.8) | 0.8 (1.8) | 1.1 (2.3) | 0.7 (1.5) |
| Rehabilitation Visits | 2.3 (6.6) | 2.3 (6.6) | 2.2 (6.8) | 1.9 (6.0) |
| Specialty Clinic Visits | 5.0 (6.9) | 4.9 (6.7) | 6.6 (9.6) | 4.0 (7.5) |
| Any Fee Basis in Prior Month | ||||
| Inpatient Care | 1791 (0.9%) | 1403 (0.7%) | 388 (0.4%) | 3 (1.4%) |
| Home Health Care | 6131 (3.0%) | 5240 (2.7%) | 891 (9.2%) | 8 (3.8%) |
| Outpatient Care | 11144 (5.4%) | 10402 (5.3%) | 742 (7.7%) | 12 (5.8%) |
| Emergency Department | 4014 (1.9%) | 3531 (1.8%) | 483 (5.0%) | 6 (2.9%) |
| Opioid Daily Dose in Prior 60 Days | ||||
| ME mg/Day, Mean (SD) | 60.0 (63.5) | 59.6 (63.0) | 68.3 (73.5) | 70.9 (71.0) |
| ME mg/Day, Median (IQR) | 40.0 (32.2) | 40 (32.07) | 41.5 (45.0) | 46.3 (55.5) |
| 20 to < 50 mg | 134779 (65.0%) | 129077 (65.3%) | 5702 (59.1%) | 110 (52.9%) |
| 50 to < 100 mg | 45118 (21.8%) | 42796 (21.7%) | 2322 (24.1%) | 66 (31.7%) |
| 100+ mg | 27307 (13.2%) | 25685 (13.0%) | 1622 (16.8%) | 32 (15.4%) |
| Opioid Formulation in Prior 60 Days | ||||
| Any Long-Acting | 56920 (27.5%) | 53876 (27.3%) | 3044 (31.6%) | 68 (32.7%) |
| Short-Acting Only | 150284 (72.5%) | 143682 (72.7%) | 6602 (68.4%) | 140 (67.3%) |
| Benzodiazepine in Prior 60 Days | 32244 (15.6%) | 30615 (15.5%) | 1629 (16.9%) | 62 (29.8%) |
| Non-benzo Hypnotic in Prior 60 Days | 16114 (7.8%) | 15465 (7.8%) | 649 (6.7%) | 24 (11.5%) |
| Gabapentinoid in Prior 60 Days | 54158 (26.1%) | 51577 (26.1%) | 2581 (26.8%) | 56 (26.9%) |
1 Categories are not mutually exclusive.
2 18,511 missing AUDIT Score and 410 missing BMI.
3 From ICD-9 and ICD-10 diagnoses in the prior 12 months.
4 Includes opioid use disorder.
This page intentionally left blank.


