Veterans, Prescription Opioids and Benzodiazepines, and Mortality, 2007–2019: Three Target Trial Emulations (2025)
Chapter: 4 The Effect of Opioid Prescription on All-Cause Mortality, Including Suicide Mortality, Among Those Without and With Current Benzodiazepine Prescription
4
The Effect of Opioid Prescription on All-Cause Mortality, Including Suicide Mortality, Among Those Without and With Current Benzodiazepine Prescription
INTRODUCTION
This chapter examines the effect on all-cause mortality and suicide mortality of the prescribing of opioid pharmacotherapy versus non-opioid pain pharmacotherapy among veterans without or with concomitant benzodiazepine pharmacotherapy who received care from the Veterans Health Administration (VHA). The subsequent two chapters will also examine all-cause mortality and suicide mortality and compare the effect of different initial opioid pharmacotherapy dosages and opioid dosage escalation treatment (Chapter 5) and VHA veterans on long-term opioid therapy pharmacotherapy, the effect of those newly dispensed benzodiazepine pharmacotherapy versus those newly dispensed alternative non-benzodiazepine pharmacotherapy used to treat anxiety and other common indications (Chapter 6).
Use of Opioid Pharmacotherapy to Treat Pain
Pain represents a significant public health challenge with an even more pronounced impact on U.S. veterans due to the substantial risk of pain because of military training and combat-related injuries and other occupational hazards complicated by related traumatic brain injury, posttraumatic stress disorder (PTSD), and other mental health and substance use disorders (Yang et al., 2022; Howard et al., 2022; Buttner et al., 2017; NASEM, 2013; Larson et al., 2012; Hoge et al., 2004). Since the 1990s, the use and promotion of prescribed opioid pharmacotherapy to relieve pain has been associated with increases in opioid use disorder (OUD), dependency, overdose, suicide, and overall mortality (Sandbrink et al., 2023; Moore et al., 2023; Bohnert and Ilgen, 2019; Chou et al., 2015; Bohnert et al., 2011).
Although research on the long-term efficacy of opioid pharmacotherapy on chronic pain is limited, evidence increasingly indicates the association of sustained opioid pharmacotherapy use with OUD and increased overall mortality in the general U.S. population, including veterans. Further complicating the issue is the co-prescribing rate of benzodiazepine pharmacotherapy, as the concurrent use of opioid and benzodiazepine pharmacotherapy increases the risk of unintentional overdose and suicide.1 Despite the known risks (see Chapter 1), alternatives to opioid pharmacotherapy for significant chronic pain are limited, leading to their continued prescription.
___________________
1 The VA has explicit guidelines advising against the prescribing benzodiazepine pharmacotherapy for treatment of PTSD among veterans due to mounting evidence of harms associated with chronic benzodiazepine pharmacotherapy prescribing in patients with PTSD and a demonstrated lack of benefits from their prescribing for the treatment of PTSD symptoms. See the VA/DoD 2017 Practice Guideline for the Management of PTSD for further information (VA, 2022).
To address the opioid crisis, the Department of Veterans Affairs (VA) and the Department of Defense (DoD) introduced the Clinical Practice Guidelines (CPGs) for Opioid Therapy for Chronic Pain in 2003 with updates in 2010, 2017, and 2022 (VA/DoD 2022, 2017, 2010, 2003). In a parallel effort, the VA launched the Opioid Safety Initiative (OSI) in 2013, leading to a substantial reduction in opioid prescriptions from 2013 to 2018 (Dieujuste et al., 2020) (see Chapter 2 and Appendix D for an in-depth exploration of the policy landscape surrounding the opioid crises at this time). However, prescription opioid pharmacotherapy continues to be a treatment modality to manage pain in the United States (CDC, 2023; Jones et al., 2018; Pergolizzi et al., 2018; Rosenblum et al., 2008).
In response to growing concerns regarding opioid pharmacotherapy use and the concurrent use of opioid and benzodiazepine pharmacotherapies among veterans between 2007 and 2019, Congress sought an evaluation from the National Academies of Sciences, Engineering, and Medicine (National Academies) and required the National Academies to “evaluate the effects of opioid and benzodiazepine use on all-cause mortality of U.S. veterans, including suicide mortality, regardless of whether information relating to such deaths has been reported to the U.S. Centers for Disease Control and Prevention (CDC)”. Specifically, the committee will quantify the effects of opioid and benzodiazepine prescribing on the risk of death among veterans who received care from the VHA between 2007 and 2019. In the analysis presented in this chapter, the committee focuses on parts (a) and (d) of the statement of task:2
“(a) the effect of opioid prescribing for pain, relative to alternative non-opioid pain treatments,”
and
“(d) the effect of initiating opioids among patients already taking benzodiazepines.”
To address the statement of task, the committee used VHA data available from 2007 to 2019, Centers for Medicare & Medicaid Services (CMS), and National Death Index (NDI) data and modern causal inference methods to estimate the per protocol effect of initiating and continuing opioid pharmacotherapy versus non-opioid pain pharmacotherapy on all-cause mortality and suicide mortality among those with and without currently dispensed benzodiazepine pharmacotherapy. To strengthen the inferences based on the results, the committee’s approach aligns with current best practices in causal inference, including utilizing target trial emulation techniques, the comparison of clinically realistic treatment strategies, the avoidance of biases related to mishandling time zero, and adjustment for baseline and time-varying confounding.
STUDY 1 METHODS
Study 1 aimed to answer the following causal research question: Among veterans receiving care in the VHA who were not consistently3 dispensed4 pain pharmacotherapy between 2007 and 2019, what is the effect of newly dispensed5 opioid versus non-opioid pain pharmacotherapy on all-cause mortality (primary outcome) and suicide mortality (secondary outcome) among those without and with current use of benzodiazepine pharmacotherapy within a 12-month follow-up period?
The committee designed this observational analysis to emulate a target trial of per protocol (main) and intent-to-treat (secondary) analysis. The target trial is the hypothetical randomized pragmatic trial that would have best answered the causal question. Target trial emulation (TTE) framework has two steps: (1) specify the protocol of the target trial, and (2) specify how the target trial will be emulated using observational data. TTE framework is useful because it helps to ensure comparison of realistic treatment strategies, avoids biases from misalignment of
___________________
2 Parts (b) and (c) of the statement task are addressed in Chapters 4 and 5 of this report.
3 Not dispensed any qualifying opioid or non-opioid pain pharmacotherapy in the 90-day pre-index period.
4 The committee notes differences in types of pharmacy data measures. Pharmacy data can be categorized into three measures: prescribed (prescriber submits a prescription to a pharmacy), filled (pharmacy completes the requested prescription), and dispensed (individual picks up/is mailed the prescription from the pharmacy). The committee used dispensed pharmacy data in its analyses.
5 The committee operationalized the term “initiation” in the statement of task as “newly dispensed” pharmacotherapy in analyses. In the committee’s studies, “newly dispensed” was defined as pharmacotherapy of interest not previously dispensed (or initiation of pharmacotherapy) to the individual in the 90 days prior to the start date.
time anchors (time zero/index date), and uses enhanced statistical techniques for minimizing confounding (Hernán and Robins, 2016; Gomes et al., 2022).
The protocol and specifications of the target trial (study 1) and how the committee emulated the target trial in the observational data are described in the following subsection and summarized in Table 4-1.
TABLE 4-1 Specifications for Study 1 Target Trial Protocol
| Protocol Component | Target Trial Specification | Target Trial Emulation |
|---|---|---|
| Eligibility Criteria |
|
Same as target trial |
Exclusion:
|
||
| Baseline is defined at the first month in which all eligibility criteria are met. | ||
Eligible individuals were either in one of two trials:
|
||
| Treatment Strategies |
Each individual is assigned to one of the following treatment strategies, initiated at baseline and continued over follow-up:
Note: Under both strategies, individuals need to be dispensed ≥7-day supply of the relevant therapies |
Same as target trial Defined the date of initiation to be the first date of a dispensed pharmacotherapy |
| Protocol Component | Target Trial Specification | Target Trial Emulation |
|---|---|---|
| Treatment Assignment | Individuals are randomly assigned to a strategy at baseline and are aware of their assigned strategy. | Assumed randomized conditional on baseline covariates (sociodemographics, health conditions and behaviors, supplemental health insurance to VHA coverage, health care utilization, specific pharmacotherapies, facility, facility-level characteristic, and date of eligible dispensed pharmacotherapy (calendar month)). |
| Outcomes | Primary: All-cause mortality Secondary: Suicide mortality |
Same as target trial (both based on National Death Index data and International Classification of Disease codes) |
| Start and End of Follow-Up | For each individual, follow-up starts at strategy assignment or treatment initiation (baseline). | Same as target trial |
| For per protocol analysis, eligible individuals are followed until all-cause and suicide mortality, non-adherence to treatment (≥3 months without dispensed opioid pharmacotherapy), cancer diagnosis (except non-melanoma skin cancer), receipt of hospice or palliative care during follow-up, or administrative end of follow-up at 12 months, whichever occurs first. | ||
| For intent-to-treat (ITT), eligible individuals are followed until death (or death due to other causes, in analyses of suicide mortality), or administrative end of follow-up at 12 months, whichever occurs first. | ||
| Causal Contrast | Primary: Per protocol effect Secondary: ITT effect |
Primary: Observational analogue of per protocol effect Secondary: Observational analogue of ITT effect |
| Statistical Analysi |
Primary: Per protocol analysis using inverse probability treatment weights (IPTW). Censor participants when deviate from assigned treatment strategy. Secondary: ITT analysis using IPTW Subgroup analysis by age, sex, race, ethnicity, payment source for dispensed pharmacotherapy, time period, surgical procedures). Estimated with the per protocol approach, as this is the main analysis. |
Observational analogue of ITT effect and per protocol effect.
Same subgroup analyses |
1 MOUD formulation of buprenorphine, methadone, LAAM, or naltrexone.
In addition, given the complexity of each study, the committee developed Figure 4-1, which reflects key temporal aspects of the longitudinal study design, specifically the index or date of entry into the study, exposure washout period, windows for exclusion and covariate assessments, and follow-up time (Schneeweiss et al., 2019).
Study Population and Data Sources
The study population is defined as veterans receiving care in the VHA, and the study period is from January 1, 2007, to December 31, 2019. The earliest index date, or start date, was January 1, 2007.6 The latest possible index date was December 31, 2018. To assess exclusion and eligibility in the study and follow-up, data from 2006–2019 were pulled for analyses.
___________________
6 Given that the earliest index date is January 1, 2007, the earliest pre-index date is January 1, 2006.

Data from the national VHA data files were linked to the VA Corporate Data Warehouse, U.S. Veterans Eligibility Trends and Statistics, NDI, and Medicare Parts A, B, C, and D data from CMS. Primary sources for individual inclusion/exclusion and covariates were VA and VHA data. CMS data were used to supplement individual data used for inclusion/exclusion and other covariates. Data files were linked based on a combination of a veteran’s unique individual integrated control number, Social Security number (SSN), and date of birth. The National Academies Institutional Review Board approved the study.
SPECIFICATIONS FOR THE EMULATED TARGET TRIAL 1
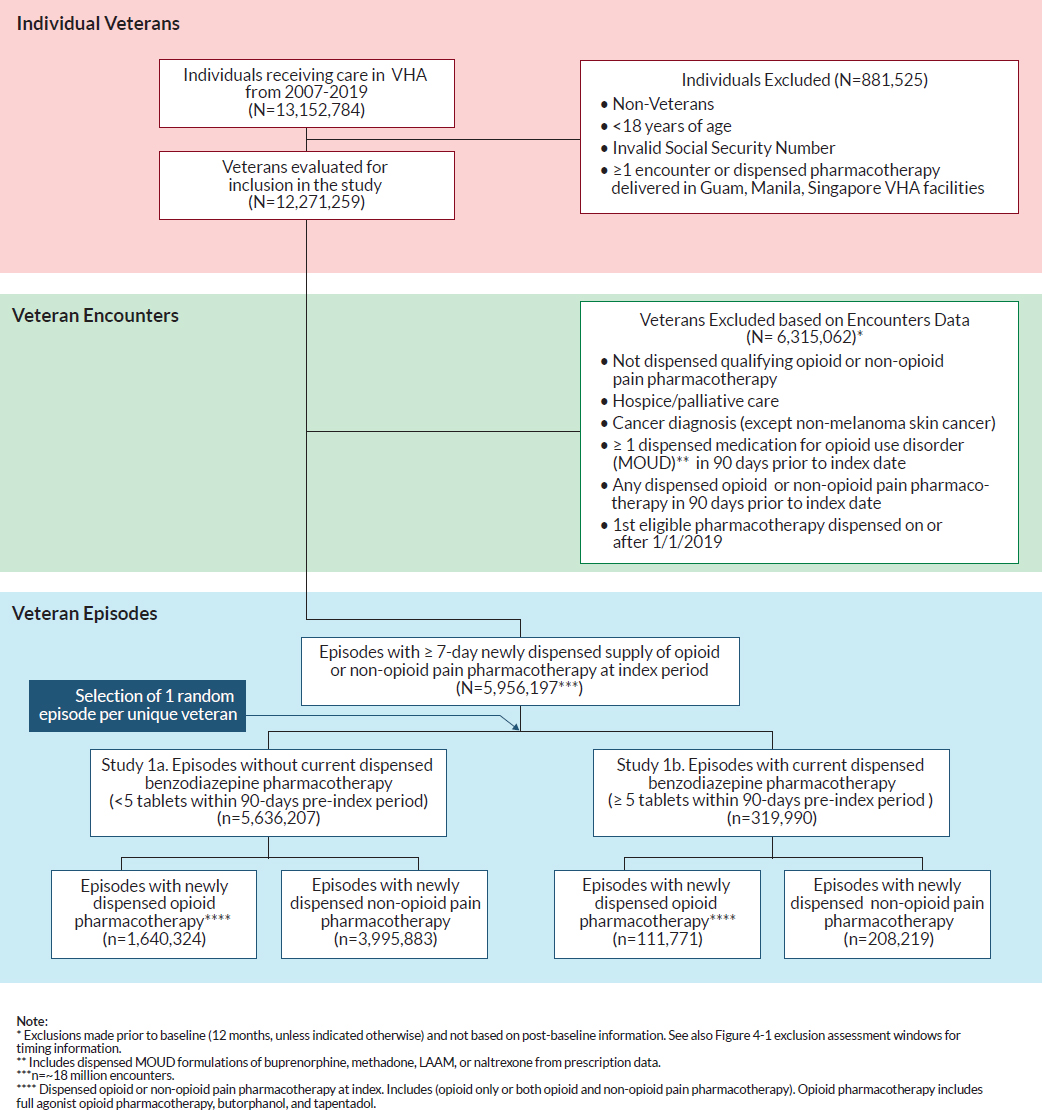
Drawing from this study population of all veterans receiving care in VHA facilities, the committee conducted two emulated trials or studies: Study 1a reflected veterans who were without current benzodiazepine pharmacotherapy and study 1b reflected veterans with current benzodiazepine pharmacotherapy. Each study compared mortality outcomes of those who were newly dispensed opioid pharmacotherapy with those newly dispensed non-opioid pain pharmacotherapy. Figure 4-2 illustrates the flowchart detailing the selection process of including eligible veterans in study 1. The following section outlines each of the target trial components for studies 1a and 1b.
Study 1 Eligibility Criteria
For each calendar month from January 1, 2007, to December 31, 2019, the committee identified eligible individuals who met the following criteria: (1) be a U.S. veteran; (2) be 18 years or older; (3) have a valid SSN; and (4) have at least 1 year of continuous enrollment in the VHA between 2006–2019, defined as at least one encounter in the VHA in the 12-month pre-index period. Eligible individuals also included veterans with at least one encounter in the VHA in the 12 months before index date within the eligible study period but only had a pharmacy claim through Medicare Part D (no VHA pharmacy claim). In addition, those who were eligible did not have an encounter or dispensed pharmacotherapy in Guam, Manila, or Singapore VHA facilities. These veterans were excluded given that mortality data collected in these regions are not reflected in the NDI data.
To be eligible for study 1a and study 1b, VHA veterans must have had no dispensed opioid pharmacotherapy or qualifying alternative non-opioid pain pharmacotherapy in the 90-day pre-index period (the exposure washout period). The committee established this washout period to exclude individuals with current dispensed opioid prescriptions in the VHA and relatively recent opioid or qualifying non-opioid pain prescription (VHA, 2006):
- Maximum duration of any opioid prescription for non-hospice/non-palliative care is 90 days.
- The maximum duration of any prescription fill in the VHA is 90 days, with exceptions for Schedule II drugs, such as oxycodone, which have a maximum duration of 30 days (except for individuals in hospice or palliative care).7
In addition, VHA veterans meeting the eligibility criteria must be dispensed ≥7-day supply of any qualifying opioid or non-opioid pain pharmacotherapy (Scully et al., 2018). Thus, the parameters used to determine this exposure washout period captured individuals newly dispensed opioid or non-opioid pain pharmacotherapy. Requiring a washout period facilitated the committee’s ability to examine the effects of opioid pharmacotherapy among individuals newly dispensed it and avoid the issues described above that result from comparing across individuals with different treatment histories.
Study 1 Eligibility Exclusion
Studies 1a and 1b had an exclusion assessment window of 365 days before the index date. VHA veterans who received hospice or palliative care or had a cancer diagnosis (except non-melanoma skin cancers) were excluded.
___________________
7 Hydrocodone was changed from a Schedule III drug to a Schedule II drug on October 6, 2014; before this, there could be 90-day fills of hydrocodone, which were common in the VA and private sector.
NOTE: No cell sizes of 10 or less are included in the reported result.
International Classification of Disease (ICD) diagnosis codes were used to identify conditions (see Appendix I for list of codes). Individuals receiving palliative care and/or in hospice were excluded given that having a terminal illness (and thus being eligible for these services) is related to both death and more permissive opioid prescribing and thus is a confounder in the relationship between receiving opioid pharmacotherapy and death. In addition, individuals with cancer have an increased risk of mortality and often receive an opioid prescription to manage cancer-related pain. Decisions regarding opioid initiation, co-prescribing, and dosage increases may differ for cancer compared to non-cancer pain; policies and practices for opioid prescribing is (generally) more permissive for individuals with cancer (VA/DoD, 2022, 2017, 2010, 2003; Manchikanti et al., 2017; Dowell et al., 2016). Furthermore, the study exclusion criteria are in line with published studies examining opioid pharmacotherapy, which excluded individuals with cancer (Song et al., 2022; Coyle et al., 2018; Berna et al., 2015; Turner and Liang, 2015; Gomes et al., 2011; Dunn et al., 2010). As a result, having cancer may be a confounder between treatment regimen and mortality; therefore, individuals with cancer, other than non-melanoma skin cancer, are excluded.
The committee excluded VHA veterans receiving medications for opioid use disorder (MOUD) to reduce the likelihood of including those who were not truly opioid naïve. To ensure that individuals receiving MOUD treatment were excluded from the study, the committee determined that any individuals in the population who had received ≥1 dispensed MOUD formulation of levo-alpha acetyl methadol (LAAM), methadone, buprenorphine, or naltrexone in the 90-day pre-index period would be ineligible.
In studies 1a and 1b, veterans with all qualifying episodes8 beginning on or after January 1, 2019, were excluded to ensure that each veteran included in the study had the potential for a complete 12-month follow-up period.
The causal question for this study focuses on the effect of newly dispensed opioid pharmacotherapy (i.e., initiating) versus newly dispensed non-opioid pain pharmacotherapy (i.e., initiating) among VHA veterans without (study 1a) and with (study 1b) current benzodiazepine pharmacotherapy. Studies 1a and 1b did not exclude individuals (a) receiving opioid pharmacotherapy who have an OUD or (b) with surgery or acute painful injury within the 90 days before the index date. The committee agreed that OUD diagnosis alone is not an absolute contraindication for opioid prescribing: the OUD diagnosis may not be recent, and individuals may not actively be receiving treatment during the time of the study. In addition, OUD was not considered a covariate by the committee because it is within the causal pathway of interest. Given these reasons, the committee did not exclude individuals with an OUD diagnosis. The committee aimed to capture all newly dispensed opioid pharmacotherapy exposure (except cancer-related and end-of-life pain, given the increased likelihood of mortality) (see Chapter 3 for more detail on the rationale).
Individuals may initially manage acute pain related to surgery, injuries, and/or other procedures using opioid or non-opioid pain pharmacotherapy and are sometimes prescribed longer-term pain pharmacotherapy (which may or may not include opioid pharmacotherapy) to manage chronic pain. Also, chronic pain often starts from an injury or experience that may be expected to result in short-term pain. By excluding these individuals, the sample would not be generalizable to individuals who experience this common pathway to chronic pain.
Study 1a and Study 1b Treatment Strategies
Drawing from this study population of eligible VHA veterans, studies 1a and 1b included veterans without and with currently dispensed benzodiazepine pharmacotherapy, respectively. Both studies focused on the initiation of clinically realistic treatment strategies:
- Study 1a: Of those without currently dispensed benzodiazepine pharmacotherapy,
- those with a newly dispensed opioid pharmacotherapy (treatment group) versus
- those with a newly dispensed non-opioid pain pharmacotherapy (comparator group)
and
- Study 1b: Of those with currently dispensed benzodiazepine pharmacotherapy,
- those with a newly dispensed opioid pharmacotherapy (treatment group) versus
- those with a newly dispensed non-opioid pain pharmacotherapy (comparator group)
___________________
8 All veteran episodes (regardless of treatment assignment).
The list of eligible opioid and non-opioid pain pharmacotherapies is in Table 4-2.
TABLE 4-2 Pharmacotherapies of Interest in Study 1
| Drug Class | Study 1 |
|---|---|
| Opioid Full Agonist | |
| Benzhydrocodone | Opioid pharmacotherapy (Treatment) |
| Codeine | Opioid pharmacotherapy (Treatment) |
| Dihydrocodeine | Opioid pharmacotherapy (Treatment) |
| Fentanyl | Opioid pharmacotherapy (Treatment) |
| Hydrocodone | Opioid pharmacotherapy (Treatment) |
| Hydromorphone | Opioid pharmacotherapy (Treatment) |
| LAAMa (non-liquid; for pain) | Opioid pharmacotherapy (Treatment) |
| LAAM (non-liquid; MOUDb) |
|
| Levomethadyl | Opioid pharmacotherapy (Treatment) |
| Levorphanol | Opioid pharmacotherapy (Treatment) |
| Meperidine (oral) | Opioid pharmacotherapy (Treatment) |
| Methadone (non-liquid/non-diskette) (for pain) | Opioid pharmacotherapy (Treatment) |
| Methadone (non-liquid/non-diskette) (MOUD) |
|
| Morphine | Opioid pharmacotherapy (Treatment) |
| Oxycodone | Opioid pharmacotherapy (Treatment) |
| Oxymorphone | Opioid pharmacotherapy (Treatment) |
| Propoxyphene | Opioid pharmacotherapy (Treatment) |
| Sufentanil (sublingual) | Opioid pharmacotherapy (Treatment) |
| Tramadol | Opioid pharmacotherapy (Treatment) |
| Opioid Atypical | |
| Buprenorphine (MOUD) |
|
| Buprenorphine (for pain) |
|
| Drug Class | Study 1 |
|---|---|
| Butorphanol | Opioid pharmacotherapy (Treatment) |
| Tapentadol | Opioid pharmacotherapy (Treatment) |
| Opioid Antagonist | |
| Naltrexone |
|
| Benzodiazepine | |
| Alprazolam | Stratifying medication |
| Bromazepam | Stratifying medication |
| Chlordiazepoxide | Stratifying medication |
| Clobazam | Stratifying medication |
| Clonazepam | Stratifying medication |
| Clorazepate | Stratifying medication |
| Diazepam | Stratifying medication |
| Estazolam | Stratifying medication |
| Flurazepam | Stratifying medication |
| Halazepam | Stratifying medication |
| Lorazepam | Stratifying medication |
| Oxazepam | Stratifying medication |
| Prazepam | Stratifying medication |
| Quazepam | Stratifying medication |
| Remimazolam | Stratifying medication |
| Temazepam | Stratifying medication |
| Triazolam | Stratifying medication |
| Anti-Convulsant | |
| Carbamazepine | Confounder |
| Oxcarbazepine | Confounder |
| Topiramate | Confounder |
| Antidepressants | |
| Amitriptyline | Non-opioid pain pharmacotherapy (opioid comparator) |
| Amoxapine | Non-opioid pain pharmacotherapy (opioid comparator) |
| Bupropion (Tab) | Not included in study |
| Citalopram | Not included in study |
| Clomipramine | Non-opioid pain pharmacotherapy (opioid comparator) |
| Desipramine | Non-opioid pain pharmacotherapy (opioid comparator) |
| Desvenlafaxine | Confounder |
| Drug Class | Study 1 |
|---|---|
| Doxepin | Non-opioid pain pharmacotherapy (opioid comparator) |
| Duloxetine | Non-opioid pain pharmacotherapy (opioid comparator) |
| Escitalopram | Not included in study |
| Esketamine | Not included in study |
| Fluoxetine | Not included in study |
| Fluvoxamine | Not included in study |
| Impramine | Non-opioid pain pharmacotherapy (opioid comparator) |
| Isocarboxazid | Not included in study |
| Levomilnacipran | Non-opioid pain pharmacotherapy (opioid comparator) |
| Milnacipran | Non-opioid pain pharmacotherapy (opioid comparator) |
| Mirtazapine | Confounder |
| Nefazodone | Not included in study |
| Nortriptyline | Non-opioid pain pharmacotherapy (opioid comparator) |
| Paroxetine | Not included in study |
| Phenelzine | Not included in study |
| Protriptyline | Non-opioid pain pharmacotherapy (opioid comparator) |
| Selegiline | Not included in study |
| Sertraline | Not included in study |
| Tranylcypromine | Not included in study |
| Trazodone | Not included in study |
| Trimipramine | Non-opioid pain pharmacotherapy (opioid comparator) |
| Venlafaxine | Confounder |
| Vilazodone | Not included in study |
| Viloxazine | Not included in study |
| Vortioxetine | Not included in study |
| Antihistamine | |
| Hydroxyzine | Confounder |
| Anxiolytic | |
| Buspirone | Confounder |
| Gabapentinoids | |
| Gabapentin | Non-opioid pain pharmacotherapy (opioid comparator) |
| Pregabalin | Non-opioid pain pharmacotherapy (opioid comparator) |
| Drug Class | Study 1 |
|---|---|
| Insomnia | |
| Eszopiclone | Not included in study |
| Ramelteon | Not included in study |
| Suvorexant | Not included in study |
| Zaleplon | Not included in study |
| Zolpidem | Not included in study |
| Migraine | |
| Almotriptan | Confounder |
| Aspirin w/ caffeine | Confounder |
| Eletriptan | Confounder |
| Fioricet | Confounder |
| Fioridals | Confounder |
| Fioridan | Confounder |
| Frovatriptan | Confounder |
| Naratriptan | Confounder |
| Rizatriptan | Confounder |
| Sumatriptan | Confounder |
| Sumatriptan + Naproxen | Confounder |
| ZOLMitriptan | Confounder |
| Muscle Relaxers | |
| Baclofen | Non-opioid pain pharmacotherapy (opioid comparator) |
| Carisoprodol | Non-opioid pain pharmacotherapy (opioid comparator) |
| Chlorzoxazone | Non-opioid pain pharmacotherapy (opioid comparator) |
| Cyclobenzaprine | Non-opioid pain pharmacotherapy (opioid comparator) |
| Dantrolene | Non-opioid pain pharmacotherapy (opioid comparator) |
| Metaxalone | Non-opioid pain pharmacotherapy (opioid comparator) |
| Methocarbamol | Non-opioid pain pharmacotherapy (opioid comparator) |
| Orphenadrine | Non-opioid pain pharmacotherapy (opioid comparator) |
| Tizanidine | Non-opioid pain pharmacotherapy (opioid comparator) |
| Other Non-Opioid Analgesic | |
| Acetaminophen | Confounder |
| Non-Steroidal Anti-Inflammatory Drug | |
| Aspirin (>=400mg) | Non-opioid pain pharmacotherapy (opioid comparator) |
| Celecoxib | Non-opioid pain pharmacotherapy (opioid comparator) |
| Diclofenac (pill) | Non-opioid pain pharmacotherapy (opioid comparator) |
| Diflunisal | Non-opioid pain pharmacotherapy (opioid comparator) |
| Etodolac | Non-opioid pain pharmacotherapy (opioid comparator) |
| Drug Class | Study 1 |
|---|---|
| Fenoprofen | Non-opioid pain pharmacotherapy (opioid comparator) |
| Flurbiprofen | Non-opioid pain pharmacotherapy (opioid comparator) |
| Ibuprofen | Non-opioid pain pharmacotherapy (opioid comparator) |
| Indomethacin | Non-opioid pain pharmacotherapy (opioid comparator) |
| Ketoprofem | Non-opioid pain pharmacotherapy (opioid comparator) |
| Ketorolac | Non-opioid pain pharmacotherapy (opioid comparator) |
| Meclofenamate | Non-opioid pain pharmacotherapy (opioid comparator) |
| Meloxicam | Non-opioid pain pharmacotherapy (opioid comparator) |
| Nabumetone | Non-opioid pain pharmacotherapy (opioid comparator) |
| Naproxen | Non-opioid pain pharmacotherapy (opioid comparator) |
| Oxaprozin | Non-opioid pain pharmacotherapy (opioid comparator) |
| Phenylbutazone | Non-opioid pain pharmacotherapy (opioid comparator) |
| Piroxicam | Non-opioid pain pharmacotherapy (opioid comparator) |
| Salsalate | Non-opioid pain pharmacotherapy (opioid comparator) |
| Sulindac | Non-opioid pain pharmacotherapy (opioid comparator) |
| Tolmetin | Non-opioid pain pharmacotherapy (opioid comparator) |
| Serotonin-Norepinephrine Reuptake Inhibitor | |
| Desvenlafaxine | Confounder |
| Venlafaxine | Confounder |
| Tetracyclic Antidepressants | |
| Mirtazapine | Confounder |
a LAAM = Levo-Alpha Acetyl Methadol.
b MOUD = medication for opioid use disorder.
Study 1a and Study 1b Treatment Assignment
In the hypothetical target trial, eligible individuals would be randomly assigned by clinical researchers to a treatment strategy with their consent and followed; individuals would be aware of their treatment assignment. In the emulated target trials (studies 1a and study 1b), based in retrospective observational data, assignments were based on the observed dispensed prescription drug events (claims) from Medicare Part D or dispensed pharmacotherapies from the VHA electronic health records (EHRs). Thus, the analyses considered prescription dispensing records to assign treatment strategy, unlike in the hypothetical target trial, for which the researchers would determine the assignment, which could be different from what medications9 ultimately were dispensed. It is also important to distinguish the measurability of prescription dispensing data from the measurability of that which is ingested by the individual. A dispensed prescription does not necessarily mean that the medication was consumed, since these medications are commonly prescribed to be taken “as needed.” For this study, a measure of individuals ingesting the prescription was not available in the dataset analyzed; the committee used prescription dispensing data as a proxy for medications ingested by the individual.
___________________
9 The committee uses the term “pharmacotherapy” throughout the report instead of “medications,” “prescriptions,” or “treatment,” especially when referencing the committee’s analyses and results.
After the first dispensed eligible pharmacotherapy, a 30-day pharmacotherapy episode interval was created for eligible VHA veterans. One episode per eligible veteran was selected at random for inclusion in the study.
Selection of Pharmacotherapies of Interest
Specifically, in studies 1a and 1b, the committee considered the initiation of two different clinically realistic treatment strategies: (1) opioid pharmacotherapy (i.e., the “exposure” of the target trial), and (2) non-opioid pain pharmacotherapy (i.e., the “comparator” of the target trial). Exposure to opioid pharmacotherapy was defined as having a dispensed opioid-containing pain pharmacotherapy with ≥7 days’ supply. An eligible non-opioid pain pharmacotherapy (i.e., the “comparator”) was defined as a dispensed qualifying non-opioid pain pharmacotherapy with ≥7 days’ supply.
In addition, eligible VHA veterans for study 1 were stratified by the baseline status of current use of benzodiazepine pharmacotherapy. Those in study 1a (without current benzodiazepine pharmacotherapy) were defined as having <5 tablets of benzodiazepine pharmacotherapy within 90 days prior to the index date. Those in study 1b (with current benzodiazepine pharmacotherapy) were defined as having ≥5 tablets of benzodiazepine pharmacotherapy within 90 days prior to the index date. These thresholds were used to distinguish one-off use of benzodiazepine pharmacotherapy (e.g., magnetic resonance imaging (MRI), dental visit, flight anxiety).
Within studies 1a and study 1b, the treatment group are individuals newly dispensed opioid pharmacotherapy. Qualifying opioid pharmacotherapy included full agonist10 opioid pharmacotherapy available for treatment during the study period (2007–2019). Additionally, two atypical opioid pharmacotherapies (tapentadol and butorphanol) were included due to their use in pain treatment and impact within the pain neurotransmitter route. The comparator group included individuals dispensed non-opioid pain pharmacotherapies with, but not limited to, primary indications for pain treatment (i.e., non-steroidal anti-inflammatory drugs (NSAIDs)). As many drugs have dual benefits and secondary indications, the drug list was expanded to include relevant pharmacotherapies with analgesic properties from several additional drug classes (tetracyclic antidepressant (TeCAs), serotonin-norepinephrine reuptake inhibitor (SNRIs), muscle relaxers, and gabapentinoids). Any individuals newly dispensed both opioid and non-opioid pain pharmacotherapy concurrently were included in the opioid treatment group.
Study 1a and Study 1b Start and End of Follow-Up
The start date, or the index date, is when the eligible VHA veteran was first dispensed the qualifying ≥7 days’ supply of the opioid or non-opioid pain pharmacotherapy and when all baseline eligibility criteria were met. To facilitate computation, the index date was transformed into an index month, as the analyses were conducted using aggregated monthly data. Based on the study design that considered a 12-month pre-index period and a 12-month follow-up period, January 1, 2007, was the first eligible index date, and December 31, 2018, was the last eligible index date. The period of outcome measurement was 12 months from the index date, with a final follow-up date of December 31, 2019, which marked the end of the study period. The committee utilized all available follow-up data (through the end of 2020) with prespecified landmark analysis at 12 months.
For the per protocol analysis, given that interest is in observing the effect of initiating and continuing the treatment strategy over a specified follow-up period (sustained strategies), eligible individuals are followed from the time of treatment initiation (baseline) until death (or death due to other causes, in analysis of suicide mortality), cancer diagnosis (except non-melanoma skin cancer), receipt of hospice or palliative care, non-adherence to treatment (≥3 months without dispensed opioid pharmacotherapy) (or the administrative end of follow-up (at the end of 12 months from baseline), whichever happens first. For intent-to-treat (ITT) analysis, eligible individuals are followed from the time of treatment initiation (baseline) until death (or death due to other causes, in analysis of suicide mortality) or the administrative end of follow-up (at the end of 12 months), whichever happens first.
___________________
10 There are two types of opioids: full agonist and partial opioid agonist. Full opioid agonists fully activate the mu receptors in the brain, enabling the opioid to have “full” effect, such as codeine, oxycodone, and fentanyl. Partial opioid agonists also activate mu receptors in the brain but to a lesser degree, such as butorphanol or tapentadol.
Study 1 Outcomes
The outcomes outlined in the statement of task are all-cause mortality and suicide mortality, which were identified through linked data from NDI. The committee determined all-cause mortality as the primary outcome and suicide mortality as the secondary outcome. Suicide mortality is identified by the ICD-10 death codes X60-X84 (intentional self-harm), U03 (intentional self-harm [suicide]), and Y87.0 (sequelae of intentional self-harm) (Hirsch et al., 2016; CDC, 2002).
Causal Contrast: Intent-to-Treat and Per Protocol Effects
Adhering to the statement of task and the causal question, this analysis focused on the effect of newly dispensed opioid versus non-opioid pain pharmacotherapy in study 1a (without current benzodiazepine pharmacotherapy) and study 1b (with current benzodiazepine pharmacotherapy), and these studies each employed two causal contrasts.
The primary causal contrast was the per protocol effect, which corresponds to the effect of adhering to the assigned treatment strategy during the follow-up. Individuals were censored if they stopped adhering to treatment protocol (i.e., ≥1 dispensed relevant pain pharmacotherapy). Each veteran contributed a maximum of 12 months to the analysis. An individual may have multiple episodes (with either opioid or non-opioid pharmacotherapy; a 90-day washout period would still be applied) during the study period; however, for the purposes of the analysis, one episode per individual was randomly selected. The committee considered selecting the first episode but was concerned of potential bias to earlier years of the study period. Preliminary analysis suggested that the distribution of outcomes and covariates were similar between the randomly selected episodes and the full sample of all veteran episodes.
The secondary causal contrast involved the ITT effect, which corresponds to the effect of being assigned to a treatment strategy (e.g., initiating opioid versus non-opioid pain pharmacotherapies at baseline), irrespective of subsequent cross-over or treatment discontinuation during follow-up.
For both per protocol and ITT analyses, the committee created 30-day pharmacotherapy episode intervals. In per protocol analysis, time-varying weights were created. In ITT, only baseline weights were created. For ITT analysis, the inverse probability was a function of only the baseline covariates; for per protocol analysis, it was a function of both baseline and time-varying covariates (Hernán and Robins, 2017; Robins et al., 2000).
The general assumption of this approach is if there are no unmeasured confounders, no measurement error, and no model misspecification, the per protocol and ITT effects are unbiased estimates of causal effects.
Study 1a and Study 1b Design
The study design was an active-comparator, new-user (Lund et al., 2015; Ray, 2003), retrospective cohort target trial emulation (Hernán and Robins, 2016). The emulated trial, using observational data, was conducted to estimate the effect of newly dispensed opioid pharmacotherapy versus non-opioid pain pharmacotherapy on mortality among VHA veterans without (study 1a) and with (study 1b) current use of benzodiazepine pharmacotherapy, for a follow-up period of 12 months.
Study 1a and Study 1b Covariates
To strengthen causal inferences, the committee controlled for many covariates to adjust for baseline and/or time-varying confounding and achieve balance between the treatment and comparator groups.
- Sociodemographics,
- Health conditions and behaviors,
- Supplemental health insurance to VHA coverage,
- Health care utilization,
- Specific pharmacotherapies,
- Facility,
- Facility-level characteristic, and
- Calendar month of eligible dispensed pharmacotherapy.
Additional covariates include month and the interaction of state and year as fixed effects. Baseline covariates included demographic characteristics (e.g., age, sex, race/ethnicity, marital status, disability status), supplemental insurance to VHA coverage (i.e., Medicare, TRICARE, or private insurance), housing security (e.g., history of homelessness status), physical and mental health conditions/disorders (e.g., acute painful injury, anxiety, chronic obstructive pulmonary disease, cardiovascular disease, substance use disorders, diabetes), military status (e.g., service era, military branch, combat service), body mass index, health care utilization in prior year (e.g., VHA outpatient visits, inpatient hospital admissions, nursing home stay), VHA facility-level characteristic (e.g., urbanicity), and specific pharmacotherapies that the committee considered as potential confounders (migraine pharmacotherapies, anxiolytics, and SNRIs; see Table 3-4 and Table 4-2 for the detailed list). The committee evaluated candidate variables readily available in the study clinical and administrative databases. See Appendix I for a list of all health conditions and corresponding ICD codes.
The studies did not require participants to have a chronic pain diagnosis in the primary analysis. Studies have shown that individuals identified with chronic pain did not have a pain diagnosis or pain was underreported in electronic medical records compared to pain reported in a patient-based survey (Frank et al., 2019; Goulet et al., 2016). In addition to this, chronic pain is an indication for the study model and can be widely assumed to be present given the study sample. Due to these reasons, the committee chose to not include it as a covariate in this study.
The committee controlled for several baseline confounders in this study. The committee, based on their expertise, excluded individuals at baseline with dispensed prescriptions for buprenorphine formulations for both OUD and pain treatment and naltrexone (an opioid antagonist) for OUD treatment. These pharmacotherapies were included as confounders if individuals were dispensed these pharmacotherapies after their index date during follow-up; individuals with these prescriptions may not be truly opioid naïve. The committee included specific antidepressants as confounders due to their off-label use to treat PTSD, tension type headaches (venlafaxine) and neuropathy (desvenlafaxine) (see Chapter 3 for rationale).
Lastly, based on a priori hypotheses that effects may vary by specific individual subgroups, the committee identified a subset of variables to be evaluated for effect modification (see the “Subgroup Analyses” section) (Suda et al., 2023; Gellad et al., 2018).
Time-Varying Covariates
The only time-varying covariate was pain intensity rating (pain scores)11 (measured by the average of all documented pain scores within a month in the VHA EHR). The scores were updated monthly in the dataset and were incorporated in the inverse probability treatment weights (IPTWs), described later. When a new measurement was unavailable, the last observation was carried forward indefinitely until a new measurement was available or the individual was censored.
Accounting for Secular Trends and Variation by Facility
Facility and calendar time (12 months) were captured as fixed effects to capture facility-specific variation (e.g., clustering of individuals within a facility, geographic variations by facility) and reflect changes over time (e.g., variation in behaviors (health care seeking, prescribing)) and prevalence of conditions during a year. The committee also included an interaction term (i.e., product term) between state and year to capture variation over
___________________
11 Pain scores refer to “pain intensity ratings” documented in the EHR Vital Signs package, which are derived from a routine standardized process that calls for screening for the presence and intensity of pain “right now” on a 0 (no pain) to 10 (worst pain imaginable) numeric rating scale when other vital signs are taken. They are therefore only routinely collected and documented when other vitals are taken (i.e., in primary care and other similar clinics and not in most specialty clinics, particularly not in mental health settings).
time and by states, such as when state or facility policies related to opioid prescribing were implemented (e.g., when states began to participate in the Prescription Drug Monitoring Program) or secular trends in state-level policies and intensities during the opioid epidemic.
Statistical Analysis
The causal effects of studies 1a and study 1b were the per protocol effect of newly dispensed individuals who fully adhere to opioid versus non-opioid pain pharmacotherapy and the ITT effect of newly dispensed opioid versus non-opioid pain pharmacotherapy. For estimating both per protocol and ITT effects, an unadjusted and adjusted (IPTW) pooled logistic regression model was used to estimate the death rates (per 100,000 person-years) (as a measure of absolute risk) and hazard ratios (HR) for all-cause mortality and suicide mortality in the opioid treatment group, compared to the non-opioid treatment group serving as the reference. Wald confidence intervals (CIs) were used to estimate the 95 percent CIs. The survival curves for all-cause and suicide mortality over time by for those newly dispensed opioid pharmacotherapy compared to those newly dispensed non-opioid pain pharmacotherapy (reference group) were estimated.
All analyses were conducted using SAS 9.4 and SAS Enterprise Guide. Study results do not report data if sample sizes were 10 or fewer individuals. This helps to ensure confidentiality of individuals in the study and be in line with CMS data policy and National Center for Health Statistics (NCHS) recommendations (NCHS, 2023; HHS, 2020). Furthermore, cells are marked as unreliable where sample sizes were 20 or fewer.
Accounting for Baseline Differences: Inverse Probability Treatment Weights
To account for the baseline difference between treatment and comparator groups in each target trial, analyses were weighted using IPTW for studies 1 and 3. IPTW is a method used to adjust for covariates and potential confounding in observational studies that uses a function of the propensity score (PS) of receiving treatment based on individual factors. By weighting each individual included in the analysis by the inverse of the probability of receiving the treatment or comparator treatment helps achieve balance between the treatment and comparator groups (Xu et al., 2010; Robins, 1986).
To calculate the IPTW,12 the committee first performed a logistic regression to calculate the PS, or the likelihood of being in the treatment versus the comparator group. The PS was modeled by fitting a logistic regression of the medication received (treatment vs. control) as a function of the covariates described above. For per protocol analysis, IPTW was a function of both baseline and time-varying covariates; for ITT analysis, the IPTW was a function of only the baseline covariates (Robins et al., 2000). Second, the IPTW was calculated using the inverse of the PS, or 1/PS, for those in the newly dispensed opioid pharmacotherapy group (treatment) and 1/(1-PS) for those in the newly dispensed non-opioid pain pharmacotherapy group (comparator) in study 1a (without current benzodiazepine pharmacotherapy) and study 1b (with current benzodiazepine pharmacotherapy).
In each study, to limit the influence of extreme weights on the results, the committee winsorized weights to the middle 98 percent by applying the first percentile weight to all observations below the first percentile and the 99th percentile weight to all observations above the 99th percentile. In each study, the distribution of the PS by those in the treatment and comparator groups was depicted using histograms. In addition, the balance of baseline covariates between the two groups before and after IPTW was assessed using the absolute standardized mean difference (ASMD). An ASMD of ≤0.1 between the two groups after weighting suggests reduction of potential confounding, allowing for causal inference comparisons (Austin, 2009). Missing values were handled using the missing covariate indicator methods, which assigned a missing category in the model (e.g., Hispanic ethnicity, non-Hispanic ethnicity, missing ethnicity).
___________________
12 More detail in calculating the IPTW for per protocol effect: to adjust for risk factors associated with treatment initiation (or adherence to treatment), time varying, non-stabilized IPTWs are estimated via a pooled logistic regression model for the monthly probability of treatment that includes the baseline and time-varying factors. The following weights were calculated: (1) a baseline treatment weight to adjust for measured confounding in the likelihood of initiating opioid versus non-opioid pharmacotherapy (the IPTW described); (2) an adherence weight (monthly); and (3) a censoring weight for loss to follow-up (monthly).
Descriptive Analyses
The committee reports the distributions of baseline demographic and clinical characteristics for the overall analytic sample before and after application of the IPTW weights.
Subgroup Analysis
Given that examining the per protocol effect was the main analysis, subgroup analyses were based on that effect. Subgroup analyses were conducted by age (with two categorical comparisons: 18–64 versus ≥65 and 18–34, 35–54, 55–74, ≥75), race (White, Black, Native American/Alaskan Native, Asian, Hawaiian and Pacific Islander, more than one race, and missing), ethnicity (Hispanic and non-Hispanic), sex (male and female), time period (2007–2012 versus 2014–2019), and by payment source of dispensed medications (only Medicare Part D prescription claims, only VHA prescription claims, or both during the episode). The committee selected these subgroups to examine differences given older age groups, specific racial and ethnic groups, and males have been shown to be at increased risk for mortality (Bohnert and Ilgen, 2019; Bossarte et al., 2012). Age categories used in the national annual reports on veteran suicide prevention were also included in the subgroup analysis for consistency (VA, 2018).
The committee included time period as a subgroup to examine temporal changes in mortality risk. The committee selected before or after 2013, given the introduction of the VHA’s OSI that year. The committee stratified by payment sources of dispensed opioid prescriptions during an episode: individuals were grouped as having prescriptions dispensed from only the VHA, only Medicare Part D, or both. Payment source of dispensed medication is a proxy for care, access, and coordination. Other research examining payment source suggest that multiple sources are associated with risky opioid prescribing, such as concurrent prescribing of opioid and benzodiazepine pharmacotherapy and prescribing with a high morphine milligram equivalents (MME)/day for opioid pharmacotherapy (Becker et al., 2017).
In addition, the committee repeated the main analysis for those with and without a recent surgery or outpatient procedure. This study included veterans with acute painful injury or inpatient/outpatient surgery/procedures because (1) the committee aims to focus on pain itself, (2) the treatment of acute pain can result in overdose or OUD, and (3) these individuals may initially manage acute pain related to surgery and/or other procedures using short-term opioid pharmacotherapy and are eventually prescribed opioid pharmacotherapy to manage chronic pain.
RESULTS
Among the 13,152,784 unique veterans who received care in the VHA 2007–2019, study 1 was split into two emulated target trials: Study 1a among veterans without and with a current dispensed benzodiazepine pharmacotherapy. Study 1a includes 5,636,207 unique veterans, further categorized as receiving either newly dispensed non-opioid pain pharmacotherapy (comparator group) or newly dispensed opioid pharmacotherapy (treatment group). The non-opioid pain pharmacotherapy group had 67,916 all-cause mortality and 1,094 suicide mortality deaths. The opioid pharmacotherapy group had 56,141 all-cause mortality and 566 suicide mortality deaths.
In Study 1b, there was a total of 319,990 unique veterans. Of these individuals, 208,219 were newly dispensed non-opioid pain pharmacotherapy and 111,771 were newly dispensed opioid pharmacotherapy. In the non-opioid pain pharmacotherapy group, there were 5,753 all-cause mortality and 197 suicide mortality deaths, and in the opioid pharmacotherapy group there were 5,369 all-cause mortality and 109 suicide mortality deaths.
Individuals Without a Current Dispensed Benzodiazepine (Study 1a)
Baseline Characteristics
In study 1a, 92.5 percent of participants were male, and the mean age was 60.2 years (SD13: 17.1). The racial distribution was 68.9 percent White, 17.9 percent Black, 0.9 percent Asian, 0.7 percent Native American, 0.8 percent Pacific Islander, and 0.8 percent multiracial or reporting more than race. About 10.1 percent were missing the race category. By ethnicity, 87.4 percent were of non-Hispanic ethnicity and 6.4 percent of Hispanic ethnicity. About 6.2 percent were missing the ethnicity category. Table 4-3 details the baseline characteristics of individuals newly dispensed opioid versus those newly dispensed non-opioid pain pharmacotherapy.
Before applying IPTW, baseline characteristics were generally similar between the treatment and comparator groups, except individuals newly dispensed opioid pharmacotherapy were more likely to be White, be in VA Priority Enrollment Group 5, to have rheumatic disease and to ever have Medicare Part D insurance coverage. After applying IPTW, covariates between both groups were well balanced, as indicated by all covariate ASMDs below 0.1. Approximately 20 percent of veterans in both groups had discontinued their initial treatment strategies by the 6-month follow-up (see supplement, Figures 4-7 and 4-12).
Mortality Outcomes
Table 4-4 presents the results for study 1a for all-cause and suicide mortality. In the per protocol analysis, the adjusted all-cause mortality rate was 6,473 per 100,000 person-years for those newly dispensed non-opioid pain pharmacotherapy versus 10,273 per 100,000 person-years for those newly dispensed opioid pharmacotherapy (adjusted HR: 1.61; 95% CI: 1.59–1.63). The ITT analysis resulted in an adjusted all-cause mortality rate of 4,952 versus 8,348 per 100,000 person-years for those newly dispensed opioid pharmacotherapy versus those newly dispensed non-opioid pain pharmacotherapy, respectively (adjusted HR: 1.69; 95% CI: 1.68–1.70).
For suicide mortality, the per protocol analysis resulted in an adjusted rate of 95 per 100,000 person-years for individuals newly dispensed non-opioid pain pharmacotherapy versus 112 per 100,000 person-years for individuals newly dispensed opioid pharmacotherapy (adjusted HR: 1.19; 95% CI: 1.07–1.32). In the ITT analysis, the suicide mortality rate was 65 versus 83 per 100,000 person-years for individuals newly dispensed non-opioid pain pharmacotherapy versus opioid pharmacotherapy (adjusted HR: 1.28; 95% CI: 1.20–1.37).
Survival curves demonstrate lower survival over time in those newly dispensed opioid pharmacotherapy, compared to those newly dispensed non-opioid pain pharmacotherapy among individuals without current benzodiazepine pharmacotherapy (see Figure 4-3).
Individuals with a Current Benzodiazepine Prescription (Study 1b)
Baseline Characteristics
For the cohort in study 1b, individuals were predominantly male (91.2 percent), and the mean age was 63.5 years (SD: 15.3). Racial distribution of veterans in study 1b was 78.9 percent White, 8.2 percent Black, 0.4 percent Asian, 0.6 percent Native American, 0.7 percent Pacific Islander, and 0.7 percent multiracial or reporting more than race. About 10.4 percent were missing the race category. By ethnicity, 87.1 percent of veterans were of non-Hispanic ethnicity and 6.6 percent Hispanic ethnicity. About 6.3 percent were missing the ethnicity category. Table 4-5 summarizes the baseline characteristics of individuals newly dispensed opioid pharmacotherapy versus individuals newly dispensed non-opioid pain pharmacotherapy among individuals with a current dispensed benzodiazepine pharmacotherapy, both before and after applying IPTW. The majority belonged to VHA enrollment priority group 1. Before IPTW weighting, baseline characteristics were generally similar between groups, with some exceptions (e.g., percent NSAID, see also Figure 4-6). After applying IPTW, covariate ASMDs were well
___________________
13 SD: standard deviation
| Covariate | Before Weighting | After IPTW | ||||
|---|---|---|---|---|---|---|
| Newly Dispensed Opioid Pharmacotherapy | Newly Dispensed Non-Opioid Pain Pharmacotherapy | ASMD1 | Newly Dispensed Opioid Pharmacotherapy | Newly Dispensed NonOpioid Pain Pharmacotherapy | ASMD | |
| Sex | ||||||
| Male | 93.75 | 91.89 | 0.07 | 92.31 | 92.43 | 0.00 |
| Female | 6.25 | 8.11 | 0.07 | 7.69 | 7.57 | 0.00 |
| Missing | 0.00 | 0.00 | 0.00 | . | 0.00 | . |
| Age | ||||||
| 18–34 | 8.92 | 12.07 | 0.10 | 10.56 | 11.01 | 0.02 |
| 35–54 | 20.57 | 23.70 | 0.08 | 22.88 | 22.78 | 0.00 |
| 55–74 | 46.64 | 45.80 | 0.02 | 46.29 | 46.07 | 0.01 |
| 75+ | 23.87 | 18.44 | 0.13 | 20.27 | 20.15 | 0.00 |
| Race | ||||||
| White | 71.85 | 67.65 | 0.09 | 68.36 | 68.83 | 0.01 |
| Black | 14.65 | 19.31 | 0.12 | 18.71 | 18.04 | 0.02 |
| Asian | 0.58 | 1.01 | 0.05 | 0.84 | 0.88 | 0.00 |
| Native American | 0.70 | 0.74 | 0.00 | 0.72 | 0.73 | 0.00 |
| Pacific Islander | 0.68 | 0.86 | 0.02 | 0.81 | 0.81 | 0.00 |
| Multiracial | 0.74 | 0.84 | 0.01 | 0.82 | 0.81 | 0.00 |
| Missing | 10.80 | 9.59 | 0.04 | 9.74 | 9.91 | 0.01 |
| Ethnicity | ||||||
| Non-Hispanic | 87.94 | 87.34 | 0.02 | 87.51 | 87.51 | 0.00 |
| Hispanic | 5.20 | 6.90 | 0.07 | 6.54 | 6.43 | 0.01 |
| Missing | 6.87 | 5.76 | 0.05 | 5.95 | 6.06 | 0.01 |
| Marital Status | ||||||
| Married | 51.06 | 50.44 | 0.01 | 50.40 | 50.54 | 0.00 |
| Not Married | 43.81 | 44.39 | 0.01 | 44.31 | 44.26 | 0.00 |
| Missing | 5.13 | 5.18 | 0.00 | 5.29 | 5.20 | 0.00 |
| Disability Status (Based on VA Enrollment Priority Group) |
||||||
| Enrollment Group 1 | 19.09 | 26.50 | 0.18 | 25.49 | 24.49 | 0.02 |
| Enrollment Group 2 | 7.58 | 8.14 | 0.02 | 7.88 | 7.96 | 0.00 |
| Enrollment Group 3 | 12.31 | 12.28 | 0.00 | 12.09 | 12.27 | 0.01 |
| Enrollment Group 4 | 1.50 | 1.32 | 0.02 | 1.47 | 1.40 | 0.01 |
| Enrollment Group 5 | 33.27 | 28.52 | 0.10 | 29.94 | 30.01 | 0.00 |
| Covariate | Before Weighting | After IPTW | ||||
|---|---|---|---|---|---|---|
| Newly Dispensed Opioid Pharmacotherapy | Newly Dispensed Non-Opioid Pain Pharmacotherapy | ASMD1 | Newly Dispensed Opioid Pharmacotherapy | Newly Dispensed NonOpioid Pain Pharmacotherapy | ASMD | |
| Enrollment Group 6 | 4.74 | 5.30 | 0.03 | 4.80 | 5.05 | 0.01 |
| Enrollment Group 7 | 3.65 | 3.06 | 0.03 | 3.14 | 3.21 | 0.00 |
| Enrollment Group 8 | 17.59 | 14.55 | 0.08 | 14.89 | 15.30 | 0.01 |
| Missing | 0.28 | 0.33 | 0.01 | 0.31 | 0.31 | 0.00 |
| Housing Security | ||||||
| History of homelessness (yes/no) | 9.11 | 10.31 | 0.04 | 10.88 | 10.10 | 0.03 |
| Health Behavior | ||||||
| Tobacco Use Ever (yes/no) | 44.70 | 41.98 | 0.06 | 43.68 | 42.99 | 0.01 |
| Health Conditions Physical Health Conditions |
||||||
| Acute Pain Injury | 9.89 | 8.73 | 0.04 | 9.65 | 9.23 | 0.01 |
| AIDS/HIV | 0.42 | 0.39 | 0.01 | 0.43 | 0.40 | 0.00 |
| Blood Loss Anemia | 1.18 | 0.75 | 0.04 | 0.94 | 0.91 | 0.00 |
| Cancer (non-melanoma skin) | 0.34 | 0.22 | 0.02 | 0.26 | 0.26 | 0.00 |
| Cardiovascular Disease | 18.00 | 13.46 | 0.13 | 15.21 | 14.95 | 0.01 |
| Cerebrovascular Disease | 4.60 | 3.33 | 0.07 | 3.84 | 3.76 | 0.00 |
| Chronic Lung Disease | 13.58 | 11.29 | 0.07 | 12.50 | 12.11 | 0.01 |
| Cirrhosis | 1.03 | 0.60 | 0.05 | 0.79 | 0.79 | 0.00 |
| COPD2 | 2.71 | 3.16 | 0.03 | 3.22 | 3.05 | 0.01 |
| Deficiency Anemia | 5.74 | 3.73 | 0.10 | 4.53 | 4.44 | 0.01 |
| Dementia | 2.64 | 2.52 | 0.01 | 2.72 | 2.60 | 0.01 |
| Diabetes | 20.37 | 21.23 | 0.02 | 21.47 | 21.09 | 0.01 |
| ESRD3 | 0.91 | 0.48 | 0.05 | 0.64 | 0.62 | 0.00 |
| Heart Disease | 17.74 | 13.19 | 0.13 | 14.91 | 14.67 | 0.01 |
| Hepatitis | 1.45 | 1.30 | 0.01 | 1.49 | 1.39 | 0.01 |
| Hemiplegia or Paraplegia | 0.63 | 0.53 | 0.01 | 0.60 | 0.57 | 0.00 |
| Covariate | Before Weighting | After IPTW | ||||
|---|---|---|---|---|---|---|
| Newly Dispensed Opioid Pharmacotherapy | Newly Dispensed Non-Opioid Pain Pharmacotherapy | ASMD1 | Newly Dispensed Opioid Pharmacotherapy | Newly Dispensed NonOpioid Pain Pharmacotherapy | ASMD | |
| Liver Disease | 2.17 | 1.77 | 0.03 | 1.97 | 1.96 | 0.00 |
| Migraine Peptic Ulcer Disease | 1.69 | 2.37 | 0.05 | 2.32 | 2.18 | 0.01 |
| Peripheral Vascular Disease | 4.20 | 3.25 | 0.05 | 3.68 | 3.58 | 0.01 |
| Pulmonary Circulation Disorders | 0.23 | 0.25 | 0.01 | 0.28 | 0.25 | 0.01 |
| Rheumatic Disease | 39.47 | 31.67 | 0.16 | 36.00 | 34.55 | 0.03 |
| Syncope | 0.51 | 0.49 | 0.00 | 0.54 | 0.50 | 0.01 |
| Sleep Disorders | ||||||
| Apnea | 4.10 | 5.84 | 0.08 | 5.63 | 5.37 | 0.01 |
| Insomnia | 0.89 | 0.85 | 0.01 | 0.91 | 0.87 | 0.00 |
| Mental Health | ||||||
| ADHD4 | 0.16 | 0.15 | 0.00 | 0.15 | 0.15 | 0.00 |
| Alcohol Use Disorder | 2.64 | 3.56 | 0.05 | 3.56 | 3.32 | 0.01 |
| Anxiety | 3.35 | 3.56 | 0.01 | 3.70 | 3.54 | 0.01 |
| Bipolar Disorder | 1.03 | 1.37 | 0.03 | 1.37 | 1.28 | 0.01 |
| Depression | 7.59 | 7.68 | 0.00 | 8.26 | 7.77 | 0.02 |
| Drug Use Disorder | 1.21 | 1.88 | 0.06 | 1.96 | 1.70 | 0.02 |
| Opioid Use Disorder | 0.40 | 0.56 | 0.02 | 0.60 | 0.52 | 0.01 |
| Posttraumatic Stress Disorder | 6.44 | 7.55 | 0.04 | 7.73 | 7.30 | 0.02 |
| Schizophrenia and Psychosis | 0.77 | 1.18 | 0.04 | 1.15 | 1.07 | 0.01 |
| Suicidal Ideation | 0.18 | 0.33 | 0.03 | 0.34 | 0.29 | 0.01 |
| TBI5 | 1.30 | 1.58 | 0.02 | 1.58 | 1.51 | 0.01 |
| Overdose-Related Diagnoses | ||||||
| Covariate | Before Weighting | After IPTW | ||||
|---|---|---|---|---|---|---|
| Newly Dispensed Opioid Pharmacotherapy | Newly Dispensed Non-Opioid Pain Pharmacotherapy | ASMD1 | Newly Dispensed Opioid Pharmacotherapy | Newly Dispensed NonOpioid Pain Pharmacotherapy | ASMD | |
| Opioid Overdose Diagnosis (in last 12 months) | 0.01 | 0.01 | 0.00 | 0.01 | 0.01 | 0.00 |
| Current Pain Intensity Rating (in past month) | ||||||
| Pain 0 | 32.44 | 38.77 | 0.13 | 35.12 | 36.45 | 0.03 |
| Pain 1 | 4.15 | 3.95 | 0.01 | 3.96 | 3.99 | 0.00 |
| Pain 2 | 4.97 | 4.76 | 0.01 | 4.81 | 4.81 | 0.00 |
| Pain 3 | 6.64 | 6.41 | 0.01 | 6.62 | 6.50 | 0.01 |
| Pain 4 | 6.30 | 5.90 | 0.02 | 6.23 | 6.05 | 0.01 |
| Pain 5 | 6.86 | 6.35 | 0.02 | 6.83 | 6.57 | 0.01 |
| Pain 6 | 5.64 | 5.10 | 0.02 | 5.58 | 5.34 | 0.01 |
| Pain 7 | 5.51 | 4.81 | 0.03 | 5.36 | 5.12 | 0.01 |
| Pain 8 | 5.25 | 4.21 | 0.05 | 4.90 | 4.64 | 0.01 |
| Pain 9 | 2.15 | 1.55 | 0.04 | 1.91 | 1.79 | 0.01 |
| Pain 10 | 1.95 | 1.36 | 0.05 | 1.70 | 1.60 | 0.01 |
| Missing | 18.13 | 16.83 | 0.03 | 16.98 | 17.14 | 0.00 |
| Body Mass Index | ||||||
| Underweight | 1.14 | 0.79 | 0.04 | 0.91 | 0.91 | 0.00 |
| Normal | 19.35 | 17.67 | 0.04 | 18.06 | 18.17 | 0.00 |
| Overweight | 31.95 | 33.51 | 0.03 | 32.72 | 32.97 | 0.01 |
| Obese | 35.87 | 39.70 | 0.08 | 39.12 | 38.64 | 0.01 |
| Missing | 11.69 | 8.33 | 0.11 | 9.19 | 9.31 | 0.00 |
| Health Care Coverage | ||||||
| Supplemental Health Insurance to VHA Coverage | 42.15 | 49.23 | 0.14 | 47.04 | 47.01 | 0.00 |
| Medicare (ever/never) | 19.06 | 9.74 | 0.27 | 12.71 | 12.60 | 0.00 |
| Health Care Utilization in Past Year | ||||||
| Number of VHA Outpatient Visits | ||||||
| Outpatient Visits (0–4) | 19.96 | 18.38 | 0.04 | 18.40 | 18.71 | 0.01 |
| Covariate | Before Weighting | After IPTW | ||||
|---|---|---|---|---|---|---|
| Newly Dispensed Opioid Pharmacotherapy | Newly Dispensed Non-Opioid Pain Pharmacotherapy | ASMD1 | Newly Dispensed Opioid Pharmacotherapy | Newly Dispensed NonOpioid Pain Pharmacotherapy | ASMD | |
| Outpatient Visits (4–11) | 21.94 | 24.15 | 0.05 | 22.69 | 23.28 | 0.01 |
| Outpatient Visits (12–21) | 18.93 | 20.17 | 0.03 | 19.40 | 19.71 | 0.01 |
| Outpatient Visits (22–42) | 19.84 | 19.50 | 0.01 | 19.72 | 19.67 | 0.00 |
| Outpatient Visits (43–67) | 9.52 | 8.79 | 0.03 | 9.40 | 9.13 | 0.01 |
| Outpatient Visits (68+) | 9.81 | 9.01 | 0.03 | 10.39 | 9.50 | 0.03 |
| Inpatient Hospital Admission | 0.23 | 0.12 | 0.03 | 0.16 | 0.15 | 0.00 |
| Inpatient Procedure/Surgery | 0.20 | 0.11 | 0.02 | 0.15 | 0.14 | 0.00 |
| Inpatient Surgery | ||||||
| Outpatient Procedure | 0.68 | 0.48 | 0.03 | 0.57 | 0.55 | 0.00 |
| Nursing Home Visit (Yes/No) | 0.66 | 0.39 | 0.04 | 0.55 | 0.50 | 0.01 |
| Military Status | ||||||
| Service Era | ||||||
| Gulf War | 22.21 | 31.83 | 0.22 | 28.35 | 28.79 | 0.01 |
| Korean War | 9.99 | 7.47 | 0.09 | 8.27 | 8.23 | 0.00 |
| Peacetime, only | 17.48 | 15.83 | 0.04 | 16.62 | 16.37 | 0.01 |
| Vietnam | 36.30 | 33.95 | 0.05 | 34.79 | 34.71 | 0.00 |
| WWII, only | 8.40 | 5.56 | 0.11 | 6.53 | 6.47 | 0.00 |
| Multiple Eras | 3.58 | 3.76 | 0.01 | 3.75 | 3.71 | 0.00 |
| Missing | 2.05 | 1.60 | 0.03 | 1.70 | 1.73 | 0.00 |
| Combat Service (yes/no) | ||||||
| Combat Service | 13.64 | 14.45 | 0.02 | 14.29 | 14.23 | 0.00 |
| Missing | 12.10 | 14.37 | 0.07 | 13.20 | 13.59 | 0.01 |
| Military Sexual Trauma (yes/no) | ||||||
| Military Sexual Trauma | 3.61 | 4.43 | 0.04 | 4.37 | 4.21 | 0.01 |
| Missing | 2.52 | 2.08 | 0.03 | 2.16 | 2.19 | 0.00 |
| Covariate | Before Weighting | After IPTW | ||||
|---|---|---|---|---|---|---|
| Newly Dispensed Opioid Pharmacotherapy | Newly Dispensed Non-Opioid Pain Pharmacotherapy | ASMD1 | Newly Dispensed Opioid Pharmacotherapy | Newly Dispensed NonOpioid Pain Pharmacotherapy | ASMD | |
| Military Branch | ||||||
| Air Force | 11.37 | 12.00 | 0.02 | 11.74 | 11.80 | 0.00 |
| Army | 45.20 | 47.74 | 0.05 | 47.59 | 47.12 | 0.01 |
| Marine | 8.03 | 8.91 | 0.03 | 8.45 | 8.61 | 0.01 |
| Navy | 16.40 | 16.01 | 0.01 | 15.96 | 16.09 | 0.00 |
| Missing | 19.01 | 15.34 | 0.10 | 16.26 | 16.38 | 0.00 |
| Prescription Information (Yes/No) | ||||||
| Anticonvulsant | 1.79 | 2.22 | 0.03 | 2.40 | 2.13 | 0.02 |
| Antihistamine | 4.42 | 4.98 | 0.03 | 5.24 | 4.87 | 0.02 |
| Anxiolytic | 1.64 | 2.04 | 0.03 | 2.09 | 1.95 | 0.01 |
| Buprenorphine (for pain) | 0.17 | 0.19 | 0.01 | 0.21 | 0.19 | 0.01 |
| Migraine | 3.13 | 4.21 | 0.06 | 4.52 | 3.95 | 0.03 |
| Acetaminophen | 66.67 | 21.20 | 1.03 | 34.87 | 35.00 | 0.00 |
| SNRI6 | 2.74 | 2.81 | 0.00 | 3.00 | 2.83 | 0.01 |
| TeCA7 | 3.77 | 3.54 | 0.01 | 3.92 | 3.68 | 0.01 |
| Facility Urbanicity | ||||||
| Non-Core | 38.54 | 43.83 | 0.11 | 41.59 | 42.15 | 0.01 |
| Micropolitan | 7.15 | 7.48 | 0.01 | 7.27 | 7.32 | 0.00 |
| Small Metro | 24.16 | 27.15 | 0.07 | 26.53 | 26.34 | 0.00 |
| Medium Metro | 5.78 | 6.16 | 0.02 | 5.87 | 6.00 | 0.01 |
| Large Fringe | 4.32 | 4.36 | 0.00 | 4.63 | 4.37 | 0.01 |
| Metro | ||||||
| Large Central | 0.23 | 0.25 | 0.01 | 0.24 | 0.24 | 0.00 |
| Metro | ||||||
| Missing | 19.81 | 10.77 | 0.25 | 13.86 | 13.58 | 0.01 |
1 ASMD: Absolute Standardized Mean Difference
2 COPD: chronic obstructive pulmonary disease.
3 ESRD: end-stage renal disease.
4 ADHD: attention-deficit/hyperactivity disorder.
5 TBI: traumatic brain injury.
6 SNRI: serotonin-norepinephrine reuptake inhibitor
7 TeCA: tetracyclic antidepressant
NOTE: No cell sizes of 10 or less are included in the reported results.
| Unweighted | Adjusted* | |||||||||
|---|---|---|---|---|---|---|---|---|---|---|
| Outcome | Newly Dispensed Non-Opioid Pain Pharmacotherapy (n = 3,995,883) | Newly Dispensed Opioid Pharmacotherapy (n = 1,640,324) | Hazard Ratio | 95% CI Lower | 95% CI Upper | Newly Dispensed Non-Opioid Pain Pharmacotherapy (n = 3,995,883) | Newly Dispensed Opioid Pharmacotherapy (n = 1,640,324) | Hazard Ratio | 95% CI Lower | 95% CI Upper |
| Rate per 100,000 person-years | Rate per 100,000 person-years | Rate per 100,000 person-years | Rate per 100,000 person-years | |||||||
| All-cause mortality | ||||||||||
|
Per Protocol |
6,215 | 1,603 | 1.91 | 1.89 | 1.93 | 6,473 | 10,273 | 1.61 | 1.59 | 1.63 |
|
Intent to Treat |
4,465 | 9,608 | 2.15 | 2.14 | 2.17 | 4,952 | 8,348 | 1.69 | 1.68 | 1.70 |
| Suicide Mortality | ||||||||||
|
Per Protocol (Primary Analysis) |
100 | 117 | 1.19 | 1.08 | 1.32 | 95 | 112 | 1.19 | 1.07 | 1.32 |
|
Intent to Treat |
64 | 87 | 1.35 | 1.27 | 1.44 | 65 | 83 | 1.28 | 1.20 | 1.37 |
NOTES: No cell sizes of 10 or less are included in the reported results.
Adjusted: estimates based on application of inverse probablility treatment weights (IPTW).
A unique veteran is able to have multiple episodes. In study 1, for veterans with multiple episodes, only one episode was randomly selected.
CI = confidence interval.
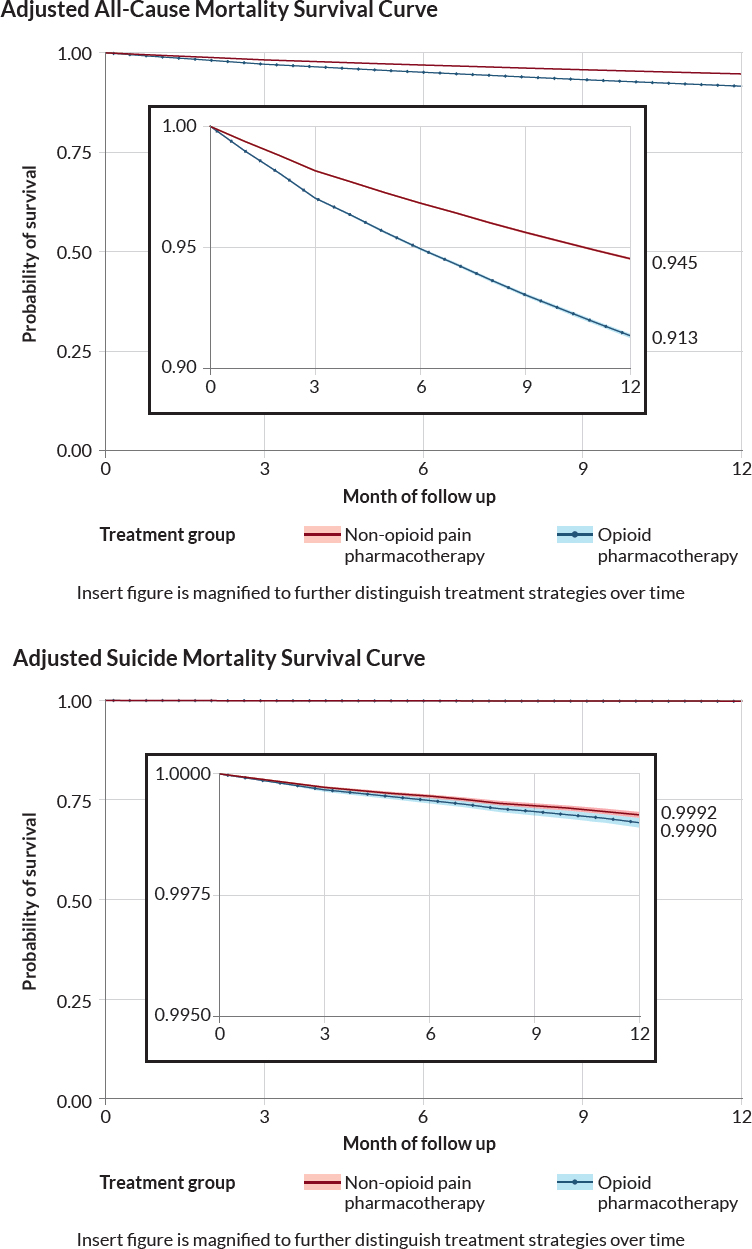
NOTES: No cells are reported representing 10 or fewer veterans. The y-axis range is compressed on the inset figure.
| Covariate | Before Weighting | After IPTW | ||||
|---|---|---|---|---|---|---|
| Newly Dispensed Opioid Pharmacotherapy | Newly Dispensed Non-Opioid Pain Pharmacotherapy | ASMD | Newly Dispensed Opioid Pharmacotherapy | Newly Dispensed Non-Opioid Pain Pharmacotherapy | ASMD | |
| Sex | ||||||
| Male | 91.95 | 90.56 | 0.05 | 90.91 | 90.97 | 0.00 |
| Female | 8.05 | 9.44 | 0.05 | 9.09 | 9.03 | 0.00 |
| Age | ||||||
| 18–34 | 5.20 | 6.57 | 0.06 | 5.92 | 6.37 | 0.02 |
| 35–54 | 16.74 | 19.36 | 0.07 | 18.61 | 18.32 | 0.01 |
| 55–74 | 51.35 | 52.98 | 0.03 | 52.42 | 52.47 | 0.00 |
| 75+ | 26.71 | 21.10 | 0.13 | 23.05 | 22.85 | 0.01 |
| Race | ||||||
| White | 79.55 | 78.80 | 0.02 | 78.95 | 78.94 | 0.00 |
| Black | 7.13 | 9.00 | 0.07 | 8.57 | 8.63 | 0.00 |
| Asian | 0.30 | 0.44 | 0.02 | 0.38 | 0.39 | 0.00 |
| Native American | 0.63 | 0.61 | 0.00 | 0.62 | 0.61 | 0.00 |
| Pacific Islander | 0.71 | 0.73 | 0.00 | 0.74 | 0.71 | 0.00 |
| Multiracial | 0.69 | 0.77 | 0.01 | 0.77 | 0.74 | 0.00 |
| Missing | 10.99 | 9.66 | 0.04 | 9.97 | 9.98 | 0.00 |
| Ethnicity | ||||||
| Non-Hispanic | 87.65 | 87.00 | 0.02 | 86.75 | 87.26 | 0.02 |
| Hispanic | 5.55 | 7.34 | 0.07 | 7.28 | 6.77 | 0.02 |
| Missing | 6.79 | 5.65 | 0.05 | 5.97 | 5.97 | 0.00 |
| Marital Status | ||||||
| Married | 52.51 | 51.30 | 0.02 | 51.44 | 51.50 | 0.00 |
| Not Married | 41.77 | 42.68 | 0.02 | 42.43 | 42.59 | 0.00 |
| Missing | 5.72 | 6.02 | 0.01 | 6.13 | 5.92 | 0.01 |
| Disability Status (Based on VA1 Enrollment Priority Group) |
||||||
| Enrollment Group 1 | 32.67 | 42.22 | 0.20 | 39.38 | 39.03 | 0.01 |
| Enrollment Group 2 | 6.28 | 5.94 | 0.01 | 6.07 | 6.39 | 0.01 |
| Enrollment Group 3 | 8.70 | 7.81 | 0.03 | 8.05 | 8.04 | 0.00 |
| Enrollment Group 4 | 2.30 | 2.32 | 0.00 | 2.38 | 2.43 | 0.00 |
| Enrollment Group 5 | 29.34 | 24.94 | 0.10 | 26.54 | 26.33 | 0.01 |
| Enrollment Group 6 | 2.41 | 2.39 | 0.00 | 2.29 | 2.34 | 0.00 |
| Enrollment Group 7 | 2.76 | 2.19 | 0.04 | 2.31 | 2.33 | 0.00 |
| Enrollment Group 8 | 15.33 | 12.02 | 0.10 | 12.80 | 12.93 | 0.00 |
| Missing | 0.20 | 0.18 | 0.00 | 0.19 | 0.19 | 0.00 |
| Covariate | Before Weighting | After IPTW | ||||
|---|---|---|---|---|---|---|
| Newly Dispensed Opioid Pharmacotherapy | Newly Dispensed Non-Opioid Pain Pharmacotherapy | ASMD | Newly Dispensed Opioid Pharmacotherapy | Newly Dispensed Non-Opioid Pain Pharmacotherapy | ASMD | |
| Housing Security | ||||||
| History of homelessness (yes/no) | 8.83 | 10.24 | 0.05 | 10.20 | 9.85 | 0.01 |
| Health Behavior | ||||||
| Tobacco Use Ever (yes/no) | 50.19 | 49.86 | 0.01 | 50.48 | 50.26 | 0.01 |
| Health Conditions | ||||||
| Physical Health Conditions | ||||||
| Acute Pain Injury | 12.66 | 12.34 | 0.01 | 13.17 | 12.52 | 0.02 |
| AIDS/HIV | 0.52 | 0.48 | 0.01 | 0.49 | 0.49 | 0.00 |
| Blood Loss Anemia | 1.63 | 1.16 | 0.04 | 1.40 | 1.35 | 0.00 |
| Cancer (non-melanoma skin) | 0.34 | 0.29 | 0.01 | 0.32 | 0.31 | 0.00 |
| Cardiovascular Disease | 25.18 | 20.34 | 0.12 | 22.28 | 21.92 | 0.01 |
| Cerebrovascular Disease | 6.46 | 5.14 | 0.06 | 5.64 | 5.58 | 0.00 |
| Chronic Lung Disease | 21.47 | 18.82 | 0.07 | 20.15 | 19.70 | 0.01 |
| Cirrhosis | 1.33 | 0.84 | 0.05 | 1.09 | 1.06 | 0.00 |
| COPD2 | 4.40 | 4.72 | 0.02 | 4.66 | 4.56 | 0.00 |
| Deficiency Anemia | 7.43 | 5.40 | 0.08 | 6.28 | 6.17 | 0.01 |
| Dementia | 4.95 | 5.13 | 0.01 | 5.16 | 5.06 | 0.00 |
| Diabetes | 23.36 | 25.05 | 0.04 | 24.89 | 24.44 | 0.01 |
| End-Stage Renal Disease | 1.17 | 0.63 | 0.06 | 0.83 | 0.82 | 0.00 |
| Heart Disease | 24.86 | 20.03 | 0.12 | 21.96 | 21.62 | 0.01 |
| Hepatitis | 1.99 | 1.81 | 0.01 | 2.00 | 2.01 | 0.00 |
| Hemiplegia or Paraplegia | 0.88 | 0.93 | 0.01 | 0.92 | 0.91 | 0.00 |
| Liver Disease | 2.75 | 2.42 | 0.02 | 2.67 | 2.58 | 0.01 |
| Migraine | 3.22 | 3.86 | 0.04 | 3.77 | 3.64 | 0.01 |
| Peptic Ulcer Disease | 0.99 | 0.67 | 0.04 | 0.84 | 0.81 | 0.00 |
| Peripheral Vascular Disease | 5.06 | 4.13 | 0.04 | 4.52 | 4.43 | 0.00 |
| Pulmonary Circulation Disorders | 0.24 | 0.29 | 0.01 | 0.29 | 0.27 | 0.00 |
| Rheumatic Disease | 47.78 | 40.96 | 0.14 | 45.27 | 43.84 | 0.03 |
| Syncope | 0.79 | 0.84 | 0.01 | 0.90 | 0.84 | 0.01 |
| Covariate | Before Weighting | After IPTW | ||||
|---|---|---|---|---|---|---|
| Newly Dispensed Opioid Pharmacotherapy | Newly Dispensed Non-Opioid Pain Pharmacotherapy | ASMD | Newly Dispensed Opioid Pharmacotherapy | Newly Dispensed Non-Opioid Pain Pharmacotherapy | ASMD | |
| Sleep Disorders | ||||||
| Apnea | 5.33 | 7.24 | 0.08 | 6.70 | 6.66 | 0.00 |
| Insomnia | 4.01 | 3.81 | 0.01 | 3.96 | 3.85 | 0.01 |
| Mental Health | ||||||
| ADHD3 | 0.48 | 0.48 | 0.00 | 0.49 | 0.59 | 0.01 |
| Alcohol Use Disorder | 3.81 | 4.92 | 0.05 | 4.77 | 5.01 | 0.01 |
| Anxiety | 21.93 | 22.98 | 0.03 | 22.72 | 22.55 | 0.00 |
| Bipolar Disorder | 4.81 | 6.05 | 0.06 | 5.74 | 5.58 | 0.01 |
| Depression | 24.07 | 24.76 | 0.02 | 25.12 | 24.44 | 0.02 |
| Drug Use Disorder | 1.73 | 2.41 | 0.05 | 2.42 | 2.29 | 0.01 |
| Opioid Use Disorder | 0.74 | 0.88 | 0.02 | 0.93 | 0.95 | 0.00 |
| Posttraumatic Stress Disorder | 23.18 | 26.08 | 0.07 | 25.51 | 25.39 | 0.00 |
| Schizophrenia and Psychosis | 2.73 | 4.56 | 0.10 | 4.00 | 3.88 | 0.01 |
| Suicidal Ideation | 0.52 | 0.83 | 0.04 | 0.78 | 0.83 | 0.01 |
| Traumatic Brain Injury | 2.16 | 2.62 | 0.03 | 2.55 | 2.45 | 0.01 |
| Overdose-Related Diagnoses | ||||||
| Opioid Overdose Diagnosis (in last 12 months) | 0.04 | 0.03 | 0.01 | 0.03 | 0.03 | 0.00 |
| Current Pain Intensity Rating (in past month) | ||||||
| Pain 0 | 30.87 | 38.33 | 0.16 | 34.35 | 35.50 | 0.02 |
| Pain 1 | 3.83 | 4.04 | 0.01 | 4.05 | 3.93 | 0.01 |
| Pain 2 | 4.64 | 4.58 | 0.00 | 4.70 | 4.58 | 0.01 |
| Pain 3 | 6.63 | 6.28 | 0.01 | 6.60 | 6.38 | 0.01 |
| Pain 4 | 6.22 | 5.51 | 0.03 | 5.91 | 6.09 | 0.01 |
| Pain 5 | 7.01 | 6.06 | 0.04 | 6.61 | 6.41 | 0.01 |
| Pain 6 | 5.79 | 4.84 | 0.04 | 5.43 | 5.32 | 0.01 |
| Pain 7 | 5.77 | 4.68 | 0.05 | 5.32 | 5.11 | 0.01 |
| Pain 8 | 5.39 | 4.18 | 0.06 | 4.91 | 4.67 | 0.01 |
| Pain 9 | 2.18 | 1.58 | 0.04 | 1.89 | 1.82 | 0.01 |
| Pain 10 | 1.80 | 1.30 | 0.04 | 1.57 | 1.51 | 0.01 |
| Missing | 19.87 | 18.62 | 0.03 | 18.64 | 18.68 | 0.00 |
| Body Mass Index | ||||||
| Underweight | 1.37 | 0.97 | 0.04 | 1.12 | 1.09 | 0.00 |
| Normal | 20.99 | 19.16 | 0.05 | 19.65 | 20.04 | 0.01 |
| Overweight | 32.93 | 34.32 | 0.03 | 33.62 | 33.83 | 0.00 |
| Obese | 34.63 | 38.04 | 0.07 | 37.37 | 36.74 | 0.01 |
| Missing | 10.09 | 7.50 | 0.09 | 8.24 | 8.29 | 0.00 |
| Covariate | Before Weighting | After IPTW | ||||
|---|---|---|---|---|---|---|
| Newly Dispensed Opioid Pharmacotherapy | Newly Dispensed Non-Opioid Pain Pharmacotherapy | ASMD | Newly Dispensed Opioid Pharmacotherapy | Newly Dispensed Non-Opioid Pain Pharmacotherapy | ASMD | |
| Health Care Coverage | ||||||
| Supplemental Health Insurance to VHA4 Coverage | 39.79 | 47.75 | 0.16 | 44.84 | 45.08 | 0.01 |
| Medicare (ever/never) | 23.30 | 13.38 | 0.26 | 16.80 | 16.58 | 0.01 |
| Health Care Utilization in Past Year | ||||||
| Number of VA Outpatient Visits | ||||||
| VA Outpatient Visits (0–4) | 8.50 | 5.47 | 0.12 | 6.52 | 6.44 | 0.00 |
| VA Outpatient Visits (4–11) | 14.94 | 13.38 | 0.05 | 13.42 | 13.60 | 0.01 |
| VA Outpatient Visits (12–21) | 18.01 | 18.91 | 0.02 | 18.01 | 18.24 | 0.01 |
| VA Outpatient Visits (22–42) | 24.85 | 26.78 | 0.04 | 25.86 | 26.53 | 0.02 |
| VA Outpatient Visits (43–67) | 15.01 | 15.81 | 0.02 | 15.70 | 15.64 | 0.00 |
| VA Outpatient Visits (68+) | 18.70 | 19.64 | 0.02 | 20.48 | 19.54 | 0.02 |
| Inpatient Hospital Admission | 0.21 | 0.15 | 0.01 | 0.17 | 0.16 | 0.00 |
| Inpatient Procedure | 0.19 | 0.15 | 0.01 | 0.18 | 0.17 | 0.00 |
| Inpatient Procedure/Inpatient Surgery | ||||||
| Outpatient Procedure | 0.88 | 0.72 | 0.02 | 0.83 | 0.77 | 0.01 |
| Nursing Home Visit (Yes/No) | 0.71 | 0.51 | 0.03 | 0.63 | 0.59 | 0.01 |
| Military Status | ||||||
| Service Era | ||||||
| Gulf War | 15.11 | 20.56 | 0.14 | 18.45 | 19.15 | 0.02 |
| Korean War | 11.55 | 8.91 | 0.09 | 9.84 | 9.74 | 0.00 |
| Peacetime, only | 16.93 | 16.05 | 0.02 | 16.49 | 16.22 | 0.01 |
| Vietnam | 41.36 | 42.56 | 0.02 | 42.17 | 41.85 | 0.01 |
| WWII, only | 9.60 | 6.94 | 0.10 | 7.94 | 7.84 | 0.00 |
| Multiple Eras | 3.13 | 3.33 | 0.01 | 3.26 | 3.36 | 0.01 |
| Missing | 2.31 | 1.65 | 0.05 | 1.85 | 1.84 | 0.00 |
| Combat Service (yes/no) | ||||||
| Combat Service | 17.26 | 18.27 | 0.03 | 17.95 | 18.15 | 0.01 |
| Missing | 9.12 | 9.97 | 0.03 | 9.45 | 9.51 | 0.00 |
| Military Sexual Trauma (yes/no) | ||||||
| Military Sexual Trauma | 6.25 | 7.47 | 0.05 | 7.28 | 7.14 | 0.01 |
| Missing | 2.17 | 1.99 | 0.01 | 2.06 | 2.02 | 0.00 |
| Military Branch | ||||||
| Air Force | 11.11 | 11.56 | 0.01 | 11.44 | 11.26 | 0.01 |
| Covariate | Before Weighting | After IPTW | ||||
|---|---|---|---|---|---|---|
| Newly Dispensed Opioid Pharmacotherapy | Newly Dispensed Non-Opioid Pain Pharmacotherapy | ASMD | Newly Dispensed Opioid Pharmacotherapy | Newly Dispensed Non-Opioid Pain Pharmacotherapy | ASMD | |
| Army | 47.14 | 49.84 | 0.05 | 49.10 | 48.91 | 0.00 |
| Marine | 6.70 | 7.22 | 0.02 | 7.02 | 7.32 | 0.01 |
| Navy | 15.88 | 15.58 | 0.01 | 15.60 | 15.64 | 0.00 |
| Missing | 19.18 | 15.80 | 0.09 | 16.84 | 16.88 | 0.00 |
| Prescription Information (Yes/No) | ||||||
| Anticonvulsant | 4.02 | 4.86 | 0.04 | 4.83 | 4.56 | 0.01 |
| Antihistamine | 7.37 | 8.51 | 0.04 | 8.37 | 8.50 | 0.00 |
| Anxiolytic | 4.38 | 5.75 | 0.06 | 5.38 | 5.24 | 0.01 |
| Buprenorphine (for pain) | 0.30 | 0.26 | 0.01 | 0.29 | 0.27 | 0.00 |
| Migraine | 5.67 | 6.68 | 0.04 | 6.79 | 6.36 | 0.02 |
| Acetaminophen | 69.42 | 28.63 | 0.89 | 43.28 | 42.81 | 0.01 |
| SNRI5 | 7.91 | 8.84 | 0.03 | 8.62 | 8.46 | 0.01 |
| TeCA6 | 9.87 | 10.05 | 0.01 | 10.27 | 9.98 | 0.01 |
| Facility Urbanicity | ||||||
| Non-Core | 32.78 | 37.61 | 0.10 | 35.43 | 36.25 | 0.02 |
| Micropolitan | 7.27 | 7.57 | 0.01 | 7.43 | 7.37 | 0.00 |
| Small Metro | 23.04 | 26.19 | 0.07 | 25.15 | 24.93 | 0.01 |
| Medium Metro | 6.88 | 7.61 | 0.03 | 7.29 | 7.25 | 0.00 |
| Large Fringe Metro | 4.51 | 4.54 | 0.00 | 4.64 | 4.77 | 0.01 |
| Large Central Metro | 0.34 | 0.40 | 0.01 | 0.36 | 0.37 | 0.00 |
| Missing | 25.17 | 16.08 | 0.23 | 19.70 | 19.07 | 0.02 |
1 VA: Department of Veterans Affairs
2 COPD: Chronic obstructive pulmonary disease.
3 ADHD: Attention-deficit/hyperactivity disorder.
4 VHA: Veterans Health Administration.
5 SNRI: Serotonin-norepinephrine reuptake inhibitor.
6 TeCA: Tetracyclic antidepressant.
NOTE: No cells are reported representing 10 or fewer veterans.
below 0.1, indicating good balance between the groups (see supplement Figure 4-11). Supplement Figures 4-7 and 4-12 illustrate adherence to treatment strategies, which was generally similar across treatment groups. By the 6-month follow-up, approximately 30 percent of veterans in both groups had discontinued their initial treatment strategies.
Mortality Outcomes
Among individuals with a current dispensed benzodiazepine pharmacotherapy prescription, Table 4-6 presents the results from the per protocol and ITT analyses comparing mortality between individuals newly dispensed opioid pharmacotherapy versus individuals newly dispensed non-opioid pain pharmacotherapy.
Based on results of the per protocol analysis, the adjusted all-cause mortality rate was 7,441 deaths per 100,000 person-years in the newly dispensed non-opioid pain pharmacotherapy group and 11,877 deaths per 100,000 person-years in the newly dispensed opioid pharmacotherapy group, resulting in an adjusted HR for all-cause mortality of 1.59 (95% CI: 1.53–1.65). The ITT analysis resulted in adjusted all-cause mortality rate of 7,037 deaths per 100,000 person-years for individuals newly dispensed non-opioid pain pharmacotherapy versus 10,850 deaths per 100,000 person-years for individuals newly dispensed opioid pharmacotherapy (adjusted HR: 1.54; 95% CI: 1.50–1.58).
For suicide mortality, the per protocol analysis resulted in an adjusted mortality rate of 238 deaths per 100,000 person-years in the newly dispensed non-opioid pain pharmacotherapy compared to 246 deaths per 100,000 person-years for the newly dispensed opioid pharmacotherapy treatment group (adjusted HR: 1.03; 95% CI: 0.81–1.31). In the ITT analysis, the suicide mortality rate was 189 deaths versus 200 deaths per 100,000 person-years for individuals newly dispensed non-opioid pain pharmacotherapy versus individuals newly dispensed opioid pharmacotherapy (adjusted HR: 1.06; 95% CI: 0.90–1.26).
Survival curves demonstrate lower survival over time in those newly dispensed opioid pharmacotherapy, compared to those dispensed non-opioid pain pharmacotherapy among individuals with current benzodiazepine pharmacotherapy (see Figure 4-4).
Subgroup Analyses
Results from subgroup analyses of the per protocol effect from study 1a (individuals without a current dispensed benzodiazepine pharmacotherapy) were largely consistent with the overall adjusted HR, with a few notable exceptions. Tables 4-7 and 4-8 present the mortality rates and HRs for all-cause mortality and suicide mortality among individuals without a current benzodiazepine pharmacotherapy by various subgroups.
For study 1b (individuals with current dispensed benzodiazepine pharmacotherapy), subgroup per protocol estimates were similar in magnitude and direction to the overall results for both all-cause and suicide mortality, with a few exceptions. For instance, the adjusted HR for all-cause mortality was higher among veterans whose pain pharmacotherapy claims were dispensed from only Medicare Part D; the higher adjusted HR, which was observed in both studies 1a and 1b (with and without a current benzodiazepine pharmacotherapy). Tables 4-9 and 4-10 present the adjusted mortality rates and HRs for all-cause mortality and suicide mortality among individuals with a current dispensed benzodiazepine pharmacotherapy by various subgroups.
See supplementary Tables 4-11 and 4-12 and Figures 4-5, 4-6, 4-7, 4-8, 4-9, 4-10, 4-11, 4-12, 4-13, and 4-14 for further details.
DISCUSSION
Studies 1a and 1b examined the effect of newly dispensed opioid pharmacotherapy on all-cause mortality and suicide mortality in two groups of veterans receiving care at the VHA: individuals without a current benzodiazepine pharmacotherapy (study 1a) and individuals with a current benzodiazepine pharmacotherapy (study 1b). The study was conducted in response to two parts of the statement of task to examine (a) the effect of opioid prescribing, relative to alternative non-opioid treatments, and (d) the effect of initiating opioids among veterans
| Unweighted | Adjusted* | |||||||||
|---|---|---|---|---|---|---|---|---|---|---|
| Outcome | Newly Dispensed Non-Opioid Pain Pharmacotherapy (N = 208,219) | Newly Dispensed Opioid Pharmacotherapy (N = 111,771) | Hazard Ratio | 95% CI Lower | 95% CI Upper | Newly Dispensed Non-Opioid Pain Pharmacotherapy (N = 208,219) | Newly Dispensed Opioid Pharmacotherapy (N = 111,771) | Hazard Ratio | 95% CI Lower | 95% CI Upper |
| Death per 100,000 person-years | Death per 100,000 person-years | Death per 100,000 person-years | Death per 100,000 person-years | |||||||
| All-cause Mortality | ||||||||||
| Per Protocol (Primary Analysis) | 7,249 | 12,792 | 1.77 | 1.71 | 1.84 | 7,441 | 11,877 | 1.59 | 1.53 | 1.65 |
| Intent to Treat (Secondary Analysis) | 6,567 | 11,974 | 1.82 | 1.78 | 1.87 | 7,037 | 10,850 | 1.54 | 1.50 | 1.58 |
| Suicide Mortality | ||||||||||
| Per Protocol (Primary Analysis) | 248 | 260 | 1.05 | 0.83 | 1.33 | 238 | 246 | 1.03 | 0.81 | 1.31 |
| Intent to Treat (Secondary Analysis) | 188 | 202 | 1.07 | 0.91 | 1.27 | 189 | 200 | 1.06 | 0.90 | 1.26 |
NOTES: No cell sizes of 10 or less are included in the reported results.
Adjusted = estimates based on application of inverse probably treatment weights (IPTW), CI = confidence interval.
A unique veteran is able to have multiple episodes. In Study 1, for veterans with multiple episodes, only one episode was randomly selected.

NOTE: No cells are reported representing 10 or fewer veterans. In the insert figure, the y-range is compressed.
| All-Cause Mortality | Without Current Benzodiazepine Pharmacotherapy | ||
|---|---|---|---|
| Adjusted | |||
| Sensitivity Analysis | All-Cause Mortality Death Rate | Hazard ratio (CI1) | |
| Newly Dispensed Non-opioid Pain Pharmacotherapy | Newly Dispensed Opioid Pharmacotherapy | ||
| OVERALL | 6,473 | 10,273 | 1.61 (1.59–1.63) |
| Insurance Coverage | |||
| CMS only | 15,163 | 35,566 | 2.27 (2.23–2.31) |
| DUAL: both VHA / CMS | 4,283 | 4,886 | 1.15 (1.10–1.20) |
| VHA only | 5,084 | 5,989 | 1.20 (1.18–1.22) |
| Sex | |||
| Gender—male | 6,803 | 10,775 | 1.60 (1.58–1.62) |
| Gender—female | 1,936 | 3,198 | 1.66 (1.52–1.81) |
| Age ≤65+ | |||
| 18–64 | 2,377 | 3,078 | 1.31 (1.28–1.35) |
| 65+ | 11,126 | 20,159 | 1.79 (1.77–1.81) |
| Age (Categorical) | |||
| 18–34 | 704 | 830 | 1.15 (0.99–1.33) |
| 35–54 | 1,532 | 1,983 | 1.31 (1.24–1.38) |
| 55–74 | 4,347 | 6,421 | 1.49 (1.46–1.53) |
| 75+ | 17,719 | 32,655 | 1.80 (1.77–1.82) |
| Ethnicity | |||
| Hispanic (no) | 6,037 | 9,513 | 1.60 (1.58–1.62) |
| Hispanic (yes) | 4,166 | 5,985 | 1.45 (1.35–1.55) |
| Hispanic (missing) | 14,644 | 26,034 | 1.78 (1.73–1.83) |
| Race | |||
| White | 6,248 | 10,012 | 1.62 (1.60–1.65) |
| Black | 4,256 | 5,986 | 1.42 (1.37–1.48) |
| Asian | 2,882 | 11,126 | 3.93 (3.31–4.66) |
| Hawaiian | 5,277 | 8,335 | 1.60 (1.37–1.87) |
| Native | 4,902 | 5,607 | 1.15 (0.97–1.36) |
| Multi | 4,341 | 5,886 | 1.38 (1.16–1.64) |
| Missing | 12,326 | 20,694 | 1.69 (1.65–1.74) |
| Surgical Procedure | |||
| Surgery/Procedure | 8,755 | 13,151 | 1.49 (1.39–1.61) |
| No Surgery/Procedure | 6,423 | 10,221 | 1.61 (1.59–1.63) |
| Study Year | |||
| Study Year 2007–2012 | 7,735 | 11,459 | 1.51 (1.49–1.53) |
| Study Year 2014–2019 | 5,327 | 8,697 | 1.64 (1.61–1.68) |
1 CI: Confidence Interval.
NOTE: No cells are reported representing 10 or fewer veterans.
| Suicide Mortality | Without Current Benzodiazepine Pharmacotherapy | ||
|---|---|---|---|
| Sensitivity Analysis | Adjusted | ||
| Suicide Mortality Death Rate | Hazard ratio (CI) | ||
| Newly Dispensed Non-opioid Pain Pharmacotherapy | Newly Dispensed Opioid Pharmacotherapy | ||
| OVERALL | 95 | 112 | 1.19 (1.07–1.32) |
| Insurance Coverage | |||
| CMS only | 68 | 118 | 1.68 (1.27–2.22) |
| DUAL: both VHA / CMS | 35 | 49 | 1.44 (0.93–2.21) |
| VHA only | 116 | 118 | 1.03 (0.91–1.17) |
| Sex | |||
| Gender—male | 99 | 115 | 1.17 (1.05–1.31) |
| Gender—female | 44 | 55 | 1.28 (0.69–2.39) |
| Age ≤65+ | |||
| 18–64 | 121 | 114 | 0.96 (0.84–1.11) |
| 65+ | 70 | 108 | 1.52 (1.28–1.81) |
| Age (Categorical) | |||
| 18–34 | 214 | 168 | 0.78 (0.57–1.06) |
| 35–54 | 139 | 124 | 0.91 (0.73–1.12) |
| 55–74 | 72 | 101 | 1.42 (1.20–1.67) |
| 75+ | 74 | 122 | 1.58 (1.25–1.99) |
| Ethnicity | |||
| Hispanic (no) | 91 | 111 | 1.23 (1.10–1.38) |
| Hispanic (yes) | 74 | 63 | 0.86 (0.45–1.61) |
| Hispanic (missing) | 173 | 217 | 1.26 (0.93–1.70) |
| Race | |||
| White | 101 | 122 | 1.22 (1.08–1.38) |
| Black | 45 | 23 | 0.51 (0.28–0.93) |
| Asian | * | * | * |
| Hawaiian | * | * | * |
| Native American | * | * | * |
| Multiracial | * | * | * |
| Missing | 153 | 204 | 1.34 (1.04–1.72) |
| Surgical Procedure | |||
| Surgery/Procedure | 110 | 145 | 1.35 (0.67–2.72) |
| No Surgery/Procedure | 95 | 111 | 1.18 (1.06–1.32) |
| Study Year | |||
| Study Year 2007–2012 | 106 | 124 | 1.18 (1.03–1.36) |
| Study Year 2014–2019 | 89 | 97 | 1.10 (0.91–1.33) |
NOTE: No cells are reported representing 10 or fewer veterans.
* Suppressed to comply with privacy requirements.
| All-Cause Mortality | With Current Benzodiazepine Pharmacotherapy | ||
|---|---|---|---|
| Sensitivity Analysis | Adjusted | ||
| All-Cause Mortality Death Rate | Hazard ratio (CI) | ||
| Newly Dispensed Non-opioid Pain Pharmacotherapy | Newly Dispensed Opioid Pharmacotherapy | ||
| OVERALL | 7,441 | 11,877 | 1.59 (1.53–1.65) |
| Insurance Coverage | |||
| CMS only | 15,315 | 34,066 | 2.16 (2.04–2.30) |
| DUAL: both VHA/CMS | 3,649 | 4,362 | 1.46 (1.32–1.61) |
| VHA only | 6,141 | 7,918 | 1.29 (1.22–1.37) |
| Sex | |||
| Gender—male | 7,908 | 12,574 | 1.59 (1.52–1.65) |
| Gender—female | 2,427 | 3,748 | 1.53 (1.20–1.94) |
| Age ≤65+ | |||
| 18–64 | 3,145 | 4,138 | 1.32 (1.21–1.44) |
| 65+ | 12,071 | 21,102 | 1.71 (1.64–1.79) |
| Age (Categorical) | |||
| 18–34 | 1,811 | 1,934 | 1.07 (0.71–1.63) |
| 35–54 | 2,281 | 3,049 | 1.35 (1.14–1.60) |
| 55–74 | 4,629 | 6,768 | 1.46 (1.37–1.57) |
| 75+ | 16,648 | 22,347 | 1.85 (1.77–1.94) |
| Ethnicity | |||
| Hispanic (no) | 7,005 | 11,331 | 1.62 (1.55–1.68) |
| Hispanic (yes) | 4,749 | 6,091 | 1.25 (1.01–1.55) |
| Hispanic (missing) | 7,399 | 80,056 | 10.98 (10.98–10.98) |
| Race | |||
| Race (White) | 7,038 | 11,338 | 1.61 (1.54–1.68) |
| Race (Black) | 4,192 | 6,532 | 1.55 (1.28–1.88) |
| Race (Asian) | * | * | * |
| Race (Hawaiian) | 5,510 | 8,436 | 1.55 (0.86–2.8) |
| Race (Native American) | 3,602 | 8,895 | 2.52 (1.29–4.97) |
| Race (Multiracial) | 3,536 | 11,461 | 3.46 (1.93–6.18) |
| Race (Missing) | 11,263 | 26,229 | 1.94 (1.94–1.94) |
| Surgical Procedure | |||
| Surgery/Procedure | 8,054 | 12,054 | 1.48 (1.14–1.92) |
| No Surgery/Procedure | 7,419 | 11,910 | 1.60 (1.54–1.66) |
| Study Year | |||
| Study Year 2007–2012 | 7,273 | 9,797 | 1.36 (1.28–1.43) |
| Study Year 2014–2019 | 7,581 | 14,282 | 1.84 (1.73–1.96) |
* Suppressed to comply with privacy requirements.
NOTE: No cells are reported representing 10 or fewer veterans.
| Suicide Mortality | With Current Benzodiazepine Pharmacotherapy | ||
|---|---|---|---|
| Sensitivity Analysis | Adjusted | ||
| Suicide Mortality Death Rate | Hazard ratio | ||
| Newly Dispensed Non-opioid Pain Pharmacotherapy | Newly Dispensed Opioid Pharmacotherapy | ||
| OVERALL | 238 | 246 | 1.03 (0.81–1.31) |
| Insurance Coverage | |||
| CMS only | 213 | 261 | 1.20 (0.68–2.13) |
| DUAL: both VHA/CMS | * | * | * |
| VHA only | 274 | 268 | 0.98 (0.73–1.32) |
| Sex | |||
| Gender—male | 239 | 243 | 1.01 (0.78–1.30) |
| Gender—female | * | * | * |
| Age ≤65+ | |||
| 18–64 | 286 | 306 | 1.08 (0.79–1.46) |
| 65+ | 183 | 208 | 1.11 (0.75–1.64) |
| Age (Categorical) | |||
| 18–34 | * | * | * |
| 35–54 | 310 | 399 | 1.28 (0.8–2.04) |
| 55–74 | 209 | 166 | 0.79 (0.53–1.18) |
| 75+ | 186 | 184 | 1.31 (0.83–2.07) |
| Ethnicity | |||
| Hispanic (no) | 251 | 240 | 0.95 (0.73–1.24) |
| Hispanic (yes) | * | * | * |
| Hispanic (missing) | 0 | 0 | 0.11 (0.04–0.32) |
| Race | |||
| Race (White) | 241 | 258 | 1.07 (0.82–1.40) |
| Race (Black) | * | * | * |
| Race (Asian) | * | * | * |
| Race (Hawaiian) | * | * | * |
| Race (Native American) | * | * | * |
| Race (Multiracial) | * | * | * |
| Race (Missing) | 0 | 0 | Failed to converge |
| Surgical Procedure | |||
| Surgery/Procedure | * | * | * |
| No Surgery/Procedure | 232 | 246 | 1.05 (0.82–1.35) |
| Study Year | |||
| Study Year 2007–2012 | 295 | 268 | 0.91 (0.67–1.24) |
| Study Year 2014–2019 | 181 | 213 | 1.15 (0.72–1.84) |
* Suppressed to comply with privacy requirements.
NOTE: No cells are reported representing 10 or fewer veterans.
already taking benzodiazepines. To respond to the statement of task, especially (d), the study population was stratified into two groups: those without a current benzodiazepine pharmacotherapy and those with a current benzodiazepine pharmacotherapy.
All-Cause Mortality and Suicide Mortality
Findings for all-cause mortality was consistent across the ITT and per protocol analyses.
These findings align with research among the general population demonstrating that long-term use of opioid pharmacotherapy is linked to medical conditions that may lead to death, including respiratory conditions (Ray et al., 2016), cardiovascular events (Sung et al., 2024), adverse effects on gastrointestinal, endocrine, and immunologic systems (Chou et al., 2015; Khansari et al., 2013; Leppert, 2012; Brack et al., 2011), opioid addiction, and overdose death. Non-VA studies have indicated that a proportion of opioid-naïve individuals who receive opioid pharmacotherapy for acute pain treatment or post-surgery pain management may be prescribed long-term opioid pharmacotherapy (Brummett et al., 2017; Kyriacou, 2017; Deyo et al., 2017; Shah et al., 2017). Similarly, veterans often initiate use of opioid medications due to service-related injuries (Kelber et al., 2022; Golub and Bennett, 2013).
As detailed in chapters 1 and 6, outcomes such as all-cause mortality, deaths to accidents, suicide, and overdose, regardless of misuse, are associated with concurrent long-term opioid pharmacotherapy and benzodiazepine pharmacotherapy (VA/DoD, 2022; Gibbons et al., 2021; Xu et al., 2020; Bohnert and Ilgen, 2019; Gressler et al., 2018; Sun et al., 2017; VA/DoD, 2017; Park et al., 2015). Since veterans disproportionately experience both physical and psychological trauma, many receive treatment for both chronic pain and mental health conditions, increasing the likelihood of concurrent use of opioid and benzodiazepine pharmacotherapies (NASEM, 2018). In addition to the ongoing efforts of VHA to address the opioid crisis discussed (e.g., updating the CPGs), prescription drug monitoring programs could be useful tools for providers to avoid prescribing opioid pharmacotherapy to veterans already prescribed benzodiazepine pharmacotherapy. This is crucial because veterans can receive prescriptions from multiple providers (e.g., across the VHA, Medicare, and private insurance).14
Consistent across the ITT and per protocol analyses, findings show that among veterans without current benzodiazepine pharmacotherapy (study 1a), individuals newly dispensed opioid (versus non-opioid pain) pharmacotherapy had an increased risk of suicide mortality. For veterans with currently dispensed benzodiazepine pharmacotherapy (study 1b), the 1.03 for suicide mortality and imprecision resulted in inconclusive findings. Research has identified an association of all-cause mortality in the veteran population with incident fills of opioid pharmacotherapy and benzodiazepine pharmacotherapies in the Veteran Aging Cohort Study (Gaither et al., 2016, Weisberg et al., 2015) and veterans with PTSD (Hawkins et al., 2023). Consistent findings for all-cause mortality were identified across studies with different comparison groups (e.g., no analgesic use versus opioid-only versus non-opioid pain pharmacotherapy as a comparison), criteria for a opioid fill (e.g., >90 days, ≥7 days) and a benzodiazepine fill (e.g., ≥7 days, >5 tablets), proxy definitions for overlapping use of an opioid and benzodiazepine through fill data (e.g., co-prescription, overlap of ≥30 days, or ≥90 days of either medication at any point over a 12-month period, fill within a 30-day time window), and study designs (e.g., none using a target emulated trial) (Hawkins et al., 2023, Gaither et al., 2016, Weisberg et al., 2015). Hawkins and colleagues (2023) identified an increase in all-cause mortality in the concomitant opioid and benzodiazepine pharmacotherapy group when compared to monotherapy (opioid pharmacotherapy alone; benzodiazepine pharmacotherapy alone), but no association was identified for death due to circulatory or respiratory causes. This suggests that factors not related to non-opioid pharmacotherapy are the cause of death and that these individuals have an increased risk of death due to factors not able to be extracted using diagnostic or procedure codes (Hawkins et al., 2023). While combined use may be appropriately prescribed in select scenarios (Boon et al., 2020, Gaither et al., 2016), this should be done with caution (FDA, 2016).
The committee’s findings should not be interpreted as clinical guidance on the combined use of opioid and benzodiazepine pharmacotherapy in veterans or those at risk for suicide. First, the statement of task did not specify a focus on veterans at risk for suicide and, thus, this was not the population studied. Second, individuals at risk
___________________
14 Public Law 113-146, Veterans Access, Choice and Accountability Act of 2014, 113th Congress, August 7, 2014.
for suicide may have an increased risk for an intentional overdose. Third, drug–drug interactions are well established, increasing the risk of respiratory depression in overdose situations (see previous discussion) when opioid pharmacotherapy is combined with benzodiazepine pharmacotherapy.
The committee evaluated the results based on several Bradford Hill criteria: biological plausibility, consistency of the association, time sequence, specificity, strength of the association, study design, quantitative strength, and dose response (Hill, 1965).
It is biologically plausible that opioid and benzodiazepine pharmacotherapy, either alone or together, can lead to the study outcomes through respiratory depression, which can cause hypoxia, hypercapnia cardiorespiratory arrest, and eventually death (Baldo, 2021; Forster et al., 1983). Further, the study design follows individuals from their start date or entry into the study, based on their treatment group, and observes them over 12 months or until the outcome of interest, all-cause mortality or suicide mortality, occurs.
The results are consistent with other studies, as mentioned above (Boon et al., 2020; Gaither et al., 2016; Weisberg et al., 2015). Specificity could not be assessed in this study, since the committee did not exhaustively assess all available pharmacological and non-pharmacological pain treatments, or all potential outcomes associated with pain pharmacotherapy (Fedak et al., 2015).
The strength of the association is based on quantitative strength, study design, and dose response. In study 1a (without current dispensed benzodiazepine pharmacotherapy), the adjusted HR for all-cause mortality was 1.61 (95% CI: 1.59–1.63) in those newly dispensed opioid pharmacotherapy, compared to those newly dispensed nonopioid pain pharmacotherapy. In Study 1b (with current dispensed benzodiazepine pharmacotherapy), the adjusted HR for all-cause mortality was 1.59 (95% CI: 1.53–1.65). As for the study design, the committee applied the TTE framework, reflecting current best practices in the causal inference methodology field when using observational data. The design reduced confounders and biases inherent in observational studies.
These findings are consistent with guidelines indicating avoidance of concurrent use of opioid and benzodiazepine pharmacotherapy (VA/DoD, 2022, 2017; Dowell et al., 2016; FDA, 2016). In addition, guidelines recommending against concurrent use are complemented by the decrease of co-prescribing in recent years—from 31.2 per 100 persons in 2017 to 25.8 per 100 persons in 2021.15 It is important to note that the committee’s interpretation of the results is not intended to influence restriction for any medication nor is not to be viewed as an absolute contraindication for the clinical use of benzodiazepines with opioids.
Strengths and Limitations
This study has important strengths. First, the committee used all VHA data available from 2007 to 2019, and Medicare and NDI data, incorporating as much information as possible for the analysis. Second, to enhance the validity of the inferences, the committee’s approach followed current best practices, including the use of a TTE framework, comparison of clinically realistic treatment strategies, avoidance of biases related to mishandling time zero, and rigorous adjustment for baseline and time-varying confounding. Other strengths including leveraging the VA dataset, spanning several years, to yield a sample of nearly 6 million individuals reflected in the analysis.
However, the findings should be interpreted with caution due to a few limitations. First, the study relied on health care clinical and administrative data, which may not capture the use of pain medications obtained illicitly outside health care settings. Additionally, pharmacy data were limited to prescriptions covered by the VHA and Medicare Part D, and thus the committee was not able to incorporate those covered by other sources (e.g., private, Medicaid, TRICARE, self-pay). In addition, there could be underreporting of medications, such as acetaminophen. The data does not include acetaminophen obtained via over the counter, and only reflect prescribed acetaminophen. Thus, under reporting may occur. Second, the committee did not require a chronic pain diagnosis as an inclusion criterion because it may be underdiagnosed and not reflected in EHR or be in the EHR but not identifiable as being chronically painful (e.g., osteoarthritis, low back pain, non-organized signs and symptoms). Third, the study faced challenges in fully capturing and identifying suicide mortality due to the specificity issues of certain ICD-10 suicide codes. Fourth, analyses were not able to incorporate veteran history of opioid pharmacotherapy exposure, especially
___________________
15 Dr. Christopher Jones, presentation to the committee on March 9, 2023. Trends in Opioid and Benzodiazepine Use, Misuse, and Overdose.
prescriptions prior to the episode of interest; before the washout period; during active duty, previous long-term care, or hospitalizations; or in the private sector (with the exception of Medicare Part D). The committee also did not have any information regarding previous use and failure of opioid and non-opioid pain pharmacotherapy, including a failure in providing adequate pain relief. Fifth, although the committee used a follow-up period of 12 months, it is unclear whether this was long enough. Sixth, the studies did not examine the potential indirect effects of substance use or naloxone administration. Seventh, given the statement of task, the committee did not assess non-pharmacologic treatments for pain (e.g., physical therapy, acupuncture, or chiropractic care), which are included VA benefits and have been increasing in utilization in recent years. There is growing evidence of the opioid sparing effects of some of these treatment approaches. Eighth, the committee examined covariate balance proximal to the index period; although covariate status 365 days prior the index period would be an interesting factor to explore, ICD diagnostic codes do not usually coincide with the incident date of the disease, potentially introducing a bias. The subgroup analysis did include adjustment based on surgical procedure; but resulted in no difference in the outcome between the two treatment groups. Finally, the findings may not be generalizable to civilians or veterans who receive care outside VHA. Additional details on study limitations can be found in Chapter 3.
FINDINGS
The committee was tasked with quantifying the effects of opioid and benzodiazepine pharmacotherapy prescribing on the risk of death among veterans who received care from the VHA between 2007–2019. Study 1 addresses the objectives outlined in parts (a) and (d) of the committee’s statement of task. Specifically, the study focused on (a) the effect of opioid prescribing for pain compared to alternative non-opioid pain treatments and (d) the effect of initiating opioids in individuals who are already taking benzodiazepines. These findings were consistent across both ITT and per protocol analyses and various subgroups. The committee cannot distinguish between the effect of opioid pharmacotherapy and the reason it was dispensed.
Finding 1a-1. Among veterans without current benzodiazepine pharmacotherapy, the 12-month risk of all-cause mortality was 10,273 deaths per 100,000 person-years for those newly dispensed opioid pharmacotherapy and 6,473 deaths per 100,000 person-years for those newly dispensed non-opioid pain pharmacotherapy (aHR16: 1.61; 95% CI: 1.59–1.63).
Finding 1a-2. Among veterans without current benzodiazepine pharmacotherapy, the 12-month risk for suicide mortality was 112 deaths per 100,000 person-years for those newly dispensed opioid pharmacotherapy and 95 deaths per 100,000 person-years for those newly dispensed non-opioid pain pharmacotherapy (aHR: 1.19; 95% CI: 1.07–1.32).
Finding 1b-1. Among veterans with current benzodiazepine pharmacotherapy, the 12-month risk for all-cause mortality was 11,877 deaths per 100,000 person-years for those newly dispensed opioid pharmacotherapy and 7,441 deaths per 100,000 person-years for those newly dispensed non-opioid pain pharmacotherapy (aHR: 1.59; 95% CI: 1.53–1.65).
Finding 1b-2. Among veterans with current benzodiazepine pharmacotherapy, the 12-month risk for suicide mortality was 246 deaths per 100,000 person-years for those newly dispensed opioid pharmacotherapy and 238 deaths per 100,000 person-years for those newly dispensed non-opioid pain pharmacotherapy, (aHR: 1.03; 95% CI: 0.81–1.31).
___________________
16 aHR: adjusted hazard ratio
CONCLUSIONS
The committee evaluated the effect of newly dispensed opioid pharmacotherapy without and with concurrent benzodiazepine pharmacotherapy on all-cause mortality and suicide mortality. The committee employed the TTE framework to reduce biases, such as due to immortal time, and confounding. In addition, the committee leveraged the large observational datasets (e.g., health care, clinical, and administrative data) available within the VA and VHA, supplemented by CMS data, and the NDI for mortality data. Based on the study findings, the committee makes the following conclusions for veterans who received care from the VHA between 2007–2019:
Conclusion 1. The committee concludes that there is an increased risk of all-cause mortality among veterans newly dispensed opioid pharmacotherapy compared to those newly dispensed non-opioid pain pharmacotherapy.
Conclusion 2. The committee concludes that there is an increased risk of all-cause mortality among veterans co-prescribed opioid and benzodiazepine pharmacotherapies compared to those co-prescribed non-opioid pain and benzodiazepine pharmacotherapies.
Conclusion 5. The committee concludes that there is an increased risk of suicide mortality among veterans newly dispensed opioid pharmacotherapy compared to those newly dispensed non-opioid pain pharmacotherapy.
Conclusion 6. The committee concludes there is no evidence of a difference in the risk of suicide mortality among veterans newly dispensed opioid pharmacotherapy and currently dispensed benzodiazepine pharmacotherapy compared to those newly dispensed non-opioid pain pharmacotherapy and currently dispensed benzodiazepine pharmacotherapy.
ANNEX: SUPPLEMENTARY FIGURES AND TABLES

NOTE: No cells are reported representing 10 or fewer veterans.

NOTES: No cells are reported representing 10 or fewer veterans. Only the 20 covariates with the greatest magnitude of change presented in figure
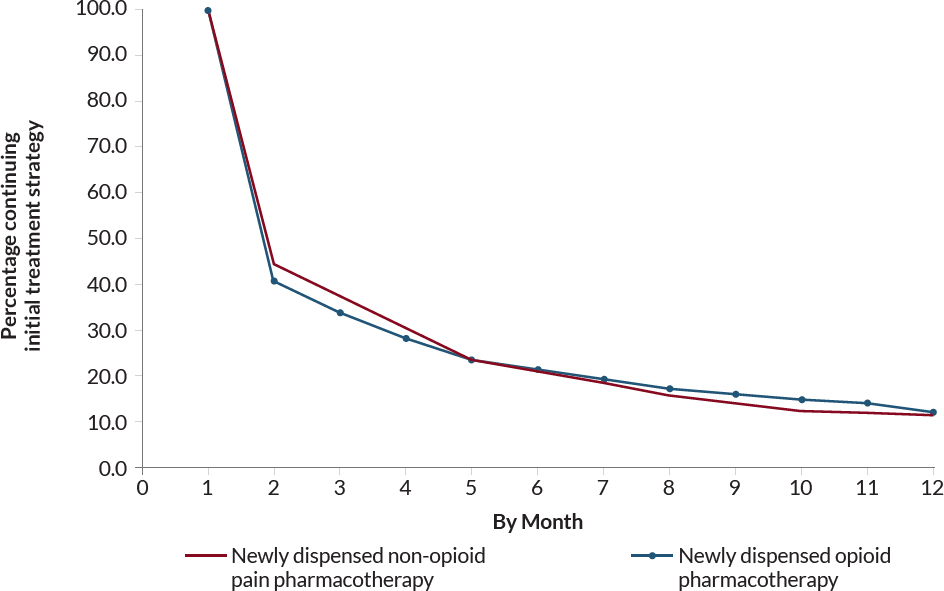
NOTE: No cells are reported representing 10 or fewer veterans.
| Covariate | Total (%) |
Newly Dispensed Opioid Pharmacotherapy (%) |
Newly Dispensed Non-Opioid Pain Pharmacotherapy (%) |
|---|---|---|---|
| Sex | 0.00 | 0.00 | 0.00 |
| Age | 0.00 | 0.00 | 0.00 |
| Race | 9.86 | 9.74 | 9.91 |
| Ethnicity | 6.03 | 5.95 | 6.06 |
| Marital Status | 5.23 | 5.29 | 5.20 |
| Disability Status | 0.31 | 0.31 | 0.31 |
| History of homelessness | 0.00 | 0.00 | 0.00 |
| Tobacco Use Ever | 0.00 | 0.00 | 0.00 |
| Health Conditions | |||
| Physical Health Conditions | |||
| Acute Pain Injury | 0.00 | 0.00 | 0.00 |
| AIDS/HIV | 0.00 | 0.00 | 0.00 |
| Blood Loss Anemia | 0.00 | 0.00 | 0.00 |
| Cancer (non-melanoma skin) | 0.00 | 0.00 | 0.00 |
| Cardiovascular Disease | 0.00 | 0.00 | 0.00 |
| Cerebrovascular Disease | 0.00 | 0.00 | 0.00 |
| Chronic Lung Disease | 0.00 | 0.00 | 0.00 |
| Cirrhosis | 0.00 | 0.00 | 0.00 |
| COPD1 | 0.00 | 0.00 | 0.00 |
| Deficiency Anemia | 0.00 | 0.00 | 0.00 |
| Dementia | 0.00 | 0.00 | 0.00 |
| Diabetes | 0.00 | 0.00 | 0.00 |
| End-Stage Renal Disease | 0.00 | 0.00 | 0.00 |
| Heart Disease | 0.00 | 0.00 | 0.00 |
| Hepatitis | 0.00 | 0.00 | 0.00 |
| Hemiplegia or Paraplegia | 0.00 | 0.00 | 0.00 |
| Liver Disease | 0.00 | 0.00 | 0.00 |
| Migraine | 0.00 | 0.00 | 0.00 |
| Peptic Ulcer Disease | 0.00 | 0.00 | 0.00 |
| Peripheral Vascular Disease | 0.00 | 0.00 | 0.00 |
| Pulmonary Circulation Disorders | 0.00 | 0.00 | 0.00 |
| Rheumatic Disease | 0.00 | 0.00 | 0.00 |
| Syncope | 0.00 | 0.00 | 0.00 |
| Sleep Disorders | |||
| Apnea | 0.00 | 0.00 | 0.00 |
| Insomnia | 0.00 | 0.00 | 0.00 |
| Covariate | Total (%) |
Newly Dispensed Opioid Pharmacotherapy (%) |
Newly Dispensed Non-Opioid Pain Pharmacotherapy (%) |
|---|---|---|---|
| Mental Health | |||
| ADHD2 | 0.00 | 0.00 | 0.00 |
| Alcohol Use Disorder | 0.00 | 0.00 | 0.00 |
| Anxiety | 0.00 | 0.00 | 0.00 |
| Bipolar Disorder | 0.00 | 0.00 | 0.00 |
| Depression | 0.00 | 0.00 | 0.00 |
| Drug Use Disorder | 0.00 | 0.00 | 0.00 |
| Opioid Use Disorder | 0.00 | 0.00 | 0.00 |
| Posttraumatic Stress Disorder | 0.00 | 0.00 | 0.00 |
| Schizophrenia and Psychosis | 0.00 | 0.00 | 0.00 |
| Suicidal Ideation | 0.00 | 0.00 | 0.00 |
| Traumatic Brain Injury | 0.00 | 0.00 | 0.00 |
| Overdose-Related Diagnoses | |||
| Opioid overdose | 0.00 | 0.00 | 0.00 |
| Current Pain Intensity Rating | 17.09 | 16.98 | 17.14 |
| Body Mass Index | 9.27 | 9.19 | 9.31 |
| Health Care Coverage | |||
| Supplemental Health Insurance to VHA3 Coverage | |||
| Medicare (ever/never) | 0.00 | 0.00 | 0.00 |
| Health Care Utilization in Past Year | |||
| Number of VA Outpatient Visits | 0.00 | 0.00 | 0.00 |
| Inpatient Hospital Admission | 0.00 | 0.00 | 0.00 |
| Inpatient Procedure | 0.00 | 0.00 | 0.00 |
| Inpatient Surgery | 0.00 | 0.00 | 0.00 |
| Outpatient Procedure | 0.00 | 0.00 | 0.00 |
| Nursing Home Visit | 0.00 | 0.00 | 0.00 |
| Military Status | |||
| Service Era | 1.72 | 1.70 | 1.73 |
| Combat Service | 13.48 | 13.20 | 13.59 |
| Military Sexual Trauma | 2.18 | 2.16 | 2.19 |
| Military Branch | 16.35 | 16.26 | 16.38 |
| Prescription Information (Yes/No) | |||
| Anticonvulsant | 0.00 | 0.00 | 0.00 |
| Antihistamine | 0.00 | 0.00 | 0.00 |
| Anxiolytic | 0.00 | 0.00 | 0.00 |
| Buprenorphine (for pain) | 0.00 | 0.00 | 0.00 |
| Migraine | 0.00 | 0.00 | 0.00 |
| Acetaminophen | 0.00 | 0.00 | 0.00 |
| Covariate | Total (%) |
Newly Dispensed Opioid Pharmacotherapy (%) |
Newly Dispensed Non-Opioid Pain Pharmacotherapy (%) |
|---|---|---|---|
| SNRI4 | 0.00 | 0.00 | 0.00 |
| TeCA5 | 0.00 | 0.00 | 0.00 |
| Facility Urbanicity | 13.67 | 13.86 | 13.58 |
1 COPD: Chronic obstructive pulmonary disease.
2 ADHD: Attention-deficit/hyperactivity disorder.
3 VHA: Veteran Health Affairs.
4 SNRI: Serotonin-norepinephrine reuptake inhibitor.
5 TeCA: Tetracyclic antidepressant.
NOTE: No cells are reported representing 10 or fewer veterans.

NOTE: No cells are reported representing 10 or fewer veterans.
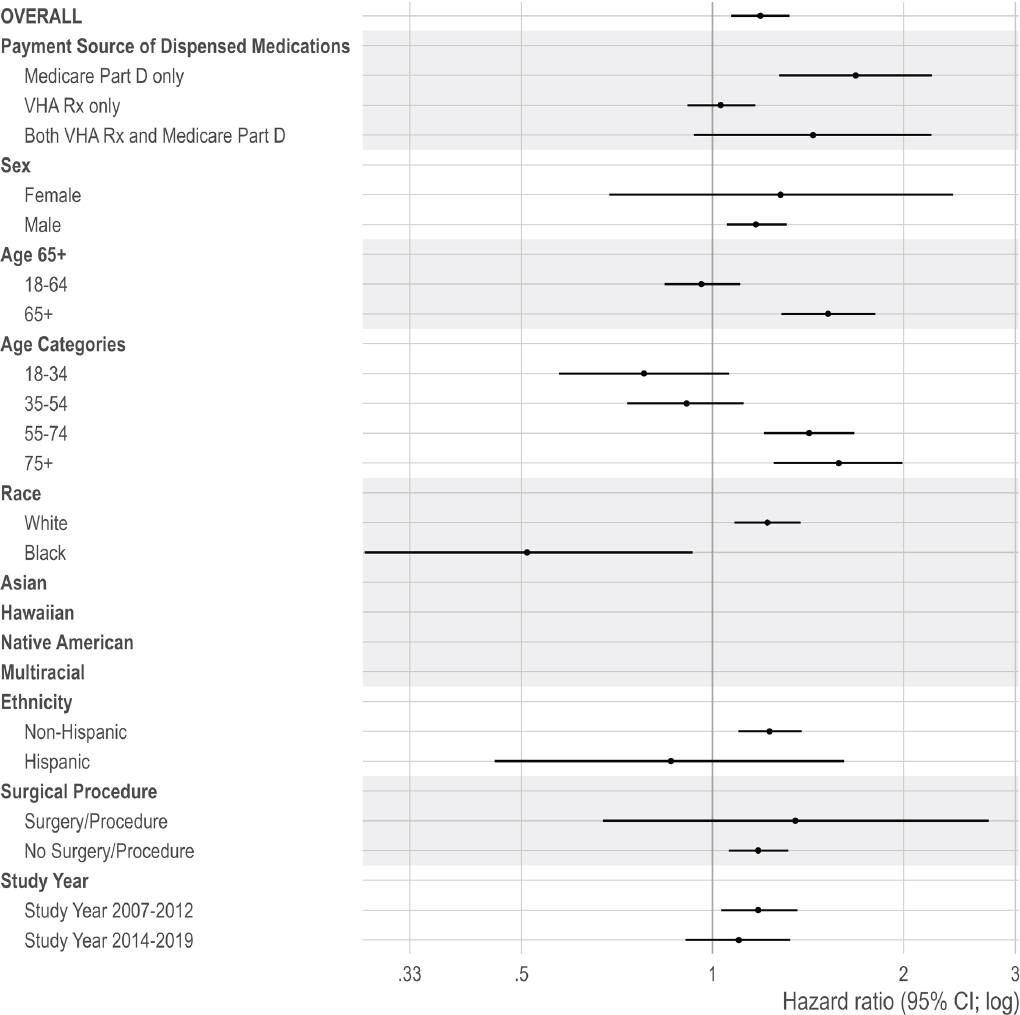
NOTE: No cells are reported representing 10 or fewer veterans.

NOTE: No cells are reported representing 10 or fewer veterans.
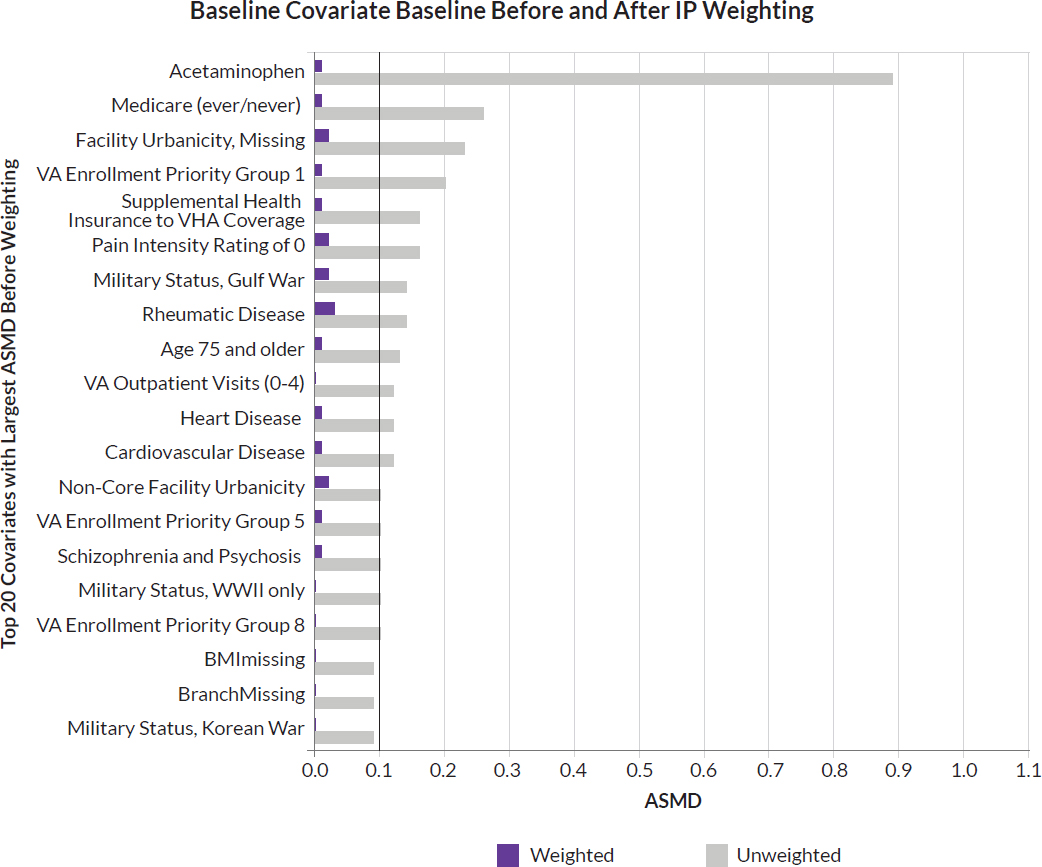
NOTES: No cells are reported representing 10 or fewer veterans. ASMD = absolute standardize mean difference; IP = inverse probability.
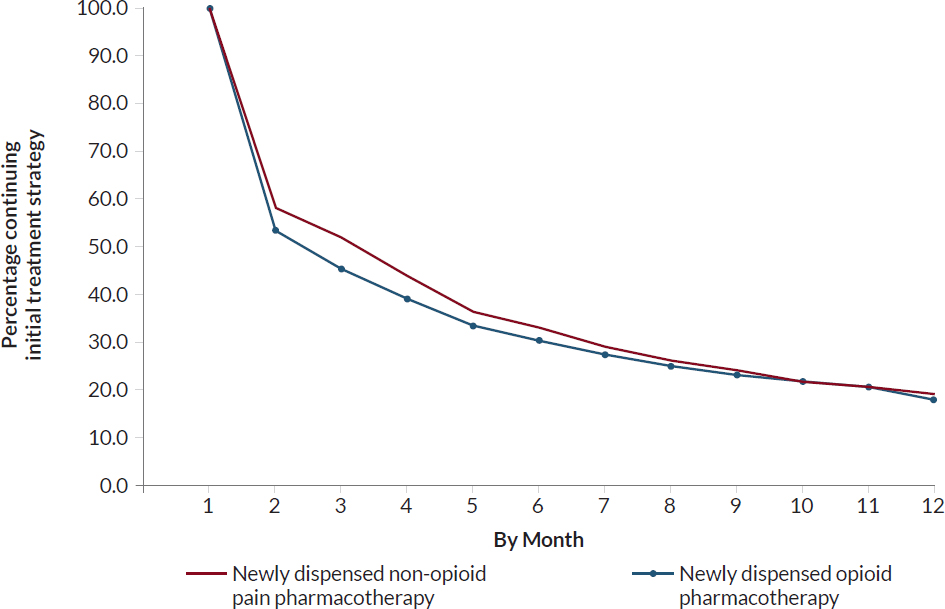
NOTES: Censored at veteran-month for first month of continuous 3 months of non-adherence, new cancer diagnosis, new palliative care/hospice ICD code in medical record. No cells are reported representing 10 or fewer veterans.
| Covariate | Total (%) |
Newly Dispensed Opioid Pharmacotherapy (%) |
Newly Dispensed Non-Opioid Pain Pharmacotherapy (%) |
|---|---|---|---|
| Sex | 0.00 | 0.00 | 0.00 |
| Age | 0.00 | 0.00 | 0.00 |
| Race | 9.97 | 9.97 | 9.98 |
| Ethnicity | 5.97 | 5.97 | 5.97 |
| Marital Status | 5.99 | 6.13 | 5.92 |
| Disability Status | 0.19 | 0.19 | 0.19 |
| History of homelessness | 0.00 | 0.00 | 0.00 |
| Tobacco Use Ever | 0.00 | 0.00 | 0.00 |
| Health Conditions | |||
| Physical Health Conditions | |||
| Acute Pain Injury | 0.00 | 0.00 | 0.00 |
| AIDS/HIV | 0.00 | 0.00 | 0.00 |
| Blood Loss Anemia | 0.00 | 0.00 | 0.00 |
| Cancer (non-melanoma skin) | 0.00 | 0.00 | 0.00 |
| Cardiovascular Disease | 0.00 | 0.00 | 0.00 |
| Cerebrovascular Disease | 0.00 | 0.00 | 0.00 |
| Chronic Lung Disease | 0.00 | 0.00 | 0.00 |
| Cirrhosis | 0.00 | 0.00 | 0.00 |
| COPD1 | 0.00 | 0.00 | 0.00 |
| Deficiency Anemia | 0.00 | 0.00 | 0.00 |
| Dementia | 0.00 | 0.00 | 0.00 |
| Diabetes | 0.00 | 0.00 | 0.00 |
| End-Stage Renal Disease | 0.00 | 0.00 | 0.00 |
| Heart Disease | 0.00 | 0.00 | 0.00 |
| Hepatitis | 0.00 | 0.00 | 0.00 |
| Hemiplegia or Paraplegia | 0.00 | 0.00 | 0.00 |
| Liver Disease | 0.00 | 0.00 | 0.00 |
| Migraine | 0.00 | 0.00 | 0.00 |
| Peptic Ulcer Disease | 0.00 | 0.00 | 0.00 |
| Peripheral Vascular Disease | 0.00 | 0.00 | 0.00 |
| Pulmonary Circulation Disorders | 0.00 | 0.00 | 0.00 |
| Rheumatic Disease | 0.00 | 0.00 | 0.00 |
| Syncope | 0.00 | 0.00 | 0.00 |
| Sleep Disorders | |||
| Apnea | 0.00 | 0.00 | 0.00 |
| Insomnia | 0.00 | 0.00 | 0.00 |
| Covariate | Total (%) |
Newly Dispensed Opioid Pharmacotherapy (%) |
Newly Dispensed Non-Opioid Pain Pharmacotherapy (%) |
|---|---|---|---|
| Mental Health | |||
| Attention-Deficit/Hyperactivity Disorder | 0.00 | 0.00 | 0.00 |
| Alcohol Use Disorder | 0.00 | 0.00 | 0.00 |
| Anxiety | 0.00 | 0.00 | 0.00 |
| Bipolar Disorder | 0.00 | 0.00 | 0.00 |
| Depression | 0.00 | 0.00 | 0.00 |
| Drug Use Disorder | 0.00 | 0.00 | 0.00 |
| Opioid Use Disorder | 0.00 | 0.00 | 0.00 |
| Posttraumatic Stress Disorder | 0.00 | 0.00 | 0.00 |
| Schizophrenia and Psychosis | 0.00 | 0.00 | 0.00 |
| Suicidal Ideation | 0.00 | 0.00 | 0.00 |
| Traumatic Brain Injury | 0.00 | 0.00 | 0.00 |
| Overdose-Related Diagnoses | |||
| Opioid overdose | 0.00 | 0.00 | 0.00 |
| Current Pain Intensity Rating | 18.67 | 18.64 | 18.68 |
| Body Mass Index | 8.27 | 8.24 | 8.29 |
| Health Care Coverage | |||
| Supplemental Health Insurance to VHA2 Coverage | |||
| Medicare (ever/never) | 0.00 | 0.00 | 0.00 |
| Health Care Utilization in Past Year | |||
| Number of VA Outpatient Visits | 0.00 | 0.00 | 0.00 |
| Inpatient Hospital Admission | 0.00 | 0.00 | 0.00 |
| Inpatient Procedure | 0.00 | 0.00 | 0.00 |
| Inpatient Surgery | 0.00 | 0.00 | 0.00 |
| Outpatient Procedure | 0.00 | 0.00 | 0.00 |
| Nursing Home Visit | 0.00 | 0.00 | 0.00 |
| Military Status | |||
| Service Era | 1.84 | 1.85 | 1.84 |
| Combat Service | 9.49 | 9.45 | 9.51 |
| Military Sexual Trauma | 2.03 | 2.06 | 2.02 |
| Military Branch | 16.86 | 16.84 | 16.88 |
| Prescription Information (Rx2 Taken) During Follow-Up, Yes/No) | |||
| Anticonvulsants | 0.00 | 0.00 | 0.00 |
| Antihistamine | 0.00 | 0.00 | 0.00 |
| Anxiolytic | 0.00 | 0.00 | 0.00 |
| Buprenorphine (for pain) | 0.00 | 0.00 | 0.00 |
| Migraine | 0.00 | 0.00 | 0.00 |
| Covariate | Total (%) |
Newly Dispensed Opioid Pharmacotherapy (%) |
Newly Dispensed Non-Opioid Pain Pharmacotherapy (%) |
|---|---|---|---|
| Acetaminophen | 0.00 | 0.00 | 0.00 |
| SNRI4 | 0.00 | 0.00 | 0.00 |
| TeCA5 | 0.00 | 0.00 | 0.00 |
| Facility Urbanicity | 19.29 | 19.70 | 19.07 |
1 COPD: Chronic obstructive pulmonary disease.
2 VHA: Veteran Health Affairs.
3 Rx: Prescription.
4 SNRI: Serotonin-norepinephrine reuptake inhibitor.
5 TeCA: Tetracyclic antidepressant.
NOTE: No cells are reported representing 10 or fewer veterans.
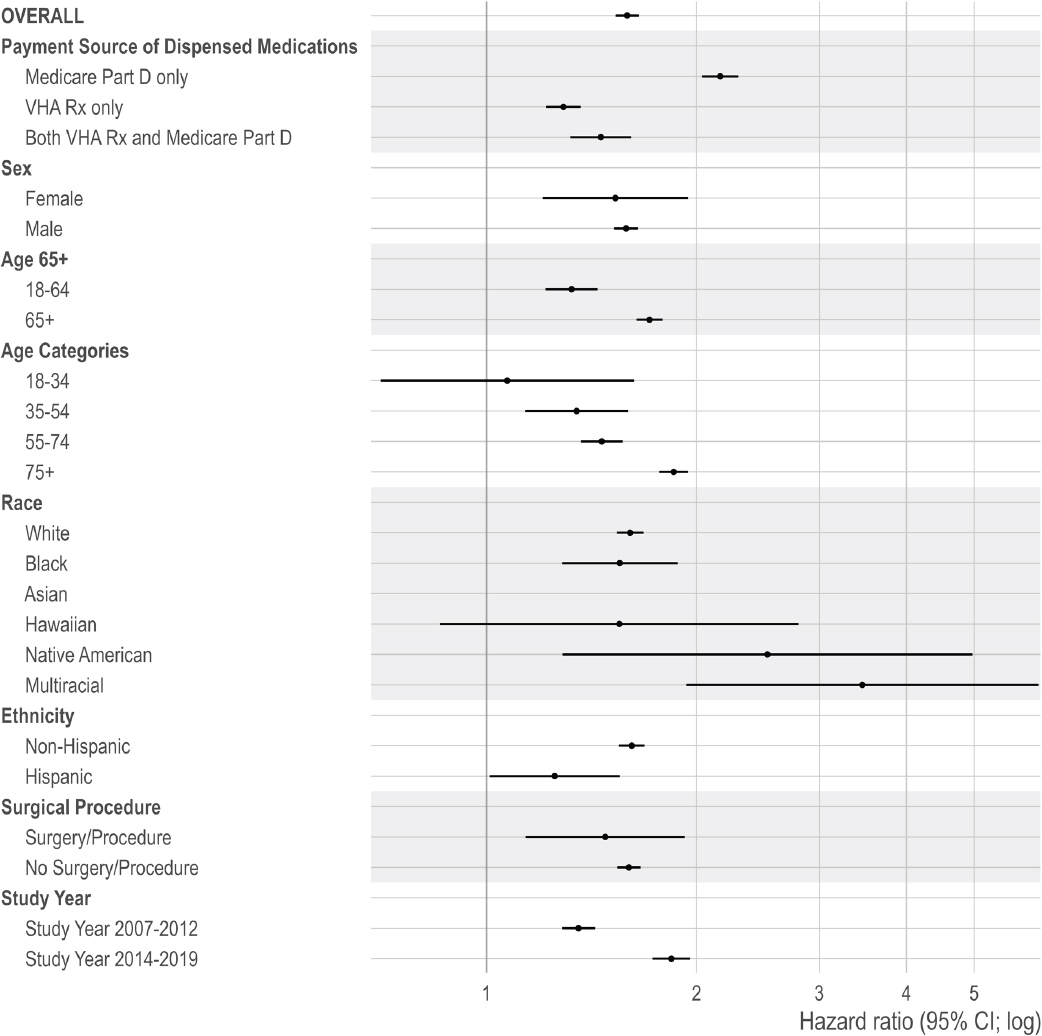
NOTE: No cells are reported representing 10 or fewer veterans.
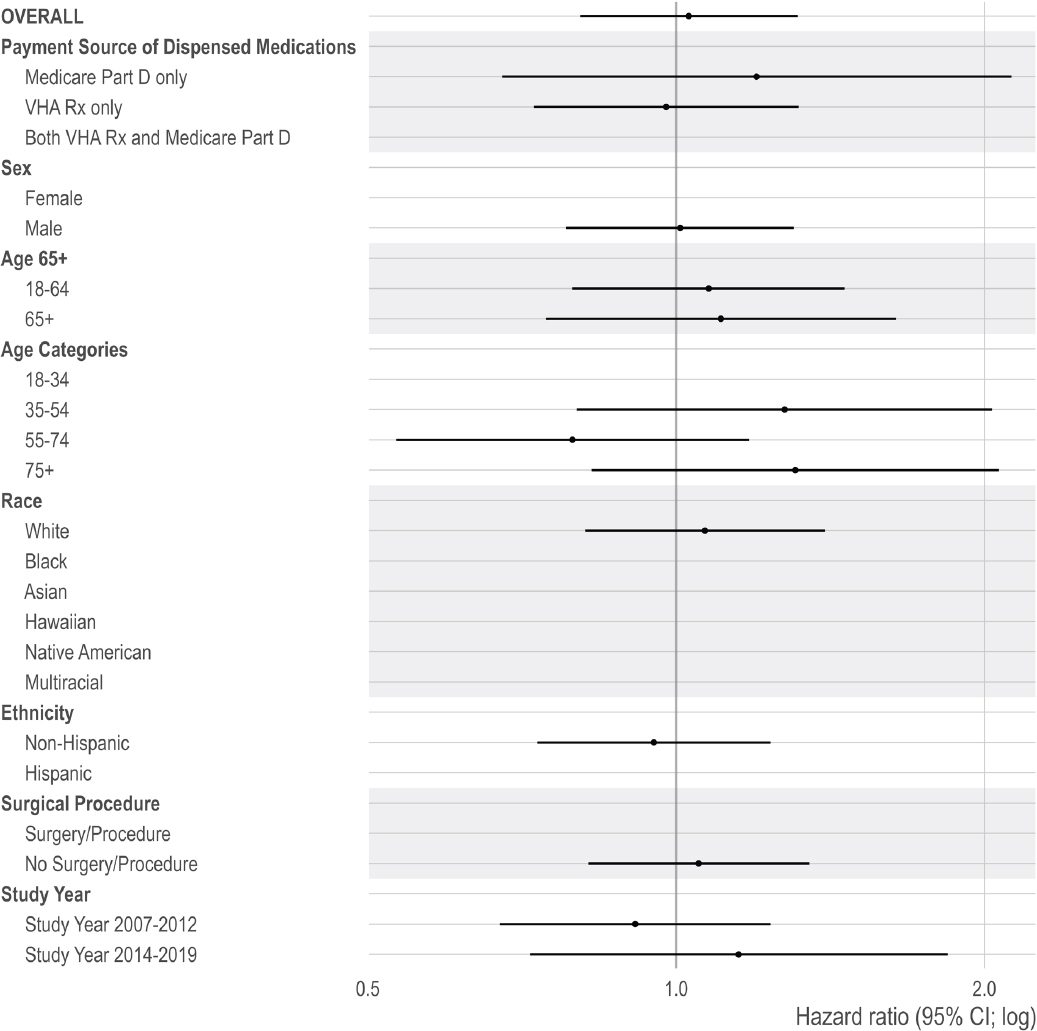
NOTE: No cells are reported representing 10 or fewer veterans.
REFERENCES
Austin, P. C. 2009. Balance diagnostics for comparing the distribution of baseline covariates between treatment groups in propensity-score matched samples. Statistics in Medicine 28(25):3083-3107.
Baldo, B. A. 2021. Toxicities of opioid analgesics: Respiratory depression, histamine release, hemodynamic changes, hypersensitivity, serotonin toxicity. Archives of Toxicology 95(8):2627-2642.
Becker, W. C., B. T. Fenton, C. A. Brandt, E. L. Doyle, J. Francis, J. L. Goulet, B. A. Moore, V. Torrise, R. D. Kerns, and P. W. Kreiner. 2017. Multiple sources of prescription payment and risky opioid therapy among veterans. Medical Care 55:S33-S36.
Berna, C., R. J. Kulich, and J. P. Rathmell. 2015. Tapering long-term opioid therapy in chronic noncancer pain: Evidence and recommendations for everyday practice. Mayo Clinic Proceedings 90(6):828-842.
Bohnert, A. S., and M. A. Ilgen. 2019. Understanding links among opioid use, overdose, and suicide. New England Journal of Medicine 380(1):71-79.
Bohnert, A. S. B., M. Valenstein, M. J. Bair, D. Ganoczy, J. F. McCarthy, M. A. Ilgen, and F. C. Blow. 2011. Association between opioid prescribing patterns and opioid overdose-related deaths. JAMA 305(13):1315-1321.
Boon, M., E. van Dorp, S. Broens, and F. Overdyk. 2020. Combining opioids and benzodiazepines: Effects on mortality and severe adverse respiratory events. Annals of Palliative Medicine 9(2):542-557.
Bossarte, R. M., K. L. Knox, R. Piegari, J. Altieri, J. Kemp, and I. R. Katz. 2012. Prevalence and characteristics of suicide ideation and attempts among active military and veteran participants in a national health survey. American Journal of Public Health 102 Suppl 1(Suppl 1):S38-S40.
Brack, A., H. L. Rittner, and C. Stein. 2011. Immunosuppressive effects of opioids—Clinical relevance. Journal of Neuroimmune Pharmacology 6:490-502.
Brummett, C. M., J. F. Waljee, J. Goesling, S. Moser, P. Lin, M. J. Englesbe, A. S. B. Bohnert, S. Kheterpal, and B. K. Nallamothu. 2017. New persistent opioid use after minor and major surgical procedures in US adults. JAMA Surgery 152(6):e170504.
Buttner, M. M., K. M. Godfrey, E. Floto, J. Pittman, L. Lindamer, and N. Afari. 2017. Combat exposure and pain in male and female Afghanistan and Iraq veterans: The role of mediators and moderators. Psychiatry Research 257:7-13.
CDC (Centers for Disease Control and Prevention). 2002. Instruction Manual: Part 9. Centers for Disease Control and Prevention/National Center for Health Statistics.
CDC. 2023. U.S. opioid dispensing rate maps. https://www.cdc.gov/overdose-prevention/data-research/facts-stats/opioiddispensing-rate-maps.html (accessed April 11, 2024).
Chou, R., R. Deyo, B. Devine, R. Hansen, S. Sullivan, J. G. Jarvik, I. Blazina, T. Dana, C. Bougatsos, and J. Turner. 2015. The effectiveness and risks of long-term opioid treatment of chronic pain. Evidence Report Technology Assessment (Full Report)(218):1-219.
Coyle, D. T., C. Y. Pratt, J. Ocran-Appiah, A. A.-O. Secora, C. Kornegay, and J. Staffa. 2018. Opioid analgesic dose and the risk of misuse, overdose, and death: A narrative review. Pharmacoepidemiology and Drug Safety (1099-1557 (Electronic)).
Deyo, R. A., S. E. Hallvik, C. Hildebran, M. Marino, E. Dexter, J. M. Irvine, N. O’Kane, J. Van Otterloo, D. A. Wright, and G. Leichtling. 2017. Association between initial opioid prescribing patterns and subsequent long-term use among opioid-naïve patients: A statewide retrospective cohort study. Journal of General Internal Medicine 32:21-27.
Dieujuste, N., R. Johnson-Koenke, M. Christopher, E. C. Gunzburger, T. Emmendorfer, C. Kessler, J. Haukoos, J. Smith, and C. Sasson. 2020. Feasibility study of a quasi-experimental regional opioid safety prescribing program in Veterans Health Administration emergency departments. Academic Emergency Medicine 27(8):734-741.
Dowell, D., T. M. Haegerich, and R. Chou. 2016. CDC guideline for prescribing opioids for chronic pain—United States, 2016. JAMA 315(15):1624-1645.
Dunn, K. M., K. W. Saunders, C. M. Rutter, C. J. Banta-Green, J. O. Merrill, M. D. Sullivan, C. M. Weisner, M. J. Silverberg, C. I. Campbell, B. M. Psaty, and M. Von Korff. 2010. Overdose and prescribed opioids: Associations among chronic non-cancer pain patients. Annals of Internal Medicine 152(2):85-92.
FDA (Food and Drug Administration). 2016. FDA warns about serious risks and death when combining opioid pain or cough medicines with benzodiazepines; Requires its strongest warning. https://www.fda.gov/drugs/drug-safety-and-availability/fda-drug-safety-communication-fda-warns-about-serious-risks-and-death-when-combining-opioid-pain-or (accessed September 20, 2024).
Fedak, K. M., A. Bernal, Z. A. Capshaw, and S. Gross. 2015. Applying the Bradford Hill Criteria in the 21st century: How data integration has changed causal inference in molecular epidemiology. Emerging Themes in Epidemiology 12:1-9.
Forster, A., D. Morel, M. Bachmann, and M. Gemperle. 1983. Respiratory depressant effects of different doses of midazolam and lack of reversal with naloxone—A double-blind randomized study. Anesthesia & Analgesia 62(10):920-924.
Frank, J. W., E. Carey, C. Nolan, R. D. Kerns, F. Sandbrink, R. Gallagher, and P. M. Ho. 2019. Increased nonopioid chronic pain treatment in the Veterans Health Administration, 2010-2016. Pain Medicine 20(5):869-877.
Gaither, J. R., J. L. Goulet, W. C. Becker, S. Crystal, E. J. Edelman, K. Gordon, R. D. Kerns, D. Rimland, M. Skanderson, A. C. Justice, and D. A. Fiellin. 2016. The association between receipt of guideline-concordant long-term opioid therapy and all-cause mortality. Journal of General Internal Medicine 31(5):492-501.
Gellad, W. F., J. M. Thorpe, X. Zhao, C. T. Thorpe, F. E. Sileanu, J. P. Cashy, J. A. Hale, M. K. Mor, T. R. Radomski, and L. R. Hausmann. 2018. Impact of dual use of Department of Veterans Affairs and Medicare Part D drug benefits on potentially unsafe opioid use. American Journal of Public Health 108(2):248-255.
Gibbons, R. D., K. Hur, and P. D. Quinn. 2021. Concomitant opioid and benzodiazepine use and risk of suicide attempt and intentional self-harm: Pharmacoepidemiologic study. Drug and Alcohol Dependence 228:109046.
Gressler, L. E., B. C. Martin, T. J. Hudson, and J. T. Painter. 2018. Relationship between concomitant benzodiazepine-opioid use and adverse outcomes among US veterans. Pain 159(3):451-459.
Golub, A., and A. S. Bennett. 2013. Prescription opioid initiation, correlates, and consequences among a sample of OEF/OIF military personnel. Substance Use & Misuse 48(10):811-820.
Gomes, T., M. M. Mamdani, I. A. Dhalla, J. M. Paterson, and D. N. Juurlink. 2011. Opioid dose and drug-related mortality in patients with nonmalignant pain. Archives of Internal Medicine 171(7):686-691.
Gomes, M., N. Latimer, M. Soares, S. Dias, G. Baio, N. Freemantle, D. Dawoud, A. Wailoo, and R. Grieve. 2022. Target trial emulation for transparent and robust estimation of treatment effects for health technology assessment using real-world data: Opportunities and challenges. Pharmacoeconomics 40(6):577-586.
Goulet, J. L., R. D. Kerns, M. Bair, W. C. Becker, P. Brennan, D. J. Burgess, C. M. Carroll, S. Dobscha, M. A. Driscoll, and B. T. Fenton. 2016. The musculoskeletal diagnosis cohort: Examining pain and pain care among veterans. Pain 157(8):1696-1703.
Hawkins, E. J., S. B. Goldberg, C. A. Malte, and A. J. Saxon. 2023. New coprescription of opioids and benzodiazepines and mortality among Veterans Affairs patients with posttraumatic stress disorder. Journal of Clinical Psychiatry 80(4).
Hernán, M. A., and J. M. Robins. 2016. Using big data to emulate a target trial when a randomized trial is not available. American Journal of Epidemiology 183(8):758-764.
Hernán, M. A., and J. M. Robins. 2017. Per-protocol analyses of pragmatic trials. The New England Journal of Medicine 377(14):1391-1398.
Hill, A. B. 1965. The Environment and Disease: Association or Causation? Sage Publication.
HHS (Department of Health and Human Services). 2020. CMS cell suppression policy. https://www.hhs.gov/guidance/document/cms-cell-suppression-policy (accessed December 26, 2024).
Hirsch, J., G. Nicola, G. McGinty, R. Liu, R. Barr, M. Chittle, and L. Manchikanti. 2016. ICD-10: History and context. American Journal of Neuroradiology 37(4):596-599.
Hoge, C. W., C. A. Castro, S. C. Messer, D. McGurk, D. I. Cotting, and R. L. Koffman. 2004. Combat duty in Iraq and Afghanistan, mental health problems, and barriers to care. New England Journal of Medicine 351(1):13-22.
Howard, J. T., I. J. Stewart, M. Amuan, J. C. Janak, and M. J. Pugh. 2022. Association of traumatic brain injury with mortality among military veterans serving after September 11, 2001. JAMA Network Open 5(2):e2148150-e2148150.
Jones, M. R., O. Viswanath, J. Peck, A. D. Kaye, J. S. Gill, and T. T. Simopoulos. 2018. A brief history of the opioid epidemic and strategies for pain medicine. Pain and Therapy 7:13-21.
Kelber, M. S., D. J. Smolenski, B. E. Belsher, K. O’Gallagher, F. Issa, L. T. Stewart, and D. P. Evatt. 2024. The associations of opioid and benzodiazepine prescriptions with injuries among US military service members. Pain 165(11):e139-e144.
Khansari, M., M. Sohrabi, and F. Zamani. 2013. The usage of opioids and their adverse effects in gastrointestinal practice: A review. Middle East Journal of Digestive Diseases 5(1):5.
Kyriacou, D. N. 2017. Opioid vs. nonopioid acute pain management in the emergency department. JAMA 318(17):1655-1656.
Larson, M. J., N. R. Wooten, R. S. Adams, and E. L. Merrick. 2012. Military combat deployments and substance use: Review and future directions. Journal of Social Work Practice and Addiction 12(1):6-27.
Leppert, W. 2012. The impact of opioid analgesics on the gastrointestinal tract function and the current management possibilities [Polish Version: Wpływ Opioidowych Środków Przeciwbólowych Na Czynność Układu Pokarmowego Oraz Aktualne Możliwości Postępowania Terapeutycznego P. 132]. Contemporary Oncology/Współczesna Onkologia 16(2):125-139.
Lund, J. L., D. B. Richardson, and T. Stürmer. 2015. The active comparator, new user study design in pharmacoepidemiology: Historical foundations and contemporary application. Current Epidemiology Reports 2:221-228.
Manchikanti, L., A. M. Kaye, N. N. Knezevic, H. McAnally, K. Slavin, A. M. Trescot, S. Blank, V. Pampati, S. Abdi, J. S. Grider, A. D. Kaye, K. N. Manchikanti, H. Cordner, C. G. Gharibo, M. E. Harned, S. L. Albers, S. Atluri, S. M. Aydin, S. Bakshi, R. L. Barkin, R. M. Benyamin, M. V. Boswell, R. M. Buenaventura, A. K. Calodney, D. L. Cedeno, S. Datta, T. R. Deer, B. Fellows, V. Galan, V. Grami, H. Hansen, S. Helm Ii, R. Justiz, D. Koyyalagunta, Y. Malla, A. Navani, K. H. Nouri, R. Pasupuleti, N. Sehgal, S. M. Silverman, T. T. Simopoulos, V. Singh, D. R. Solanki, P. S. Staats, R. Vallejo, B. W. Wargo, A. Watanabe, and J. A. Hirsch. 2017. Responsible, safe, and effective prescription of opioids for chronic non-cancer pain: American Society of Interventional Pain Physicians (ASIPP) Guidelines. Pain Physician 20(2S):S3-S92.
Moore, M. J., E. Shawler, C. H. Jordan, and C. A. Jackson. 2023. Veteran and military mental health issues. StatPearls. Treasure Island (FL): StatPearls Publishing. https://www.ncbi.nlm.nih.gov/sites/books/NBK572092/ (accessed December 26, 2024).
NASEM (National Academies of Sciences, Engineering, and Medicine). 2013. Returning home from Iraq and Afghanistan: Assessment of readjustment needs of veterans, service members, and their families. Washington, DC: National Academies Press.
NASEM. 2018. Evaluation of the Department of Veterans Affairs Mental Health Services. Washington, DC: National Academies Press.
NCHS (National Center for Health Statistics). 2023. Underlying cause of death 1999-2020. https://wonder.cdc.gov/wonder/help/ucd.html#Source (accessed August 24, 2024).
Park, T. W., R. Saitz, D. Ganoczy, M. A. Ilgen, and A. S. Bohnert. 2015. Benzodiazepine prescribing patterns and deaths from drug overdose among US veterans receiving opioid analgesics: Case-cohort study. BMJ 350:h2698.
Pergolizzi Jr, J. V., R. Taylor Jr, J. A. LeQuang, and R. B. Raffa. 2018. Managing severe pain and abuse potential: The potential impact of a new abuse-deterrent formulation oxycodone/naltrexone extended-release product. Journal of Pain Research:301-311.
Ray, W. A. 2003. Evaluating medication effects outside of clinical trials: New-user designs. American Journal of Epidemiology 158(9):915-920.
Ray, W. A., C. P. Chung, K. T. Murray, K. Hall, and C. M. Stein. 2016. Prescription of long-acting opioids and mortality in patients with chronic noncancer pain. JAMA 315(22):2415-2423.
Robins, J. 1986. A new approach to causal inference in mortality studies with a sustained exposure period—Application to control of the healthy worker survivor effect. Mathematical Modelling 7(9-12):1393-1512.
Robins, J. M., M. A. Hernán, and B. Brumback. 2000. Marginal structural models and causal inference in epidemiology. Epidemiology 11(5):550-560.
Rosenblum, A., L. A. Marsch, H. Joseph, and R. K. Portenoy. 2008. Opioids and the treatment of chronic pain: Controversies, current status, and future directions. Experimental and Clinical Psychopharmacology 16(5):405-416.
Sandbrink, F., J. L. Murphy, M. Johansson, J. L. Olson, E. Edens, J. Clinton-Lont, J. Sall, C. Spevak, and VA/DoD Guideline Development Group. 2023. The use of opioids in the management of chronic pain: Synopsis of the 2022 updated U.S. Department of Veterans Affairs and U.S. Department of Defense Clinical Practice Guideline. Annals of Internal Medicine 176(3):388-397.
Schneeweiss, S., J. A. Rassen, J. S. Brown, K. J. Rothman, L. Happe, P. Arlett, G. Dal Pan, W. Goettsch, W. Murk, and S. V. Wang. 2019. Graphical depiction of longitudinal study designs in health care databases. Annals of Internal Medicine 170(6):398-406.
Scully, R. E., A. J. Schoenfeld, W. Jiang, S. Lipsitz, M. A. Chaudhary, P. A. Learn, T. Koehlmoos, A. H. Haider, and L. L. Nguyen. 2018. Defining optimal length of opioid pain medication prescription after common surgical procedures. JAMA Surgery 153(1):37-43.
Shah, A., C. J. Hayes, and B. C. Martin. 2017. Characteristics of initial prescription episodes and likelihood of long-term opioid use—United States, 2006–2015. Morbidity and Mortality Weekly Report 66.
Song, I.-A., H.-R. Choi, and T. K. Oh. 2022. Long-term opioid use and mortality in patients with chronic non-cancer pain: Ten-year follow-up study in South Korea from 2010 through 2019. EClinicalMedicine 51.
Suda, K. J., T. L. Boyer, J. R. Blosnich, J. P. Cashy, C. C. Hubbard, and L. K. Sharp. 2023. Opioid and high-risk prescribing among racial and ethnic minority veterans. American Journal of Preventive Medicine 65(5):863-875.
Sun, E. C., A. Dixit, K. Humphreys, B. D. Darnall, L. C. Baker, and S. Mackey. 2017. Association between concurrent use of prescription opioids and benzodiazepines and overdose: Retrospective analysis. BMJ 356:j760.
Sung, M. L., S. K. Eden, W. C. Becker, S. Crystal, M. S. Duncan, K. S. Gordon, R. D. Kerns, S. Kundu, M. Freiberg, and K. A. So-Armah. 2024. The association of prescribed opioids and incident cardiovascular disease. The Journal of Pain 25(5):104436.
Turner, B. J., and Y. Liang. 2015. Drug overdose in a retrospective cohort with non-cancer pain treated with opioids, antidepressants, and/or sedative-hypnotics: Interactions with mental health disorders. Journal of General Internal Medicine 30:1081-1096.
VA (Department of Veterans Affairs). 2018. National strategy for preventing veteran suicide 2018–2028. U.S. Department of Veterans Affairs.
VA. 2022. Use of benzodiazepines for PTSD in Veterans Affairs. https://www.ptsd.va.gov/professional/treat/txessentials/benzos_va.asp (accessed May 16, 2024).
VA/DoD (Department of Defense). 2003. VA/DoD clinical practice guideline for the management of opioid therapy for chronic pain. Washington, DC.
VA/DoD. 2010. VA/DoD clinical practice guideline: Management of opioid therapy for chronic pain. Washington, DC.
VA/DoD. 2017. VA/DoD clinical practice guidelines for opioid therapy for chronic pain. Washington, DC.
VA/DoD. 2022. VA/DoD clinical practice guideline for the use of opioids in the management of chronic pain. Washington, DC.
Veterans Health Administration. 2006. Outpatient pharmacy services- VHA Handbook 1108.05. https://www.vendorportal.ecms.va.gov/FBODocumentServer/DocumentServer.aspx?DocumentId=1508282&FileName=VA246-14-Q-0798-008.pdf (accessed August 12, 2024)
Weisberg, D. F., K. S. Gordon, D. T. Barry, W. C. Becker, S. Crystal, E. J. Edelman, J. Gaither, A. J. Gordon, J. Goulet, R. D. Kerns, B. A. Moore, J. Tate, A. C. Justice, and D. A. Fiellin. 2015. Long-term prescription of opioids and/or benzodiazepines and mortality among HIV-infected and uninfected patients. Journal of Acquired Immune Deficiency Syndrome 69(2):223-233.
Xu, S., C. Ross, M. A. Raebel, S. Shetterly, C. Blanchette, and D. Smith. 2010. Use of stabilized inverse propensity scores as weights to directly estimate relative risk and its confidence intervals. Value in Health 13(2):273-277.
Xu, K. Y., S. M. Hartz, J. T. Borodovsky, L. J. Bierut, and R. A. Grucza. 2020. Association between benzodiazepine use with or without opioid use and all-cause mortality in the United States, 1999-2015. JAMA Network Open 3(12):e2028557-e2028557
Yang, Y., S. Liu, M. Ling, and C. Ye. 2022. Prevalence and potential risk factors for occupational low back pain among male military pilots: A study based on questionnaire and physical function assessment. Frontiers in Public Health 9:744601.


