The Comprehensive Autism Care Demonstration: Solutions for Military Families (2025)
Chapter: 6 Characteristics of ACD Participants
6
Characteristics of ACD Participants
Since the initiation of the Comprehensive Autism Care Demonstration (ACD), the Defense Health Agency (DHA) of the Department of Defense (DoD) has tracked the number of ACD participants from fiscal year to fiscal year. See Figure 6-1 for trends in ACD participants and costs per participant from FY 2015 to FY 2022. Annual reports to Congress summarize total program costs, average cost per participant, and the number of ACD participants, distinguishing between active-duty family members (ADFMs) and non-active-duty family members (NADFMs; DoD, 2019a, 2024b). Total costs for applied behavior analysis (ABA) services through the ACD have ranged from $161.5 million (FY 2015) to $454.4 million (FY 2021). The reports to Congress also capture total expenditures among ACD participants for other TRICARE medical services common for autistic individuals including physical, speech, and occupational therapies as well as prescription medications. In the most recent report to Congress (DoD, 2024b), services provided under the TRICARE Extended Care Health Option program are also reflected.
The reports to Congress consider what percentage of beneficiaries diagnosed with autism utilize the ACD (this has ranged from 52% to 57% for ADFMs and from 23% to 29% for NADFMs from FY 2015 to FY 2021). The age distribution of ACD participants has been generally consistent from year to year, with nearly 99% younger than age 21. For the most recent report, the median participant age is reported as 7 years, the average age is 8.0 years, and the most common age of participants is 5 years. Roughly four out of five participating beneficiaries are male (DoD, 2024b).
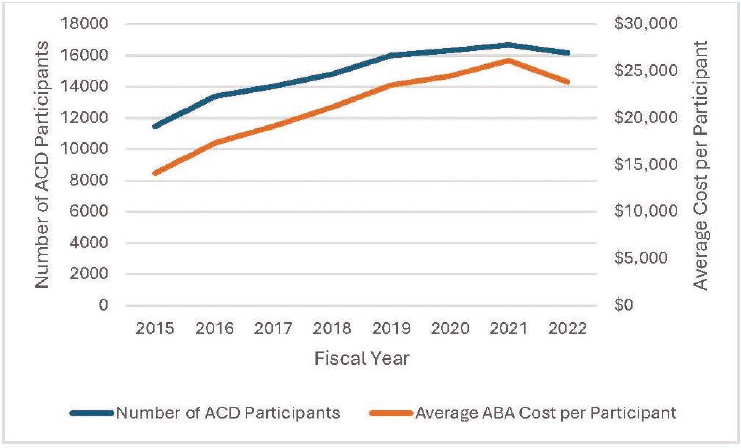
NOTE: Adjusted for inflation, the $15,000 spent in 2015 has the same buying power as $18,795 in 2022.
SOURCE: Generated by committee with data from DoD 2019a, 2024b.
The reports have tracked the increase in certified ABA providers as submitted by the Managed Care Support Contractors. In 2015, there were 6,887 TRICARE-authorized ABA supervisors across all TRICARE regions, and there were 523 assistants and 19,421 behavior technicians supporting authorized ABA supervisors (DoD, 2016). In 2021, there were 20,064 TRICARE-authorized ABA supervisors across East and West TRICARE regions, and there were 1,433 assistants and 61,554 behavior technicians supporting authorized ABA supervisors (DoD, 2023c).
The remainder of this chapter presents findings on ACD participants from the committee’s own analyses of data requested through DHA on ACD participants and relevant claims information processed through TRICARE. The committee was tasked with conducting its own data analyses, using data similar to those used by DHA in its reports to Congress, to address questions in its charge (see Chapter 1, Box 1-3). The committee engaged a subcontractor, Westat, to carry out the data analyses. Per contractual requirements and approval by the National Academies’ Institutional Review Board (IRB), the committee did not have access to the protected data provided by DoD and relied on Westat’s analytic summaries for its deliberations and report. See Appendix D for additional information on analytical methods, assumptions, and data limitations.
DESCRIPTION OF DATA REQUEST
The data requested through DHA from the Military Health System Data Repository included patient-level encounter data, claims data, and ACD records data from calendar years 2018 through 2023 for individuals aged 1 to 18 years old with autism. This time period was deemed sufficient to make comparisons of ACD participants and non-participants and reflected periods before and after the 2021 policy changes. For the data request, autism was defined by an F84.0 International Classification of Diseases (ICD)-10 code between 2018 and 2023 in the patient record. Administrative data from claims and electronic health records (EHRs) included approximately 300 fields selected from seven DHA and DoD datasets. The seven datasets requested included the following:
- Comprehensive Ambulatory/Provider Encounter Record (CAPER);
- TRICARE Encounter Data–Institutional (TED-I);
- TRICARE Encounter Data–Non-Institutional (TED-NI);
- Standard Inpatient Data Record (SIDR);
- GENESIS, an EHR system with admission and demographic records;
- Pharmacy Data Transaction Service (PDTS); and
- Defense Enrollment Eligibility Reporting System (DEERS).
Combined, these datasets include all ambulatory and inpatient encounters, health services from the private sector, and medication and demographic information for TRICARE beneficiaries aged 1 to 18 over the study period. Important data elements in these tables include ICD-10 codes identifying autism and other relevant co-occurring health conditions and procedure codes identifying ABA and other relevant healthcare services. DEERS data include records for demographic variables, such as birth date, race/ethnicity, sex, sponsor rank, and residence ZIP code.
ACD data include assessment scores for participants. Composite and available subdomain scores from the Pervasive Developmental Disorder Behavior Inventory (PDDBI); the Vineland Adaptive Behavior Scales, Third Edition (Vineland-3); Social Response Score (SRS); and Parenting Stress Index–Short Form (PSI-SF) were provided to establish multiple assessment points (see Chapter 3, Box 3-2). Required assessment and reporting policies for the ACD as well as engagement of participating families changed during the period of interest. This affected the availability of assessment and subdomain scales over the study period. According to the TRICARE operations manual, these assessments are to be completed and submitted periodically by ABA providers, and the results are to be incorporated into participants’ treatment plans by ABA providers and the comprehensive care
plans by Autism Services Navigators and serve to evaluate “progress toward improved symptom presentation” (DHA, 2023a, section 9.1.2.2). Limitations of the data available from these assessment tools are discussed below.
Per the data sharing agreement, DHA created a limited dataset for Westat analyses. DHA removed medical record numbers, addresses, social security numbers, and other specific identifiers before transferring data to Westat. DHA constructed a new identifier for Westat to link patients across datasets.
It is worth noting that the process to acquire the data was lengthy, and as such, the time available for analyses was very limited (see timeline in Chapter 1). Acquiring data for this study required multiple conversations with DHA to understand the nature of the data available to the committee and to determine the appropriate ask for data fields among several databases necessary to address the questions in the committee’s charge. Once the data ask and initial plan of investigation were determined, IRB approval was acquired through the National Academies and the request and plan with data safeguards were sent through DHA privacy office. After the data sharing agreement was finalized, DHA data subcontractor went to work preparing the requested data from its databases, de-identifying the data and preparing linking codes, and collapsing ZIP codes and other small cell information to avoid personal identification. When the datasets were ready, another layer of review was required before the data could be released. Westat received the data via DoD SAFE on January 22, 2025.
At this stage of the study, the committee prioritized analyses that would inform the utilization of the ACD, including comparisons between ACD participants compared to autistic individuals who did not receive ABA services.
ANALYTIC APPROACH
Given limitations with the data and time available to conduct the analyses, the committee undertook analyses aimed at understanding similarities and differences between autistic individuals who participated in the ACD and those who did not. Participants in the ACD program were further divided into continuous participants (those who received greater than six months of continuous ABA treatment) and intermittent users (all other participants with receipt of some ABA treatment). Analyses compared demographics, clinical characteristics, as well as the amount of ABA received across groups. See additional information on the methodology and analytic approach in Appendix D.
Descriptive Analysis of ACD Participation
The committee requested data on children ages 1–18 years old with an autism diagnosis who were eligible for TRICARE benefits over a six-year
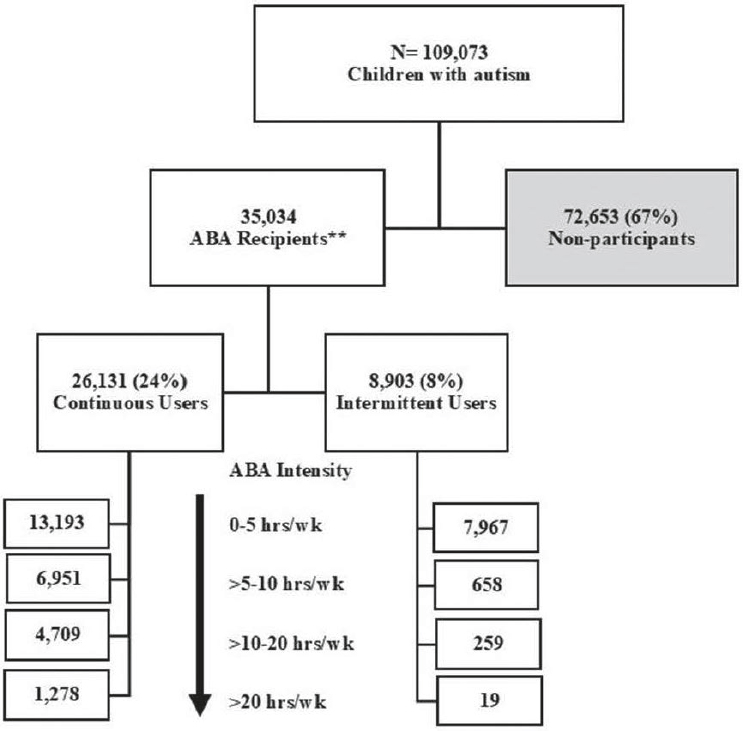
NOTE: ** ABA recipients excludes 3,922 individuals with ACD flag but no ABA this period and includes 2,536 individuals with no ACD flag but who received ABA.
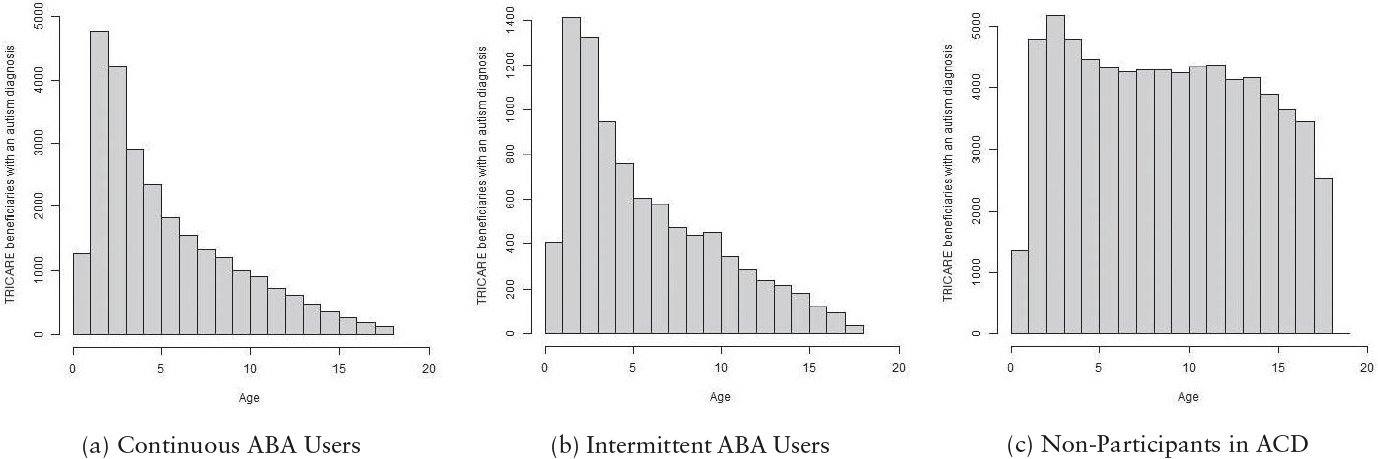
period from calendar years 2018 to 2023. There were 109,073 unique individuals in the sample. Figure 6-2 shows a breakdown of this sample into continuous and intermittent users of ABA and non-participants in the ACD. The larger non-participant group contained more individuals across the age range, whereas the ABA user groups were predominantly younger children. See Figure 6-3 for a breakdown of ages within these subgroups.
- Continuous participants were defined as beneficiaries with an F84.0 ICD-10 code in their medical records and at least one ABA claim per month for at least six consecutive months between January 1, 2018, and December 31, 2023.
- Intermittent participants were defined as beneficiaries with an F84.0 ICD-10 code in their medical records and at least one ABA claim between January 1, 2018, and December 31, 2023. The intermittent participants infrequently reached six consecutive months of ABA therapy.
- Non-participants were defined as beneficiaries with an F84.0 ICD-10 code but with no ABA-related claims in their medical history during this this time frame.
Within each of the continuous and intermittent ACD groups, ABA intensity for each participant was calculated as the sum of ABA hours for six months divided by the weeks in the ACD during the six months. All participants were anchored from their first ABA claim. Hours of ABA were calculated using the number of Current Procedural Terminology (CPT) codes billed and the time associated with them (in minutes). All available CPT codes for treatment (including family guidance) were summed. Category III codes in 2018 were recorded in 30-minute increments. Category I codes, used from 2019 to 2023, were recorded in 15-minute increments (see Chapter 4, Box 4-2 for description of Category I CPT codes for treatment).1
The committee examined several demographic characteristics among participant groups, including age, sex, ethnicity, race, sponsor rank, branch and component, residence region and urbanicity, and whether individuals appeared to move during the study period. We examined these characteristics by age groups as well as by participation or non-participation in the ACD (as well as by amount of ABA for participants). Since there were a lot of missing or indeterminate data (see Appendix D), only noteworthy findings are shared here.
Across age groups and participant status, the sample of autistic children consisted of approximately one-quarter females and three-quarters males (26% vs. 74% for total sample), and approximately three-fifths lived in the eastern region of the United States and one-third in the western region (59% vs. 31% for the total sample of autistic individuals). The remainder were overseas or unknown.
In our sample, there were 62,368 (58%) individuals from ADFMs and 43,602 (41%) individuals from NADFMs. ACD participants were primarily from ADFMs; 41% of ADFM beneficiaries used ABA services and 20% of NADFM beneficiaries used ABA services in the 2018–2023 time period. There were noticeable shifts in the ratio of individuals from ADFMs to those from NADFMs compared across age groups and participant status (see Figure 6-4).
___________________
1Category I treatment codes billed through the ACD included 97153, 97155, 97156, 97157, and 97158. Category III treatment codes billed through the ACD included 0364T, 0365T, 0366T, 0367T, 0368T, 0369T, 0370T, 0371T, and 0372T.

Among military-connected children ages 1–18 years old with an autism diagnosis in the period 2018–2023, the committee found that 35,034 (32%) of these children had a claim for ABA services, but only 26,131 (24%) received ABA continuously for at least six months. More than half (58%) were under age six and a majority (89%) of ABA recipients were under age 12. The committee identified subsets of regular or continuous ABA recipients (75%) and intermittent ABA recipients (25%). The committee observed that continuous recipients tended to be younger children, to have more co-occurring conditions like delayed milestones, and to have greater utilization of other services in addition to ABA. Notably, however, mental health issues were more common among those not receiving ABA, particularly for older children. This trend was seen among school age children as well. Comparisons for the total sample and for the youngest (0 to 2 years old) and oldest (12 to 18 years old) are shown here (see Table 6-1,
TABLE 6-1 Clinical Characteristics for Total Sample by Participation Groups
| Continuous Users | Intermittent Users | Non-participants | p | |
|---|---|---|---|---|
| N | 26,131 | 8,903 | 72,653 | |
| Other Services | n (%) | n (%) | n (%) | p |
| Dietitian | 12,751 (48.8) | 3,925 (44.1) | 24,747 (34.1) | <0.001 |
| Speech | 19,245 (73.6) | 5,760 (64.7) | 28,280 (38.9) | <0.001 |
| PT/OT | 17,637 (67.5) | 5,180 (58.2) | 28,147 (38.7) | <0.001 |
| ENT/Audiology | 6,830 (26.1) | 2,280 (25.6) | 12,178 (16.8) | <0.001 |
| OT Feeding Difficulties | 7,342 (28.1) | 2,057 (23.1) | 9,037 (12.4) | <0.001 |
| Other Conditions | n (%) | n (%) | n (%) | p |
| ADHD | 12,191 (46.7) | 3,952 (44.4) | 38,658 (53.2) | <0.001 |
| Sleep Disorder | 7,472 (28.6) | 2,251 (25.3) | 16,320 (22.5) | <0.001 |
| Genetic Disorder | 1,879 (7.2) | 457 (5.1) | 2,747 (3.8) | <0.001 |
| Delayed Milestone | 13,443 (51.4) | 3,864 (43.4) | 16,446 (22.6) | <0.001 |
| Epilepsy | 2,224 (8.5) | 549 (6.2) | 4,413 (6.1) | <0.001 |
| Intellectual Disability | 2,375 (9.1) | 506 (5.7) | 3,859 (5.3) | <0.001 |
| Depression | 2,199 (8.4) | 1,040 (11.7) | 16,058 (22.1) | <0.001 |
| Anxiety | 6,959 (26.6) | 2,337 (26.2) | 28,581 (39.3) | <0.001 |
| OCD | 1,048 (4.0) | 316 (3.5) | 3,987 (5.5) | <0.001 |
| Other Mental Health | 7,331 (28.1) | 2,559 (28.7) | 26,086 (35.9) | <0.001 |
NOTES: ADHD = attention-deficit/hyperactivity disorder; ENT = ear, nose, and throat; OCD = obsessive-compulsive disorder; OT = occupational therapy; PT = physical therapy.
TABLE 6-2 Clinical Characteristics for Ages 0 to 2 Years Old
| Continuous Users | Intermittent Users | Non-participants | p | |
|---|---|---|---|---|
| N | 6,060 | 1,818 | 6,149 | |
| Other Services | n (%) | n (%) | n (%) | p |
| Dietitian | 1,336 (22.0) | 318 (17.5) | 1,225 (19.9) | <0.001 |
| Speech | 3,663 (60.4) | 945 (52.0) | 3,485 (56.7) | <0.001 |
| PT/OT | 1,264 (20.9) | 301 (16.6) | 1,155 (18.8) | <0.001 |
| ENT/Audiology | 534 (8.8) | 118 (6.5) | 725 (11.8) | <0.001 |
| OT Feeding Difficulties | 909 (15.0) | 228 (12.5) | 847 (13.8) | 0.017 |
| Other Conditions | n (%) | n (%) | n (%) | p |
| ADHD | 120 (2.0) | 47 (2.6) | 162 (2.6) | 0.044 |
| Sleep Disorder | 482 (8.0) | 117 (6.4) | 436 (7.1) | 0.049 |
| Genetic Disorder | 163 (2.7) | 42 (2.3) | 164 (2.7) | 0.656 |
| Delayed Milestone | 2,269 (37.4) | 467 (25.7) | 1,957 (31.8) | <0.001 |
| Epilepsy | 145 (2.4) | 35 (1.9) | 155 (2.5) | 0.344 |
| Intellectual Disability | 28 (0.5) | <10 | 21 (0.3) | 0.166 |
| Depression | <10 | <10 | <10 | 0.371 |
| Anxiety | 50 (0.8) | <10 | 63 (1.0) | 0.138 |
| OCD | <10 | 0 (0.0) | <10 | 0.196 |
| Other Mental Health | 177 (2.9) | 50 (2.8) | 194 (3.2) | 0.598 |
NOTES: ADHD = attention-deficit/hyperactivity disorder; ENT = ear, nose, and throat; OCD = obsessive-compulsive disorder; OT = occupational therapy; PT = physical therapy.
Table 6-2, and Table 6-3). Additional comparisons of clinical characteristics for different age groups as well as a breakdown of ICD-10 and CPT codes for clinical characteristics can be found in Appendix D.
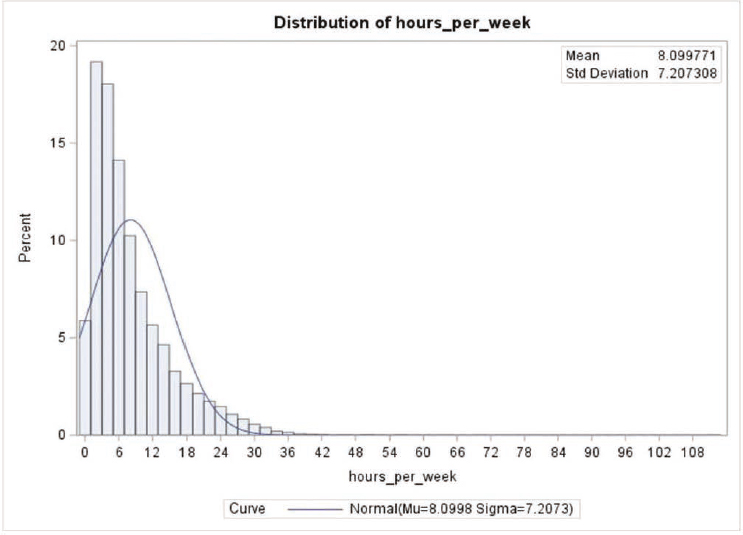
Among ABA recipients, the number of hours per week of ABA treatment trends low (60% of ABA recipients receive less than five hours/week) and 20+ hours/week is rare (4% of ABA recipients). Even among the youngest children, the majority receive less than 10 hours/week. See Figure 6-5 for a distribution on the average amount of ABA by age and Figure 6-6 for a distribution of ABA intensity among 26,131 continuous users. Table 6-4 compares the presence of other services and other conditions between groups defined by amount of ABA. Based on these data, increasing amounts of ABA are associated with increasing use of other services. Notable differences in co-occurring conditions include the presence of delayed milestones higher among higher-intensity ABA users contrasted with the presence of attention-deficit/hyperactivity disorder (ADHD) and anxiety (and other mental health conditions) higher among lower-intensity ABA users.
TABLE 6-3 Clinical Characteristics for Ages 12 to 18 Years Old
| Continuous Users | Intermittent Users | Non-participants | p | |
|---|---|---|---|---|
| N | 2,729 | 1,169 | 26,249 | |
| Other Services | n (%) | n (%) | n (%) | p |
| Dietitian | 275 (10.1) | 100 (8.6) | 1,943 (7.4) | <0.001 |
| Speech | 385 (14.1) | 93 (8.0) | 1,252 (4.8) | <0.001 |
| PT/OT | 191 (7.0) | 49 (4.2) | 860 (3.3) | <0.001 |
| ENT/Audiology | 76 (2.8) | 36 (3.1) | 539 (2.1) | 0.004 |
| OT Feeding Difficulties | 48 (1.8) | 16 (1.4) | 222 (0.8) | <0.001 |
| Other Conditions | n (%) | n (%) | n (%) | p |
| ADHD | 1,171 (42.9) | 527 (45.1) | 13,129 (50.0) | <0.001 |
| Sleep Disorder | 246 (9.0) | 105 (9.0) | 2,061 (7.9) | 0.047 |
| Genetic Disorder | 126 (4.6) | 34 (2.9) | 508 (1.9) | <0.001 |
| Delayed Milestone | 129 (4.7) | 20 (1.7) | 365 (1.4) | <0.001 |
| Epilepsy | 189 (6.9) | 44 (3.8) | 987 (3.8) | <0.001 |
| Intellectual Disability | 197 (7.2) | 51 (4.4) | 992 (3.8) | <0.001 |
| Depression | 215 (7.9) | 191 (16.3) | 6,687 (25.5) | <0.001 |
| Anxiety | 585 (21.4) | 323 (27.6) | 9,651 (36.8) | <0.001 |
| OCD | 79 (2.9) | 41 (3.5) | 1,130 (4.3) | 0.001 |
| Other Mental Health | 414 (15.2) | 253 (21.6) | 6,683 (25.5) | <0.001 |
NOTES: ADHD = attention-deficit/hyperactivity disorder; ENT = ear, nose, and throat; OCD = obsessive-compulsive disorder; OT = occupational therapy; PT = physical therapy.

NOTE: Data from 57,774 observations from 26,131 unique individuals categorized as continuous users of ABA.
Planning Analytic Approach
While waiting for the data to be delivered to Westat, the committee engaged in developing and refining analytic approaches that would address questions in its statement of task (see Chapter 1, Box 1-3). This section highlights some of the considerations and questions raised. Notably, potential approaches focused on analysis of the effects of ABA and review of health outcomes and whether it would be possible to determine the prevalence of autism within this military sample. The following research questions were considered:
- What drives participation in the ACD? What are differences between individuals with an autism diagnosis participating in the ACD and those not participating?
- What drives the amount of ABA received and length of participation in ACD? What is the frequency of ABA utilization in the population participating in the ACD?
- What factors contribute to the adherence of ABA for TRICARE beneficiaries under 18?
TABLE 6-4 Clinical Characteristics by Amount of ABA (Hours per Week)
| Hours/week | 0-5 | 5-10 | 10-20 | 20+ | p |
|---|---|---|---|---|---|
| N | 21,160 | 7,609 | 4,968 | 1,297 | |
| Other Services | n (%) | n (%) | n (%) | n (%) | p |
| Dietitian | 9,392 (44.4) | 3,880 (51.0) | 2,681 (54.0) | 723 (55.7) | <0.001 |
| Speech | 13,589 (64.2) | 5,924 (77.9) | 4,325 (87.1) | 1,167 (90.0 | <0.001 |
| PT/OT | 12,606 (59.6) | 5,422 (71.3) | 3,794 (76.4) | 995 (76.7) | <0.001 |
| ENT/Audiology | 4,733 (22.4) | 2,199 (28.9) | 1,709 (34.4) | 469 (36.2) | <0.001 |
| OT Feeding Difficulties | 4,727 (22.3) | 2,358 (31.0) | 1,828 (36.8) | 486 (37.5) | <0.001 |
| Other Conditions | n (%) | n (%) | n (%) | n (%) | p |
| ADHD | 10,696 (50.5) | 3,324 (43.7) | 1,733 (34.9) | 390 (30.1) | <0.001 |
| Sleep Disorder | 5,780 (27.3) | 2,215 (29.1) | 1,389 (28.0) | 339 (26.1) | 0.013 |
| Genetic Disorder | 1,341 (6.3) | 560 (7.4) | 352 (7.1) | 83 (6.4) | 0.011 |
| Delayed Milestone | 9,052 (42.8) | 4,255 (55.9) | 3,137 (63.1) | 863 (66.5) | <0.001 |
| Epilepsy | 1,620 (7.7) | 645 (8.5) | 422 (8.5) | 86 (6.6) | 0.015 |
| Intellectual Disability | 1,799 (8.5) | 644 (8.5) | 364 (7.3) | 74 (5.7) | <0.001 |
| Depression | 2,563 (12.1) | 484 (6.4) | 156 (3.1) | 36 (2.8) | <0.001 |
| Anxiety | 6,526 (30.8) | 1,844 (24.2) | 794 (16.0) | 132 (10.2) | <0.001 |
| OCD | 931 (4.4) | 290 (3.8) | 121 (2.4) | 22 (1.7) | <0.001 |
| Other Mental Health | 6,488 (30.7) | 2,018 (26.5) | 1,120 (22.5) | 264 (20.4) | <0.001 |
NOTES: ADHD = attention-deficit/hyperactivity disorder; ENT = ear, nose, and throat; OCD = obsessive-compulsive disorder; OT = occupational therapy; PT = physical therapy.
- Do the scores on required assessment tools change over time? What factors contribute to changes in scores? Can the change in scores be linked to progress on health outcomes from ABA?
- Do scores on different assessment tools reasonably compare? To what extent are they measuring progress on similar or different autism domains?
- What is an adequate calculation of amount of ABA from filed claims (procedures codes)?
- What are adequate proxies for important covariates missing from the databases?
- What is the prevalence of autism in the military population?
The following covariates (some unchanging characteristics, others varying in time) were considered:
- Demographics (age, sex, race/ethnicity, location)
- Level of autism severity
- Time from diagnosis to initiate ABA
- State of participation in ACD—continuous or categorized in other ways? (How to quantify start and end dates?)
- Comorbidities—other chronic medical conditions (Which are most relevant to autism and delivery of ABA?)
- Co-occurring (or prior) interventions or healthcare services (Which are most relevant to autism and delivery of ABA?)
- Co-occurring (or prior) medications (Which are most relevant to autism and delivery of ABA?)
- Who completed the assessment tools
- Caregiver training and participation
- Family satisfaction
Descriptive Analysis of Assessments
As discussed in Chapter 3, DHA began collecting data on ACD participants from a set of standardized assessment tools in January 2017. The specific tools and frequency of administration changed over time, but the collection of assessment data has continued through 2025. DHA published findings from its analyses of these data in its reports to Congress, beginning with FY 2018 Quarter 4. This set of tools was introduced in the ACD in response to Congress’s request for reports on health-related outcomes (see Appendix E, Senate Report 114-255, S. 2943, p. 205) and is referred to as “outcome measures” in the TRICARE operations manual. The managed care service contractors have been directed to help ABA providers use assessment scores from the Vineland-3, SRS, and PDDBI in treatment planning (DHA, 2023a). Assessments of parent/caregiver stress are also required through the PSI-SF or the Stress Index for Parents of Adolescents (SIPA); however, these are not to be used for a beneficiary’s treatment planning.
The committee heard from researchers, ABA providers, and families who all raised questions regarding the required set of assessment tools and the data analyses conducted by DHA (National Academies of Sciences, Engineering, and Medicine [NASEM], 2024a, 2025). As such, the committee sought to understand these concerns and the utility of these tools.
The committee’s data request for ACD records data included scores and subscores from the PDDBI, Vineland-3, SRS, and PSI-SF. Table 6-5 provides an example of the number of assessment scores recorded 2018 to 2023 for the 36,420 ACD participants. Subscores from these assessment tools (such as the Vineland-3 subscores on Socialization, Communication, Daily Living Skills, and External Maladaptive Behaviors) were only recorded 2021 to 2023.
With the availability of assessment scores and subscores, the committee considered testing the association between the amount of ABA received and changes in scores and subscores on the required assessment tools using
TABLE 6-5 Summary of Availability of Assessment Scores for ACD Participants (N = 36,420)
| Number of individuals with 1 or more PDDBI teacher composite score by number of assessments with or without available date of assessment (Total = 18,500) | Number of individuals with 1 or more Vineland-3 parent ABC score by number of assessments with or without available date of assessment or of which parent completed assessment (Total = 26,000) |
|---|---|
| Has 1 score: 5,281 | Has 1 score: 12,515 |
| 2 scores: 4,253 | 2 scores: 7,206 |
| 3 scores: 2,986 | 3 scores: 4,081 |
| 4 scores: 2,287 | 4 or more: 2,346 |
| 5 or more: ~3,700 |
NOTE: For the PDDBI assessments, there were 3,577 unique individuals missing assessment dates for all assessments. For the Vineland assessments, there were 7,649 unique individuals missing assessment dates for all their assessments. The vast majority of these were all prior to 2021.
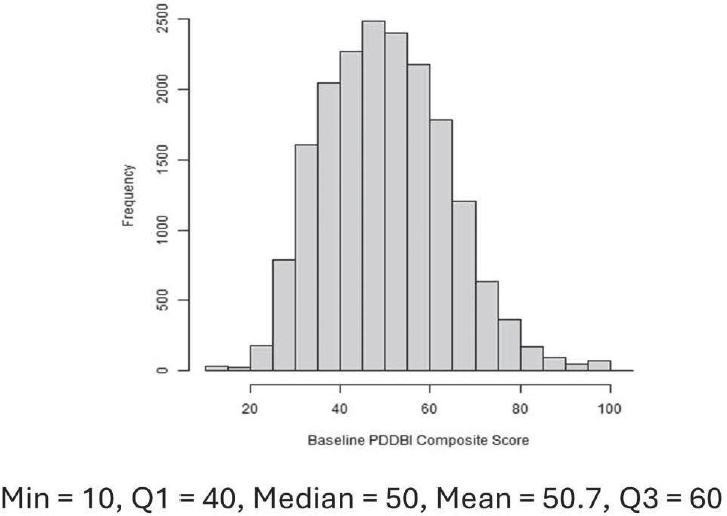
multivariate and mixed effects linear regression and defining the target outcome as the difference between the last and first assessment. The amount of ABA would be defined as the summed hours of ABA obtained from procedure codes that lie between assessment periods. Important covariates would have to be included. The committee considered whether the PDDBI baseline score could be used as a categorical variable to reflect autism severity (see Figure 6-7 for distribution of PDDBI teacher composite scores of the initial assessment [baseline] for ACD participants). However, due to time constraints, data limitations, and concerns about the quality of the data collected from these assessment tools, the committee did not pursue thorough testing of the association between the amount of ABA received and outcomes as measured by the assessment tools. It did some preliminary modeling of the change in the PDDBI REXSCA (receptive/expressive social communication abilities dimension) subscore and for the Vineland-3 ABC composite score. It also compared mean scores and subscores against demographic characteristics and did not find any important variations. See Appendix D for details on this approach and list of assessment subscores that the committee viewed as most relevant to delivery of ABA.
The committee argues against the continuation of data collection from these assessment tools. We generally think the dataset is not useful enough to address questions around ABA, autism, or the effectiveness of the ACD program to be worth the burden of administering the assessments periodically to participating families.
Furthermore, for clinical purposes, DHA’s selection of the required assessment tools is out of step with the current assessment practices to evaluate
individual progress with ABA (see Chapter 4). A significant concern is that the same battery of assessments is required for all beneficiaries regardless of their characteristics (e.g., age, functioning, autism severity level, treatment goals), and this places additional burden on ABA providers to carry out these assessments in addition to those chosen to be developmentally appropriate for individualized treatment planning. Another concern is that they are all indirect measures and rely heavily on parent reporting. Entire sections of these tools may be difficult to complete for parents who have children with moderate or profound cognitive impairment. As a set, there is construct overlap (e.g., basic social communication is over-sampled), and as such, it is not adequately capturing all of the autism domains that would exist among the autistic population. The set also does not adequately cover all of the co-occurring conditions relevant to one’s functioning and is lacking broader coverage of quality-of-life indicators.
Of note, the use of scores from standardized tools to measure change is often misunderstood. Maintaining the same score over time, for example on the Vineland-3, means that the child gained skills at the same rate as neurotypical children during the same period. Small increases in raw scores may represent meaningful change, while the corresponding standard score may not increase or could even decrease while progress is being made. Any reassessments using such standardized tools are typically recommended in
intervals greater than a year for meaningful information (Ridout & Eldevik, 2024). They can be useful for monitoring the overall development of an autistic individual and to ensure that developmental regressions are not occurring, which may need medical attention but are less useful to track short-term outcomes of interventions.
There are concerns about the legacy tools required for the ACD population, particularly in a period of measurement advancement for autism interventions in general. Standard normed-reference measures of adaptive behavior like the Vineland-3 are common tools in research and in community-based programs (Ridout & Eldevik, 2024). The Vineland–3 is frequently recommended for ABA assessment because its scales are more closely associated with some targets of ABA services compared to the other measures. While the Vineland-3 has value for cross-sectional comparisons, its psychometric and practical drawbacks limit its utility for progress monitoring of individuals receiving ABA (NASEM, 2025). The Vineland-3 daily living skills scale does map to adaptive function targets of ABA; however, the socialization and communication scales are not consistent with a modern understanding of social communication and interaction behavior. The Vineland-3 is able to broadly track socialization but is lacking the ability to inform treatment planning for important skills addressed by ABA (Frazier, Chetcuti, & Uljarevic, 2025).
The SRS is an inadequate measure for assessing progress for individuals receiving ABA services. It does not cover the key social communication and interaction content areas necessary for understanding and monitoring progress in people with autism. Because of its norm-referenced methodology, it does not lend itself to measuring specific ABA service goals for autistic individuals. Also, because it is designed to be a stable assessment measure, its sensitivity to changes that may occur resulting from ABA services is questionable. In addition, not all the items on the SRS are applicable to all of the autism cases that are going to be seen, particularly those with lower levels of cognitive function or with speech difficulties.
The PDDBI was designed specifically to evaluate change in functioning and assess response to intervention for children with autism; however, it was not specifically built for ABA outcome assessment (NASEM, 2025). According to Frazier (2024), who has examined the instrument’s psychometric properties, the factor structure and scoring are unclear with inadequate coverage of social communication and interaction and restricted and repetitive behaviors relevant to treatment planning for ABA. Of note, because the PDDBI was administered more frequently in the ACD, DHA has relied on data from the PDDBI assessments, particularly changes in the autism composite score from the parent form, in its reports to Congress. However, DHA chose to use the PDDBI data in an inappropriate analytic manner. Neither the total score nor the autism composite scores were designed to
measure progress. According to the developers, there were two composite measures developed for those purposes: the AWP (approach-withdrawal problems dimension) was the summary measure for maladaptive behavior or avoidance of communication (so one would look for decreased score to measure progress) and REXSCA/C for assessment of social communication (so one would expect to see increases in this score; Cohen, 2024). DHA did not use these data from the PDDBI in its analyses.
The PSI-SF and SIPA are measures used for screening for problematic stress indicators, capturing child characteristics, parent characteristics, and situational stressors. The instruments have a long history of clinical and research use. However, there has been no study of sensitivity change in the scores for parents in relation to behavioral interventions for their children. DHA has reported that the ABA providers are to administer the PSI-SF or SIPA and use results to make recommendations for ABA treatment goals or additional services as appropriate. DHA also collects the domain scores from contractors to use in its evaluation of the ACD and family support services (DHA, 2023b; DoD, 2022d). Parents participating in the ACD expressed distress about the recent requirement to fill out the PSI-SF or SIPA every six months, citing concerns about the inappropriate and invasive nature of the questions, the added stress in filling them out, the discriminatory practice of requiring these assessments only for parents utilizing ABA and not other interventions, the unclear nature of how scores are being used, and lack of follow up with any guidance for stress management, mental health supports, or counseling if deemed necessary. ABA providers acknowledged to the committee that in being required to administer the stress indices they are acting outside their scope of practice and expertise.
Over the years, DHA has repeatedly reported that conducting analyses with data collected from the assessment tools has been challenging for a number of reasons: (a) reporting inconsistencies resulting from a change in managing contractors (DoD, 2018b), (b) measures not yet being in place long enough for repeat administration in the same beneficiaries (DoD, 2019b), and (c) the 2021 policy changes that prohibited making comparisons between continuing and new participants in the ACD (DoD, 2024b). Nonetheless, with each report to Congress, DHA anticipated that the continued data collection would eventually allow for comparisons and analysis that would both assist with treatment planning for individuals and help inform the demonstration (DoD, 2019b). DHA did not have a good data collection plan in place before it began.
The analyses in the reports by DoD to Congress were not set up to drive scientific findings because they did not have appropriately matched comparison samples from which to draw generalizable conclusions. They also did not take into account the individual goals of the intervention for each client, possible mitigating or compounding factors (see list of covariates
above), and the clinical significance of the scoring (Cohen, 2020, 2024). DHA’s analyses have relied primarily on data from the PDDBI, notably the changes in the parent-reported composite score, since the PDDBI was the only tool administered every six months over significant periods of data collection (see quarterly reports to Congress on the ACD for FY 2018, Q4; FY 2019, Q1–Q4; and FY 2020, Q1 [DoD, 2019c,d,e, 2020b,c,d] and annual reports for FY 2019 and FY 2020 [DoD, 2020a, 2021b]).
All of these problems—poor data collection plan, missing dates and duplicates, varied observations (assessments) per individual, and frustration on the part of those required to submit the data—limit the usefulness of these data to assess effects of ABA on health outcomes. The committee did not have access to the individual goals of ABA; however, it recognized that many important health and well-being goals appropriate for ABA would not be measured by these specific assessment tools. This adds a lot of noise to the analysis that would wash out important findings. Further, there will be important changes that happen in real life between assessments that also will limit the interpretation of any results based on these assessment tools.
Without an appropriate control group, any effect of ABA may be misinterpreted. Autism is an exceptionally heterogenous condition, and individuals who participate in the ACD are likely different than those who do not. Any analysis may give results biased toward those that self-select to participate in the ACD and variations in continuing and dropping out of ABA services. While the committee, given time for analyses, might have been able to make a “pseudo control group” using propensity score methods, there are concerns about defining the outcome when information available on assessments does not compare well among participants or about using claims data that do not capture important differences between ACD participants and non-participants.
After much deliberation on the data quality and the opportunity to access these data to address questions of interest on ABA, the committee had mixed opinions on whether the data already assembled may be valuable to future scientific inquiry. It recognized that the administration of these assessments may have begun as a well-intentioned effort to improve the understanding of ABA benefits to autistic individuals and appreciated that no other healthcare system may have assembled such information. DHA could consider archiving the data into a research repository, linkable with other military health records, and make the assessment data accessible for future rigorously designed research with appropriate protections for human subjects. The committee cautions that the data should not be used to examine whether ABA is effective but instead should be used to look at more substantive research questions that can inform the personalization of ABA as an autism intervention. The dataset is administrative in nature and was not set up with proper controls for research purposes but could be
useful for examining individual differences, but even this is tenuous. What would have been necessary for program efficacy testing is a separate cohort of autistic individuals not using ABA services, who were demographically similar to those in the ACD and completed the same assessments over time.
DISCUSSION
This chapter has explained the data made available to the committee as part of the creation of this report. This discussion provides findings from analyzing healthcare claims data on individuals diagnosed with autism from 2018–2023 in a military-connected population. Throughout its deliberations, the committee recognized that multiple factors would affect the delivery and outcomes of ABA, such as age, comorbidities, co-occurring healthcare services, family moves, etc. While the committee did not have enough time with the data to dig into these factors, it set out to characterize the ACD participants. It is also difficult to evaluate or contextualize this information without comparable information from the general population or other autistic populations receiving ABA. Hopefully these findings can be useful to DHA as it plans for future coverage of ABA services. The chapter discussion also provides critique on the assessment tools required by the ACD (and data associated with them) as background for the conclusion and recommendation on these required tools in Chapter 7.
As the committee became familiar with the nature of the data available for this study, it discussed research questions and analytic approaches that would address questions in its statement of task (see Chapter 1, Box 1-3). Potential approaches focused on analysis of the effects of ABA and review of health outcomes and whether it would be possible to determine the prevalence of autism within this military sample. To estimate prevalence, the committee would have needed a comparable sample of children (TRICARE-eligible beneficiaries) without an autism diagnosis. The committee did not have access to this information, nor did it receive a reliable total count of children during this study period to make the estimate.
Given limitations with the data discussed in this chapter, the committee prioritized its data analyses to improve understanding of the utilization of the ACD and ABA services. It sought to identify similarities and differences between autistic individuals who participated in the ACD and those who did not on demographic and clinical characteristics. It examined a sample of 109,073 unique individuals—children ages 1–18 years old with an autism diagnosis and who are eligible for TRICARE benefits over a six-year period from calendar years 2018 to 2023. A third of the sample participated in the ACD and received ABA during this time. Most of the participants were under age 12, and the majority of participants received ABA less than five hours per week on average with 20 or more hours per week as rare.
Most participants were male, as expected for an autistic population. The majority of ACD participants lived in the east region of the United States.
There are a number of possible reasons for why autistic children in the sample did not receive ABA (68%) or used ABA intermittently (8% of total sample); these include, for example, (a) a larger proportion of older children in non-participants group who may or may not have received ABA prior to 2018 (see Figure 6-3); (b) observed hurdles in eligibility requirements to participate in the ACD and to continue access to services (see Chapter 3); (c) challenges with relocations or finding local ABA providers; (d) no or other interventions selected by families due to individual and family choice or needs; and/or (e) received ABA outside of the ACD. The committee did not have access to the data necessary to examine these possibilities.
Of those that received ABA over this period, the committee subdivided the group into regular or continuous users of ABA (75%) and intermittent users of ABA (25%). The committee observed that continuous recipients tended to be younger children, to have more co-occurring conditions like delayed milestones, and to have greater utilization of other services in addition to ABA. Notably, however, mental health issues (e.g., depression and anxiety) were more common among those not receiving ABA, particularly for older children.
Delayed milestones are consistently somewhat higher in continuous participants across age groups (e.g., for five-year-olds, continuous = 19.9%, intermittent = 13.6%, non-participants = 15.8%). The diagnosis record of intellectual disability is probably underreported but presents differently in older groups. Recording intellectual disability is higher in continuous participants than non-participants in the 12-to-18-year-old group (7.2% vs. 3.8%).
Differences in recorded depression, anxiety, and other mental health conditions across participation groups become higher in older age groups than in younger groups. Among 12-to-18 year-olds, non-participants are much higher in depression than continuous ABA users (25.5% vs. 7.9%), as well as for other mental health conditions (25.5% vs. 15.2%) and anxiety disorders (36.8% vs. 21.4%).
The committee also ran some comparisons of ACD participants sub-grouped by ABA intensity (the average amount of ABA received in hours per week). Based on these data, increasing amounts of ABA are associated with increasing use of other services. Notable differences in co-occurring conditions include the presence of delayed milestones higher among higher-intensity ABA users contrasted with the presence of ADHD and anxiety (and other mental health conditions) higher among lower-intensity ABA users.
While it is difficult to draw strong conclusions from these analyses, observations from these findings suggest that primary utilizers of ABA include autistic children under age six and those with more severe forms of autism,
given the higher percentages of other healthcare services needed and of the presence of other co-occurring conditions. Another observation is that ABA seems to have a positive association on reducing the need for services for depression, anxiety, and other mental health conditions. Of concern to the committee, the claims data indicate that most individuals received less than five hours a week of ABA services (60% of the ACD participants) during this study period 2018–2023. As such, many failed to receive an ABA intensity for which there is a demonstrated level of efficacy as discussed in Chapter 5. However, more research is needed on the effects of low-intensity ABA as well as the integration of ABA with other interventions and services and family decisions and capacity to access ABA.


