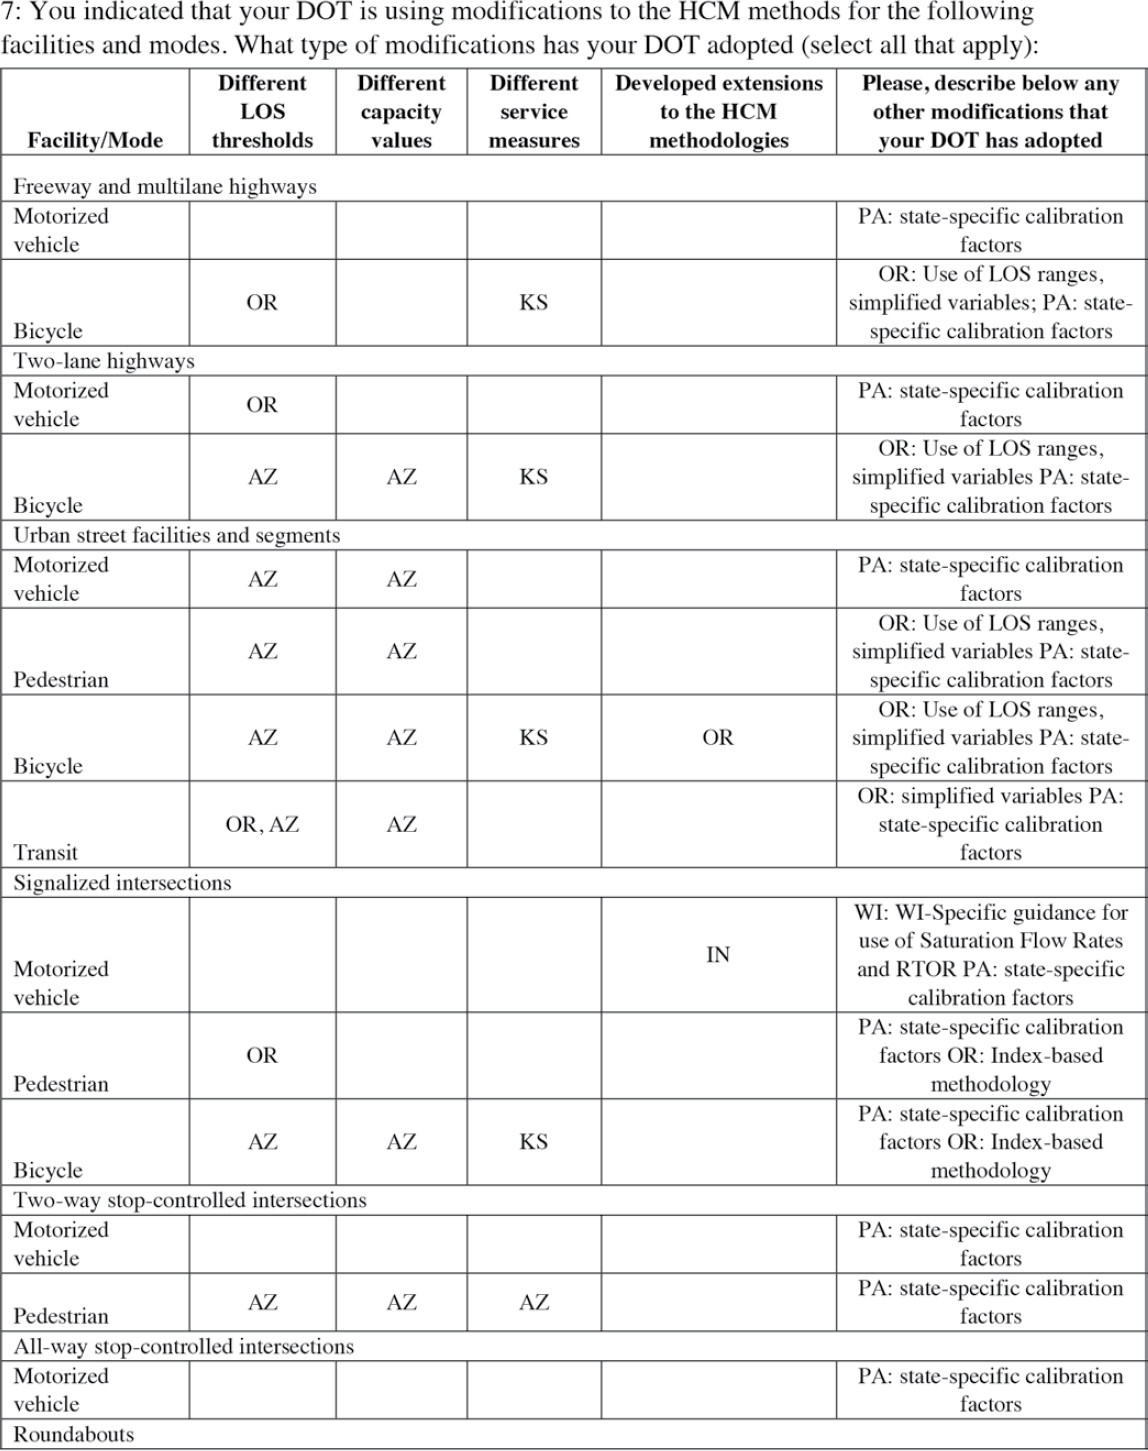
Traffic Capacity Level of Service: Adaptations and Usage (2025)

Chapter: Appendix B: Survey Responses

Previous Chapter: Appendix A: Survey Questionnaire
Page 61
Suggested Citation: "Appendix B: Survey Responses." National Academies of Sciences, Engineering, and Medicine. 2025. Traffic Capacity Level of Service: Adaptations and Usage. Washington, DC: The National Academies Press. doi: 10.17226/29143.
Page 62
Suggested Citation: "Appendix B: Survey Responses." National Academies of Sciences, Engineering, and Medicine. 2025. Traffic Capacity Level of Service: Adaptations and Usage. Washington, DC: The National Academies Press. doi: 10.17226/29143.
The column headers are as follows: Use of L O S in or as; Uses L O S; Does Not Use L O S; Not applicable. The data given in the table rows is as follows: Row 1: Environmental impact studies; C A, F L, C O, N E, N C, O K, M I, D C, K S, W A, A R, W I, G A, N E, T N, I A, A K, P A, M O, K Y, A Z, I N, N Y, M N, U T, T X, L A; S C, O R, N H, M S, N M; S C, O H, I D, W Y, I L, N D, M E, V T. Row 2: Greenhouse gas reductions or sustainability-focused policies; C A, C O, D C, O H, N V, I A, I L; M I, O R, K S, W I, G A, I D, N H, A K, M S, A Z, I N, L A, N Y, M N, U T, N M, T X; F L, S C, S D, N E, N C, O K, W A, A R, W Y, T N, P A, M O, N D, M E, K Y, V T. Row 3: Congestion management programs or policies; C A, F L, S C, C O, N E, N C, M I, D C, K S, W A, O H, A R, G A, N V, N H, T N, I A, I L, M S, M O, M E, A Z, I N, N Y, M N, U T, N’; L A, O R, W I, A K, P A; S C, O K, I D, W Y, N D, K Y, V T, T X. Row 4: Traffic engineering studies; C A, F L, S C, C O, S D, N E, N C, O K, M I, D C, K S, W A, O H, A R, W I, G A, N V, I D, N H, W Y, N, I A, I L, A K, M S, P A, M O, N D, M E, K Y, V T, A Z, I N, L A, N Y, M N, U T, N M, T X; O R; Blank. Row 5: Transportation system performance monitoring; C A, F L, S C, C O, S D, N E, D C, K S, W A, A R, W I, G A, N V, W Y, I L, M S, M O, M E, K Y, A Z, I N, U T; NC, MI, OR, N H, T N, I A, A K, P A, L A, N Y, M N, T X; O K, O H, I D, N D, V T, N M. Row 6: Infrastructure evaluation criteria; C A, F L, S C, C O, N E, N C, M I, D C, W A, A R, W I, N V, N H, T N, I A, I L, A K, M S, M O, M E, I N, M N, N M; S D, O R, K S, P A, A Z, L A, U T; OK, OH, GA, I D, W Y, N D, K Y, V T, N Y, T X. Row 7: Assessment of land use projects; C A, F L, C O, S D, N E, N C, D C, K S, A R, G A, N V, N H, T N, I A, I L, A K, P A, M E, I N, N Y, M N, N M, T X, V A; M I, O R, W A, W I, M S, L A, U T; SC, OK, OH, I D, W Y, M O, N D, K Y, V T, A Z. Row 8: Multimodal evaluation; C A, S C, C O, N E, O R, D C, K S, O H, W I, G A, N V, W Y, T N, I L, P A, M E, K Y, A Z, N Y, M N, U T, T X; F L, S D, N C, M I, W A, A R, N H, M S, M O, I N, L A; OK, ID, I A, A K, N D, V T, N M. Row 9: Transit evaluation; C A, C O, N E, O R, D C, O H, W I, G A, W Y, T N, I L, M O, M E, A Z, M N, U T; F L, S C, S D, N C, M I, K S, W A, N V, N H, M S, P A, I N, L A, N Y; O K, A R, I D, I A, A K, N D, K Y, V T, N M, T X. Row 10: Non-motorized transportation projects; C A, S C, C O, O R, D C, G A, T N, I L, A K, P A, N Y, U T; F L, S D, N E, N C, M I, K S, W A, A R, N V, N H, M S, M O, K Y, A Z, I N, M N, N M, L A; O K, O H, W I, I D, W Y, I A, N D, M E, V T, T X. Row 11: Freight transportation projects; C A, F L, C O, N E, O K, K S, W A, G A, N V, T N, I L, M S, A Z, T X; S C, S D, N C, M I, D C, A R, N H, O A, I N, L A, N Y, M N, U T, N M; O R, O H, W I, I D, W Y, I A, A K, M O, N D, M E, K Y, V T. Row 12: Intersection control evaluation (I C E); C A, F L, S C, S D, N E, O K, M I, D C, K S, W A, O H, A R, W I, G A, N V, N H, W Y, T N, I A, I L, M S, P A, M O, M E, M Y, A Z, I N, K A, M N, U T, T X; C O, O R; NC, ID, AK, N D, V T, N Y, N M. Row 13: Intersection and or roadway design; C A, F L, S C, C C O, S D, N E, N C, O K, M I, D C, K S, W A, A R, W I, G A, N V, I D, N H, W Y, T N, I A, I L, A K, M S, P A, M O, N D, M E, K Y, V T, A Z, I N, L A, N Y, M N, U T, N M, T X, V A; O R; O H. Row 14: Tool communicating impact to public; C A, F L, S C, C O, S D, N E, N C, O K, M I, O R, D C, K S, W A, O H, A R, W I, G A, I D, N H, W Y, T N, I A, A K, M S, P A, M O, N D, M E, K Y, L A, N Y, M N, U T, T X; N C, N M; V T, A Z, I N. Row 15: Assessment of user perspectives or expectations about a facility and or mode; C A, F L, S C, C O, S D, N C, M I, O R, D C, K S, W A, A R, W I, G A, I L, M S, P A, M O, M E, K Y, A Z, I N, L A, N Y, M N, U T; N E, N V, N H, N M; O K, O H, I D, W Y, T N, I A, A K, N D, V T, T X. Row 16: Safety improvements; C A, F L, S C, C O, N E, N C, O K, M I, D C, W A, O H, G A, I D, N H, W Y, I A, I L, M S, M O, M E, V T, A Z, I N, K A, N Y, M N; S D, O R, K S, A R, N V, T N, P A, N D, K Y, U T, N M; W I, A K, T X.
Page 63
Suggested Citation: "Appendix B: Survey Responses." National Academies of Sciences, Engineering, and Medicine. 2025. Traffic Capacity Level of Service: Adaptations and Usage. Washington, DC: The National Academies Press. doi: 10.17226/29143.
The column headers are as follows: Use of L O S in or as; Uses L O S; Does Not Use L O S; Not applicable. The data given in the table rows is as follows: Row 1: Environmental impact studies; C A, F L, C O, N E, N C, O K, M I, D C, K S, W A, A R, W I, G A, N E, T N, I A, A K, P A, M O, K Y, A Z, I N, N Y, M N, U T, T X, L A; S C, O R, N H, M S, N M; S C, O H, I D, W Y, I L, N D, M E, V T. Row 2: Greenhouse gas reductions or sustainability-focused policies; C A, C O, D C, O H, N V, I A, I L; M I, O R, K S, W I, G A, I D, N H, A K, M S, A Z, I N, L A, N Y, M N, U T, N M, T X; F L, S C, S D, N E, N C, O K, W A, A R, W Y, T N, P A, M O, N D, M E, K Y, V T. Row 3: Congestion management programs or policies; C A, F L, S C, C O, N E, N C, M I, D C, K S, W A, O H, A R, G A, N V, N H, T N, I A, I L, M S, M O, M E, A Z, I N, N Y, M N, U T, N’; L A, O R, W I, A K, P A; S C, O K, I D, W Y, N D, K Y, V T, T X. Row 4: Traffic engineering studies; C A, F L, S C, C O, S D, N E, N C, O K, M I, D C, K S, W A, O H, A R, W I, G A, N V, I D, N H, W Y, N, I A, I L, A K, M S, P A, M O, N D, M E, K Y, V T, A Z, I N, L A, N Y, M N, U T, N M, T X; O R; Blank. Row 5: Transportation system performance monitoring; C A, F L, S C, C O, S D, N E, D C, K S, W A, A R, W I, G A, N V, W Y, I L, M S, M O, M E, K Y, A Z, I N, U T; NC, MI, OR, N H, T N, I A, A K, P A, L A, N Y, M N, T X; O K, O H, I D, N D, V T, N M. Row 6: Infrastructure evaluation criteria; C A, F L, S C, C O, N E, N C, M I, D C, W A, A R, W I, N V, N H, T N, I A, I L, A K, M S, M O, M E, I N, M N, N M; S D, O R, K S, P A, A Z, L A, U T; OK, OH, GA, I D, W Y, N D, K Y, V T, N Y, T X. Row 7: Assessment of land use projects; C A, F L, C O, S D, N E, N C, D C, K S, A R, G A, N V, N H, T N, I A, I L, A K, P A, M E, I N, N Y, M N, N M, T X, V A; M I, O R, W A, W I, M S, L A, U T; SC, OK, OH, I D, W Y, M O, N D, K Y, V T, A Z. Row 8: Multimodal evaluation; C A, S C, C O, N E, O R, D C, K S, O H, W I, G A, N V, W Y, T N, I L, P A, M E, K Y, A Z, N Y, M N, U T, T X; F L, S D, N C, M I, W A, A R, N H, M S, M O, I N, L A; OK, ID, I A, A K, N D, V T, N M. Row 9: Transit evaluation; C A, C O, N E, O R, D C, O H, W I, G A, W Y, T N, I L, M O, M E, A Z, M N, U T; F L, S C, S D, N C, M I, K S, W A, N V, N H, M S, P A, I N, L A, N Y; O K, A R, I D, I A, A K, N D, K Y, V T, N M, T X. Row 10: Non-motorized transportation projects; C A, S C, C O, O R, D C, G A, T N, I L, A K, P A, N Y, U T; F L, S D, N E, N C, M I, K S, W A, A R, N V, N H, M S, M O, K Y, A Z, I N, M N, N M, L A; O K, O H, W I, I D, W Y, I A, N D, M E, V T, T X. Row 11: Freight transportation projects; C A, F L, C O, N E, O K, K S, W A, G A, N V, T N, I L, M S, A Z, T X; S C, S D, N C, M I, D C, A R, N H, O A, I N, L A, N Y, M N, U T, N M; O R, O H, W I, I D, W Y, I A, A K, M O, N D, M E, K Y, V T. Row 12: Intersection control evaluation (I C E); C A, F L, S C, S D, N E, O K, M I, D C, K S, W A, O H, A R, W I, G A, N V, N H, W Y, T N, I A, I L, M S, P A, M O, M E, M Y, A Z, I N, K A, M N, U T, T X; C O, O R; NC, ID, AK, N D, V T, N Y, N M. Row 13: Intersection and or roadway design; C A, F L, S C, C C O, S D, N E, N C, O K, M I, D C, K S, W A, A R, W I, G A, N V, I D, N H, W Y, T N, I A, I L, A K, M S, P A, M O, N D, M E, K Y, V T, A Z, I N, L A, N Y, M N, U T, N M, T X, V A; O R; O H. Row 14: Tool communicating impact to public; C A, F L, S C, C O, S D, N E, N C, O K, M I, O R, D C, K S, W A, O H, A R, W I, G A, I D, N H, W Y, T N, I A, A K, M S, P A, M O, N D, M E, K Y, L A, N Y, M N, U T, T X; N C, N M; V T, A Z, I N. Row 15: Assessment of user perspectives or expectations about a facility and or mode; C A, F L, S C, C O, S D, N C, M I, O R, D C, K S, W A, A R, W I, G A, I L, M S, P A, M O, M E, K Y, A Z, I N, L A, N Y, M N, U T; N E, N V, N H, N M; O K, O H, I D, W Y, T N, I A, A K, N D, V T, T X. Row 16: Safety improvements; C A, F L, S C, C O, N E, N C, O K, M I, D C, W A, O H, G A, I D, N H, W Y, I A, I L, M S, M O, M E, V T, A Z, I N, K A, N Y, M N; S D, O R, K S, A R, N V, T N, P A, N D, K Y, U T, N M; W I, A K, T X.
Page 64
Suggested Citation: "Appendix B: Survey Responses." National Academies of Sciences, Engineering, and Medicine. 2025. Traffic Capacity Level of Service: Adaptations and Usage. Washington, DC: The National Academies Press. doi: 10.17226/29143.
The column headers are Tasks or regulations; Adopted performance measures. The data given in the table are as follows: Row 1: Environmental impact studies; O R: v c; N M: none. Row 2: Greenhouse gas reductions or sustainability focused policies; MI: N O X emissions; K S: V M T per V H T; W I: air quality, C M A Q; N H: emissions; M S: G H G measures; A Z: N H S mileage; I N: V M T; N Y: delay, emissions; M N: travel times, change in A A D T; U T: pollution reduction measures; N M: none. Row 3: Congestion management programs or policies; W I: C M A Q; A K: air quality analysis; P A: travel time ratio; V A: vehicle hours of delay, reliability, speed. Row 4: Traffic engineering studies; O R: v c, V A: Reliability, Travel time indices (80th, 50th, and 95th), number of stops, Control delay, queue length. Row 5: Transportation system performance monitoring; N C: travel time measures; M I: probe data per speed; N H: travel time; T N: travel time reliability; I A: speed monitoring; A K: travel time; P A: travel time reliability; N Y: speed, congestion, travel time reliability, excess delay; T X: traffic volume, pavement condition; V A: vehicle miles traveled in excessively congested conditions, vehicle hours of delay, delay in unreliable conditions, reliability. Row 6: Infrastructure evaluation criteria; SD: none; O R: d c, v c; K S: A DT, truck traffic; P A: non-traffic related; A Z: gap analysis; U T; maintenance. Row 7: Assessment of land use projects; M I: economic; O R: v c; W A: not applicable; W I: A A D T, V M T, accessibility; M S: unsure; T X: R O W. Row 8: Multimodal evaluation; F L: L T S, S D: none; N C: various ped or bike indices; W A: L T S, A R: satisfaction of design standards; N H: not applicable; M S: unsure; M O: network connectivity; I N: not applicable; N Y: not applicable. Row 9: Transit evaluation; FL: some level of L O S but not detailed in the L O S Handbook; S D: none; N C: bus travel time; M I: present or not present; K S: ridership; W A: L T S; N V: travel time or reliability; I N: not applicable; N Y: not applicable. Row 10: Non-motorized transportation projects; F L: L T S, S D: none; NE: not applicable; N C: various indices; M I: present or not present; W A: L T S; K S: demand, cost or benefit; A R: satisfaction of design standards; N V: safety or delay; N H: not applicable; M O: network connectivity; K Y: we rarely have stand-alone non motorized transportation projects; A Z: speed crash; I N: not applicable; M N: travel time per delay; N M: none. Row 11: Freight transportation projects; S D: none; NC: travel time measures; M I: probe data per speed; D C: truck route accessibility; A R: case by-case determination; N H: not applicable; I N: variety, sometimes LOS sometimes V M T; N Y: not applicable; U T: clearance intervals and queue lengths; N M: delay. Row 12: Intersection control evaluation (I C E); CO: v c, delay without assigning L O S; O R: v c; V A: refer to M O Es in i C A P manual. Row 13: Intersection and or roadway design; O R: v c. Row 14: Tool communicating impact to public; N V: travel time; N M: delay. Row 15: Assessment of user perspectives or expectations about a facility and or mode; N E: not applicable; N V: safety; N H: public input; N M: delay per speed. Row 16: Safety improvements; S D: benefit or cost; O R: v c; K S: accident rates; A R: historic crash performance; N V: benefit or cost; T N: crash reduction factors; P A: H S M excess value; N D: C M Fs; K Y: H S M excess; U T: crash reduction; N M: crash reduction.
Page 65
Suggested Citation: "Appendix B: Survey Responses." National Academies of Sciences, Engineering, and Medicine. 2025. Traffic Capacity Level of Service: Adaptations and Usage. Washington, DC: The National Academies Press. doi: 10.17226/29143.
The column headers are Tasks or regulations; Adopted performance measures. The data given in the table are as follows: Row 1: Environmental impact studies; O R: v c; N M: none. Row 2: Greenhouse gas reductions or sustainability focused policies; MI: N O X emissions; K S: V M T per V H T; W I: air quality, C M A Q; N H: emissions; M S: G H G measures; A Z: N H S mileage; I N: V M T; N Y: delay, emissions; M N: travel times, change in A A D T; U T: pollution reduction measures; N M: none. Row 3: Congestion management programs or policies; W I: C M A Q; A K: air quality analysis; P A: travel time ratio; V A: vehicle hours of delay, reliability, speed. Row 4: Traffic engineering studies; O R: v c, V A: Reliability, Travel time indices (80th, 50th, and 95th), number of stops, Control delay, queue length. Row 5: Transportation system performance monitoring; N C: travel time measures; M I: probe data per speed; N H: travel time; T N: travel time reliability; I A: speed monitoring; A K: travel time; P A: travel time reliability; N Y: speed, congestion, travel time reliability, excess delay; T X: traffic volume, pavement condition; V A: vehicle miles traveled in excessively congested conditions, vehicle hours of delay, delay in unreliable conditions, reliability. Row 6: Infrastructure evaluation criteria; SD: none; O R: d c, v c; K S: A DT, truck traffic; P A: non-traffic related; A Z: gap analysis; U T; maintenance. Row 7: Assessment of land use projects; M I: economic; O R: v c; W A: not applicable; W I: A A D T, V M T, accessibility; M S: unsure; T X: R O W. Row 8: Multimodal evaluation; F L: L T S, S D: none; N C: various ped or bike indices; W A: L T S, A R: satisfaction of design standards; N H: not applicable; M S: unsure; M O: network connectivity; I N: not applicable; N Y: not applicable. Row 9: Transit evaluation; FL: some level of L O S but not detailed in the L O S Handbook; S D: none; N C: bus travel time; M I: present or not present; K S: ridership; W A: L T S; N V: travel time or reliability; I N: not applicable; N Y: not applicable. Row 10: Non-motorized transportation projects; F L: L T S, S D: none; NE: not applicable; N C: various indices; M I: present or not present; W A: L T S; K S: demand, cost or benefit; A R: satisfaction of design standards; N V: safety or delay; N H: not applicable; M O: network connectivity; K Y: we rarely have stand-alone non motorized transportation projects; A Z: speed crash; I N: not applicable; M N: travel time per delay; N M: none. Row 11: Freight transportation projects; S D: none; NC: travel time measures; M I: probe data per speed; D C: truck route accessibility; A R: case by-case determination; N H: not applicable; I N: variety, sometimes LOS sometimes V M T; N Y: not applicable; U T: clearance intervals and queue lengths; N M: delay. Row 12: Intersection control evaluation (I C E); CO: v c, delay without assigning L O S; O R: v c; V A: refer to M O Es in i C A P manual. Row 13: Intersection and or roadway design; O R: v c. Row 14: Tool communicating impact to public; N V: travel time; N M: delay. Row 15: Assessment of user perspectives or expectations about a facility and or mode; N E: not applicable; N V: safety; N H: public input; N M: delay per speed. Row 16: Safety improvements; S D: benefit or cost; O R: v c; K S: accident rates; A R: historic crash performance; N V: benefit or cost; T N: crash reduction factors; P A: H S M excess value; N D: C M Fs; K Y: H S M excess; U T: crash reduction; N M: crash reduction.
Page 66
Suggested Citation: "Appendix B: Survey Responses." National Academies of Sciences, Engineering, and Medicine. 2025. Traffic Capacity Level of Service: Adaptations and Usage. Washington, DC: The National Academies Press. doi: 10.17226/29143.
The column headers are as follows: State; 1; 2; 3; 4; 5; 6; 7; 8. The data given in the table rows is as follows: Row 1, C A: A, Use Leisch and L O S D for weaving; A; A; A; A; A; A; A. Row 2, F L: A; A; A; A; A; A; A; A. Row 3, S C: B; B; B; B; B; B; B; B. Row 4, C O: A; A; A; A; A; A; A; A. Row 5, S D: A; A; A; A; A; A; A; A. Row 6, N E: A, B; A, B; A, B; A, B; A, B; A, B; A, B; A, B. Row 7, N C: A; A; A; A; A; A; A; A. Row 8, O K: A; A; A; A; A; A; A; A. Row 9, M I: A; A; A; A; A; A; A; A. Row 10, O R: A, for v c computation; E, O D O T follower density; F; A, for v c computation; A, for v c computation; L T S; S I D R A; F. Row 11, D C: D; D; D; D; B; B; D; D. Row 12, K S: A; A; A; A; A; A; A; A. Row 13, W A: A; A; A; A; A; A; E; A. Row 14, O H: A; A; A; A; A; A; A; A. Row 15, A R: A; A; C; C; A; A; A; A. Row 16, W I: A; A; A; A, E; A; A; A, E (state-specific parameters, S I D R A); A. Row 17, G A: A; A; A; A; A; A; A, C; A. Row 18, N V: A, B; A, B; A, B, C; A, B, C; A, B, C; A, B, C; A, B, C; A, B. Row 19, I D: A; A; A; A; A; A; A; A. Row 20, N H: A, B; A, B; A, B; D; A, B; A, B; A, B; A, B. Row 21, W Y: A; A; A; A; A; A; A; A. Row 22, T N: A; A; A; A; A; A; A; A. Row 23, I A: A; A; A; A; A; A; A; A. Row 24, I L: A; A; A; A; A; A; A; A. Row 25, A K: C; C; C; C; C; C; C; C. Row 26, M S: A, B, C, D; A, B, C, D; A, B, C, D; A, B, C, D; A, B, C, D; A, B, C, D; A, B, C, D; A, B, C, D. Row 27, P A: E; E; A, E; A, E; A, E; A, E; A, E; A, E. Row 28, M O: B (not positive on version); B (not positive on version); B (not positive on version); B (not positive on version); B (not positive on version); B (not positive on version); B (not positive on version); B, C (not positive on version); B, C (not positive on version). Row 29, N D: A; A; A; A; A; A; A; A. Row 30, M E: B; B; B; B; B; B; B; B. Row 31, K Y: A; A; A; A; A; A; A (S I D R A) A. Row 32, V T: D; D; D,F; D; F; F; F; F. Row 33, A Z: A, B A, B A, B, E A, B A, B A, B A, B, E A, B, E. Row 34, I N: A, B; A, B; A, B; A, B, E; A, B; A, B; S I D R A (W A standards); A, B, E. Row 35, L A: blank; blank; blank; blank; blank; blank; blank; blank. Row 36, N Y: A; A; A; A; A; A; A; A. Row 37, M N: A; A; A; A; A; A; A; A. Row 38, U T: B, C, D asterisk; B, C, D asterisk; B, C, D asterisk; B, C, D asterisk; B, C, D asterisk; B, C, D asterisk; B, C, D asterisk; B, C, D asterisk. Row 39, N M: A; A; A; A; A; A; A; A. Row 40, T X: A, B; A, B; A, B; A, B; A, B; A, B; A, B; A, B. Row 41, V A: A; A; A; A; blank; blank; blank; blank.
Page 67
Suggested Citation: "Appendix B: Survey Responses." National Academies of Sciences, Engineering, and Medicine. 2025. Traffic Capacity Level of Service: Adaptations and Usage. Washington, DC: The National Academies Press. doi: 10.17226/29143.
The column headers are as follows: State; 1; 2; 3; 4; 5; 6; 7; 8. The data given in the table rows is as follows: Row 1, C A: A, Use Leisch and L O S D for weaving; A; A; A; A; A; A; A. Row 2, F L: A; A; A; A; A; A; A; A. Row 3, S C: B; B; B; B; B; B; B; B. Row 4, C O: A; A; A; A; A; A; A; A. Row 5, S D: A; A; A; A; A; A; A; A. Row 6, N E: A, B; A, B; A, B; A, B; A, B; A, B; A, B; A, B. Row 7, N C: A; A; A; A; A; A; A; A. Row 8, O K: A; A; A; A; A; A; A; A. Row 9, M I: A; A; A; A; A; A; A; A. Row 10, O R: A, for v c computation; E, O D O T follower density; F; A, for v c computation; A, for v c computation; L T S; S I D R A; F. Row 11, D C: D; D; D; D; B; B; D; D. Row 12, K S: A; A; A; A; A; A; A; A. Row 13, W A: A; A; A; A; A; A; E; A. Row 14, O H: A; A; A; A; A; A; A; A. Row 15, A R: A; A; C; C; A; A; A; A. Row 16, W I: A; A; A; A, E; A; A; A, E (state-specific parameters, S I D R A); A. Row 17, G A: A; A; A; A; A; A; A, C; A. Row 18, N V: A, B; A, B; A, B, C; A, B, C; A, B, C; A, B, C; A, B, C; A, B. Row 19, I D: A; A; A; A; A; A; A; A. Row 20, N H: A, B; A, B; A, B; D; A, B; A, B; A, B; A, B. Row 21, W Y: A; A; A; A; A; A; A; A. Row 22, T N: A; A; A; A; A; A; A; A. Row 23, I A: A; A; A; A; A; A; A; A. Row 24, I L: A; A; A; A; A; A; A; A. Row 25, A K: C; C; C; C; C; C; C; C. Row 26, M S: A, B, C, D; A, B, C, D; A, B, C, D; A, B, C, D; A, B, C, D; A, B, C, D; A, B, C, D; A, B, C, D. Row 27, P A: E; E; A, E; A, E; A, E; A, E; A, E; A, E. Row 28, M O: B (not positive on version); B (not positive on version); B (not positive on version); B (not positive on version); B (not positive on version); B (not positive on version); B (not positive on version); B, C (not positive on version); B, C (not positive on version). Row 29, N D: A; A; A; A; A; A; A; A. Row 30, M E: B; B; B; B; B; B; B; B. Row 31, K Y: A; A; A; A; A; A; A (S I D R A) A. Row 32, V T: D; D; D,F; D; F; F; F; F. Row 33, A Z: A, B A, B A, B, E A, B A, B A, B A, B, E A, B, E. Row 34, I N: A, B; A, B; A, B; A, B, E; A, B; A, B; S I D R A (W A standards); A, B, E. Row 35, L A: blank; blank; blank; blank; blank; blank; blank; blank. Row 36, N Y: A; A; A; A; A; A; A; A. Row 37, M N: A; A; A; A; A; A; A; A. Row 38, U T: B, C, D asterisk; B, C, D asterisk; B, C, D asterisk; B, C, D asterisk; B, C, D asterisk; B, C, D asterisk; B, C, D asterisk; B, C, D asterisk. Row 39, N M: A; A; A; A; A; A; A; A. Row 40, T X: A, B; A, B; A, B; A, B; A, B; A, B; A, B; A, B. Row 41, V A: A; A; A; A; blank; blank; blank; blank.
Page 68
Suggested Citation: "Appendix B: Survey Responses." National Academies of Sciences, Engineering, and Medicine. 2025. Traffic Capacity Level of Service: Adaptations and Usage. Washington, DC: The National Academies Press. doi: 10.17226/29143.
The column headers are as follows: State; 1, 2, 3, 4, 5, 6, 7, 8, 9, 10. The data given in the table rows are as follows: Row 1, C A: A; A; A; A; A; A; A; A; A; A. Row 2, F L: F, L T S; F, L T S; F, L T S; F, L T S; A F, L T S; F, L T S; F, L T S; F, L T S; F, L T S. Row 3, S C: F; F; F; F; F; F; F; F; F; F. Row 4, C O: A; A; A; A; A; A; A; A; A; A. Row 5, S D: A; A; A; A; A; A; A; A; A; A. Row 6, N E: A, B; A, B; A, B; A, B; A, B; A, B; A, B; A, B; A, B; A, B. Row 7, N C: Various indices; Various indices; Various indices; Various indices; Bus travel time; Various indices; Various indices; Various indices; Various indices; Various indices. Row 8, O K: F; F; F; F; F; F; F; F; F; F. Row 9, M I: F, Present or not present; F, Present or not present; F, Present or not present; F, Present or not present; F, Present or not present; F, Present or not present; F, Present or not present; F, Present or not present; F, Present or not present; F, Present or not present. Row 10, O R: L T S, or simplified H C M; L T S, or simplified H C M; L T S, or simplified H C M; L T S, or simplified H C M; simplified H C M; E; E; L T S; A; A. Row 11, D C: F; F; F; F; F; F; F; F; F; F. Row 12, K S: E; E; A; E; A; A; E; A; E; E. Row 13, W A: A; F; F; F; F; F; F; A; F; F. Row 14, O H: A; A; A; A; A; A; A; A; A; A. Row 15, A R: design standards; design standards; design standards; design standards; design standards; design standards; design standards; design standards; design standards; design standards. Row 16, W I: blank; blank; A; A; A; A; A; A; F; F. Row 17, G A: A; A; A; A; A; A; A; A; A; A. Row 17, N V: A, B, C; A, B, C; A, B, C; A, B, C; A, B, C; A, B, C; A, B, C; A, B, C; A, B, C; A, B, C; A, B, C. Row 18, I D: F; F; F; F; F A, F; F; F; F; F. Row 19, N H: F; F; F; F; F; F; F; F; F; F. Row 20, W Y: A; A; A; A; A; A; A; A; F; F. Row 21, T N: A; A; A; A; A; A; A; A; A; A. Row 22, I A: F; F; F; F; F; F; F; F; F; F. Row 23, I L: A; A; A; A; A; A; A; A; A; A. Row 24, A K: F; F; F; F; F; F; F; F; F; F. Row 25, M S: F; F; F; F; F; F; F; F; F. Row 26, P A: E; A, E; A, E; A, E; A, E; A, E; A, E; A, E; A, E; A, E. Row 27, M O: F; F; F; F; F; F; F; F; F; F. Row 28, N D: A; A; A; A; A; A; A; A; A; A. Row 29, M E: B; B; B; B; B; B; B; B; B; B. Row 30, K Y: F; F; F; A, F; F; A; F; F; F; F. Row 31, V T: D; F; D; F; F; D; D; F; F; F. Row 32: A Z: A, B; A, B, E; A, B, E; A, B, E; A, B, E; A, B; A, B, E; A, B, E; A, B, E; A, B, E. Row 33, I N: F; F; F; F; F; F; F; F; F; F. Row 34, L A: blank; blank; blank; blank; blank; blank; blank; blank; blank; blank. Row 35, N Y: A; A; A; A; F; A; A; A; F; F. Row 36, M N: A; A; A; A; A; A; A; A; A; A. Row 37, U T: B, C, D, F H W A bikeway selection guide; B, C, D; B, C, D; B, C, D; B, C, D; B, C, D; B, C, D; B, C, D; B, C, D; B, C, D. Row 38, N M: F; F; F; F; F; F; F; F; F; F. Row 39, T X: T x D O T R D M and AASHTO; T x D O T R D M and AASHTO; T x D O T R D M and AASHTO; T x D O T R D M and AASHTO; A, B; T x D O T R D M and AASHTO; T x D O Row 40, T R D M and AASHTO; T x D O T R D M and AASHTO; AASHTO; AASHTO. Row 41: V A: blank; blank; blank; blank; blank; blank; blank; blank; blank; blank.
Page 69
Suggested Citation: "Appendix B: Survey Responses." National Academies of Sciences, Engineering, and Medicine. 2025. Traffic Capacity Level of Service: Adaptations and Usage. Washington, DC: The National Academies Press. doi: 10.17226/29143.
The column headers are as follows: State; 1, 2, 3, 4, 5, 6, 7, 8, 9, 10. The data given in the table rows are as follows: Row 1, C A: A; A; A; A; A; A; A; A; A; A. Row 2, F L: F, L T S; F, L T S; F, L T S; F, L T S; A F, L T S; F, L T S; F, L T S; F, L T S; F, L T S. Row 3, S C: F; F; F; F; F; F; F; F; F; F. Row 4, C O: A; A; A; A; A; A; A; A; A; A. Row 5, S D: A; A; A; A; A; A; A; A; A; A. Row 6, N E: A, B; A, B; A, B; A, B; A, B; A, B; A, B; A, B; A, B; A, B. Row 7, N C: Various indices; Various indices; Various indices; Various indices; Bus travel time; Various indices; Various indices; Various indices; Various indices; Various indices. Row 8, O K: F; F; F; F; F; F; F; F; F; F. Row 9, M I: F, Present or not present; F, Present or not present; F, Present or not present; F, Present or not present; F, Present or not present; F, Present or not present; F, Present or not present; F, Present or not present; F, Present or not present; F, Present or not present. Row 10, O R: L T S, or simplified H C M; L T S, or simplified H C M; L T S, or simplified H C M; L T S, or simplified H C M; simplified H C M; E; E; L T S; A; A. Row 11, D C: F; F; F; F; F; F; F; F; F; F. Row 12, K S: E; E; A; E; A; A; E; A; E; E. Row 13, W A: A; F; F; F; F; F; F; A; F; F. Row 14, O H: A; A; A; A; A; A; A; A; A; A. Row 15, A R: design standards; design standards; design standards; design standards; design standards; design standards; design standards; design standards; design standards; design standards. Row 16, W I: blank; blank; A; A; A; A; A; A; F; F. Row 17, G A: A; A; A; A; A; A; A; A; A; A. Row 17, N V: A, B, C; A, B, C; A, B, C; A, B, C; A, B, C; A, B, C; A, B, C; A, B, C; A, B, C; A, B, C; A, B, C. Row 18, I D: F; F; F; F; F A, F; F; F; F; F. Row 19, N H: F; F; F; F; F; F; F; F; F; F. Row 20, W Y: A; A; A; A; A; A; A; A; F; F. Row 21, T N: A; A; A; A; A; A; A; A; A; A. Row 22, I A: F; F; F; F; F; F; F; F; F; F. Row 23, I L: A; A; A; A; A; A; A; A; A; A. Row 24, A K: F; F; F; F; F; F; F; F; F; F. Row 25, M S: F; F; F; F; F; F; F; F; F. Row 26, P A: E; A, E; A, E; A, E; A, E; A, E; A, E; A, E; A, E; A, E. Row 27, M O: F; F; F; F; F; F; F; F; F; F. Row 28, N D: A; A; A; A; A; A; A; A; A; A. Row 29, M E: B; B; B; B; B; B; B; B; B; B. Row 30, K Y: F; F; F; A, F; F; A; F; F; F; F. Row 31, V T: D; F; D; F; F; D; D; F; F; F. Row 32: A Z: A, B; A, B, E; A, B, E; A, B, E; A, B, E; A, B; A, B, E; A, B, E; A, B, E; A, B, E. Row 33, I N: F; F; F; F; F; F; F; F; F; F. Row 34, L A: blank; blank; blank; blank; blank; blank; blank; blank; blank; blank. Row 35, N Y: A; A; A; A; F; A; A; A; F; F. Row 36, M N: A; A; A; A; A; A; A; A; A; A. Row 37, U T: B, C, D, F H W A bikeway selection guide; B, C, D; B, C, D; B, C, D; B, C, D; B, C, D; B, C, D; B, C, D; B, C, D; B, C, D. Row 38, N M: F; F; F; F; F; F; F; F; F; F. Row 39, T X: T x D O T R D M and AASHTO; T x D O T R D M and AASHTO; T x D O T R D M and AASHTO; T x D O T R D M and AASHTO; A, B; T x D O T R D M and AASHTO; T x D O Row 40, T R D M and AASHTO; T x D O T R D M and AASHTO; AASHTO; AASHTO. Row 41: V A: blank; blank; blank; blank; blank; blank; blank; blank; blank; blank.
Page 70
Suggested Citation: "Appendix B: Survey Responses." National Academies of Sciences, Engineering, and Medicine. 2025. Traffic Capacity Level of Service: Adaptations and Usage. Washington, DC: The National Academies Press. doi: 10.17226/29143.
The column headers are as follows: Facility or mode; Different L O S thresholds; Different capacity values; Different service measures; Developed extensions to the H C M methodologies; Please, describe below any other modifications that your D O T has adopted. The data given in the table row is as follows: Row 1, Freeway and multilane highways: Motorized vehicle: blank; blank; blank; blank; P A: state-specific calibration factors. Bicycle: O R; blank; K S; blank; OR: Use of L O S ranges, simplified variables; P A: state specific calibration factors. Row 2, Two-lane highways: Motorized vehicle: O R; blank; blank; blank; P A: state-specific calibration factors. Bicycle: A Z; A Z; K S; blank; O R: Use of L O S ranges, simplified variables P A: state-specific calibration factors. Row 3, Urban street facilities and segments: Motorized vehicle: A Z; A Z; blank; blank; P A: state-specific calibration factors. Pedestrian: A Z; A Z; blank; blank; O R: Use of L O S ranges, simplified variables P A: state-specific calibration factors. Bicycle: A Z; A Z; K S; O R; O R: Use of L O S ranges, simplified variables P A: state-specific calibration factors. Transit: O R, A Z; A Z; blank; blank; O R: simplified variables P A: state-specific calibration factors. Row 4, Signalized intersections: Motorized vehicle: blank; blank; blank; I N; W I: WI-specific guidance for use of saturation flow Rates and R T O R P A: state-specific calibration factors. Pedestrian: O R; blank; blank; blank; P A: state-specific calibration factors O R: Index-based methodology. Bicycle: A Z; AZ; KS; blank; P A: state-specific calibration factors O R: Index-based methodology. Row 5, Two-way stop-controlled intersections: Motorized vehicle: blank; blank; blank; blank; P A: state-specific calibration factors. Pedestrian: A Z; A Z; A Z; blank; P A: state-specific calibration factors. Row 6, All-way stop-controlled intersections: Motorized vehicle: blank; blank; blank; blank; P A: state-specific calibration factors. Row 7, Roundabouts: Motorized vehicle: A Z; A Z; K S, A Z; O R, W A; P A: state-specific calibration factors W A: S I D R A; W I: W I specific critical & follow-up headway parameters, use the S I D R A expanded methodology to deal with 3- lane roundabout approaches. Row 8, Ramp terminals and alternative intersections: Motorized vehicle: A Z; A Z; blank; I N; P A: state-specific calibration factors. Row 9, Off-street pedestrian and bicycle facilities: Pedestrian: A Z; A Z; D C; blank; P A: state-specific calibration factors. Bicycle: A Z; A Z; D C; blank; P A: state-specific calibration factors.
Page 71
Suggested Citation: "Appendix B: Survey Responses." National Academies of Sciences, Engineering, and Medicine. 2025. Traffic Capacity Level of Service: Adaptations and Usage. Washington, DC: The National Academies Press. doi: 10.17226/29143.
The data given in the table rows is as follows: C A: H C M methodology is not accurate, Other (please, describe): That is the reason Leisch and L O S D methods are still being used. For sure, they perform better than the H C M’s weaving analysis methods. F L: Other (please, describe): We do not use the H C M L O S for multimodal analysis as it is too complex. S C: Other (please, describe): It was indicated that the H C M L O S framework is not used for non-motorized activities. From my limited knowledge on those activities, my understanding is that there is not currently a need for any form of L O S assessments to take place, as the state is very motorized vehicle heavy. N C: The H C M L O S framework does not capture users’ perception of quality of service. O K: Other (please, describe): We are unsure how to evaluate bicycles and peds using H C M methodology. M I: H C M methodology is too complex, Other (please, describe): Not looking for L O S for peds, transit, or bikes. O R: Other (please, describe): LOS has no top end, once L O S F is reached, more volume is still L O S F, but actual capacity (or demand) may be quite different. L O S can be manipulated much more than v c, which is a concern for development review. D C: H C M methodology is too complex. W A: H C M methodology is not accurate. A R: H C M methodology is too complex. W I: Other (please, describe): We use the H C M methodology for most vehicular traffic analysis. For Ped, bike, or transit, we look at H C M along with other methodologies. I D: Other (please, describe): Have not utilize H C M L O S to capture bike or ped since we’re still a fairly rural state where bike or ped concentration are only in a few metro areas. Evaluation for bike lane, walkway, or share use path is typically determined by the local agency in these metro areas. Local agencies typically establish these ped or bike plans. N H: Other (please, describe): We only analyze motor vehicle scenarios. W Y: Other (please, describe): Sometimes other factors at play, such as perceived Safety improvements. W Y: Other (please, describe): Sometimes other factors at play, such as perceived Safety improvements. I A: Other (please, describe): Multimodal analysis is not regularly completed. A K: Other (please, describe): Our manuals exclude non-motorized & transit L O S design analysis; minimal congestion issues. M S: Other (please, describe): We target a L O S C or better for rural roads and L O S D or better for urban. M O: Other (please, describe): I’m not aware of M o D O T using H C M L O S for bicycles or pedestrians. K Y: Other (please, describe): Some modes are not analyzed, or data does not exist. V T: Other (please, describe): not listed in L O S policy. I N: H C M methodology is too complex. The H C M L O S framework does not capture users’ perception of quality of service. U T: H C M methodology is not accurate, Other (please, describe): The reduced P C E is not accurate for Utah. We also require all traffic analyses involving interchanges to be modeled via V I S S I M, and those results are compared to the H C M L O S tables, so we don’t strictly follow the H C M methodology in calculating results by hand. N M: Other (please, describe): Pedestrian and bike methodology is new and not yet implemented in New Mexico. T X: Other (please, describe): For Ped and Bike, T x D O T R D M and AASHTO provide better design guidance. V A: Where H C M is not used, other appropriate context-sensitive M O Es are used with sensitivity to consistency and transparence.
Page 72
Suggested Citation: "Appendix B: Survey Responses." National Academies of Sciences, Engineering, and Medicine. 2025. Traffic Capacity Level of Service: Adaptations and Usage. Washington, DC: The National Academies Press. doi: 10.17226/29143.
The data given in the table rows is as follows: C A: H C M methodology is not accurate, Other (please, describe): That is the reason Leisch and L O S D methods are still being used. For sure, they perform better than the H C M’s weaving analysis methods. F L: Other (please, describe): We do not use the H C M L O S for multimodal analysis as it is too complex. S C: Other (please, describe): It was indicated that the H C M L O S framework is not used for non-motorized activities. From my limited knowledge on those activities, my understanding is that there is not currently a need for any form of L O S assessments to take place, as the state is very motorized vehicle heavy. N C: The H C M L O S framework does not capture users’ perception of quality of service. O K: Other (please, describe): We are unsure how to evaluate bicycles and peds using H C M methodology. M I: H C M methodology is too complex, Other (please, describe): Not looking for L O S for peds, transit, or bikes. O R: Other (please, describe): LOS has no top end, once L O S F is reached, more volume is still L O S F, but actual capacity (or demand) may be quite different. L O S can be manipulated much more than v c, which is a concern for development review. D C: H C M methodology is too complex. W A: H C M methodology is not accurate. A R: H C M methodology is too complex. W I: Other (please, describe): We use the H C M methodology for most vehicular traffic analysis. For Ped, bike, or transit, we look at H C M along with other methodologies. I D: Other (please, describe): Have not utilize H C M L O S to capture bike or ped since we’re still a fairly rural state where bike or ped concentration are only in a few metro areas. Evaluation for bike lane, walkway, or share use path is typically determined by the local agency in these metro areas. Local agencies typically establish these ped or bike plans. N H: Other (please, describe): We only analyze motor vehicle scenarios. W Y: Other (please, describe): Sometimes other factors at play, such as perceived Safety improvements. W Y: Other (please, describe): Sometimes other factors at play, such as perceived Safety improvements. I A: Other (please, describe): Multimodal analysis is not regularly completed. A K: Other (please, describe): Our manuals exclude non-motorized & transit L O S design analysis; minimal congestion issues. M S: Other (please, describe): We target a L O S C or better for rural roads and L O S D or better for urban. M O: Other (please, describe): I’m not aware of M o D O T using H C M L O S for bicycles or pedestrians. K Y: Other (please, describe): Some modes are not analyzed, or data does not exist. V T: Other (please, describe): not listed in L O S policy. I N: H C M methodology is too complex. The H C M L O S framework does not capture users’ perception of quality of service. U T: H C M methodology is not accurate, Other (please, describe): The reduced P C E is not accurate for Utah. We also require all traffic analyses involving interchanges to be modeled via V I S S I M, and those results are compared to the H C M L O S tables, so we don’t strictly follow the H C M methodology in calculating results by hand. N M: Other (please, describe): Pedestrian and bike methodology is new and not yet implemented in New Mexico. T X: Other (please, describe): For Ped and Bike, T x D O T R D M and AASHTO provide better design guidance. V A: Where H C M is not used, other appropriate context-sensitive M O Es are used with sensitivity to consistency and transparence.
Page 73
Suggested Citation: "Appendix B: Survey Responses." National Academies of Sciences, Engineering, and Medicine. 2025. Traffic Capacity Level of Service: Adaptations and Usage. Washington, DC: The National Academies Press. doi: 10.17226/29143.
The column headers are as follows: State 1; 2; 3; 4; 5; 6; 7; 8; 9. The data given in the table rows are as follows: C A: Peak hour; Peak hour; Peak hour; Peak hour; Peak hour; Peak hour; Peak hour; Peak hour; Peak hour. F L: A A D T; Peak hour; Peak hour; Peak hour; A A D T; Peak hour; A A D T; Peak hour; Peak hour. S C: A A D T; A A D T; Peak hour; Peak hour; A A D T; Peak hour; A A D T A A D T; Peak hour. CO: Default 15-minute period; Default 15-minute period; Default 15-minute period; Default 15-minute period; Default 15-minute period; Default 15-minute period; Default 15-minute period; Default 15-minute period; Default 15-minute period. S D: Peak hour; Peak hour; Peak hour; A D T; Peak hour; Peak hour; None; A A D T; A A D T. N E: A A D T; Peak hour; Peak hour; Peak hour; Peak hour; Peak hour; Peak hour; A A D T; A A D T. N C: Peak hour; Peak hour; Peak hour; Peak hour; Peak hour; Peak hour; Peak hour; Peak hour; Peak hour. O K: A A D T; Peak hour; Peak hour; A A D T; Peak hour; Peak hour; None; None; None. M I: A A D T; Peak hour; Default 15 minute period; Peak hour; Peak hour; Peak hour; None; A A D T; A A D T. O R: mix of peak hour or 15 min period, but only for determination of v c (L O S is extra info only) A D T; None; None. D C: Peak hour; Peak hour; Peak hour; Peak hour; Peak hour; Peak hour; Peak hour; Peak hour; Peak hour. K S: A D T; Peak hour; A D T; Peak hour; Peak hour; Peak hour; A D T; Peak hour; Peak hour. W A: Peak hour; Peak hour; Peak hour; Peak hour; Peak hour; Peak hour; other (please, describe below) Peak hour Peak hour. O H: A A D T; Peak hour; Peak hour; Peak hour; Peak hour; Peak hour; Peak hour; Peak hour; Peak hour. A R: A A D T; Default 15-minute period; Default 15-minute period; Default 15-minute period; Default 15-minute period; Default 15-minute period. A A D T; A A D T; Default 15-minute period. W I: K 30, K 250, and sometimes K 100 design hour volumes. Peak hour; Peak hour; Peak hour; Default 15-minute period; Default 15-minute period; None; Peak hour; Peak hour. G A: A A D T; A A D T; Peak hour; A A D T; Peak hour; Peak hour; A A D T; Peak hour; Peak hour. N V: A A D T; A A D T; Peak hour; Peak hour; Default 15-minute period; Default 15-minute period; Peak hour; Peak hour; Peak hour. I D: Peak hour; Peak hour; Peak hour; Peak hour; Peak hour; Peak hour; Peak hour; Peak hour; Peak hour. N H: None; Peak hour; Peak hour; Peak hour; Peak hour; Peak hour; None; None; None. W Y: A A D T; A A D T; A A D T; A A D T; A A D T; Peak hour; A A D T; A A D T; None. T N: A A D T; Peak hour; Peak hour; Peak hour; Peak hour; Peak hour; Peak hour; Peak hour; Peak hour. I A: A D T; Peak hour; Peak hour; Peak hour; Peak hour; Peak hour; None; None; None. I L: Peak hour; Peak hour; Peak hour; A A D T; Peak hour; A A D T; Peak hour; Peak hour; Peak hour. A K: Unknown; Peak hour; Peak hour; Peak hour; Peak hour; Peak hour; None; None; None. M S: A A D T; Peak hour; Peak hour; Peak hour; Peak hour; Peak hour; None; A A D T; Peak hour. P A: None; Peak hour; Peak hour; Peak hour; Peak hour; Peak hour; Peak hour; None; None. M O: A D T; Peak hour; Peak hour; Peak hour; Peak hour; Peak hour; A D T; Peak hour; Peak hour. N D: None; Peak hour; Peak hour; Peak hour; Peak hour; Peak hour; Peak hour; None; None. M E: Peak hour; Peak hour; Peak hour; Peak hour; Peak hour; Peak hour; Peak hour; Peak hour; Peak hour. K Y: None; Peak hour; Peak hour; Peak hour; Peak hour; A D T; None; Peak hour; Use 5-minute speed data from W A Z E. V T: A A D T; A A D T; A A D T; A A D T; A A D T; A A D T; A A D T; A A D T; A A D T. A Z: A A D T; A A D T; A A D T; A D T; Peak hour; Peak hour; A A D T; Peak hour; A D T. I N: A A D T; Peak hour; Peak hour; A A D T; Peak hour; Peak hour; Peak hour; Peak hour; Peak hour. L A: blank; blank; blank; blank; blank; blank; blank; blank; blank. N Y: None; Peak hour; Peak hour; Peak hour; Peak hour; Peak hour; Peak hour; Peak hour; Peak hour. M N: A A D T; A A D T; A M and P M; Peak hour; A A D T; A M and P M Peak hour: A M and P M Peak hour: A M and PM Peak hour; None; None. U T: Peak hour; Default 15-minute period; Default 15-minute period; Default 15-minute period; Default 15-minute period; Default 15-minute period; Default 15-minute period; Default 15-minute period; Default 15-minute period. N M: Peak hour; Default 15-minute period; Default 15-minute period; Default 15-minute period; Default 15-minute period; Default 15-minute period; None; None; None. T X: A A D T; Peak hour; Peak hour; Peak hour; Peak hour; Peak hour; Peak hour; A D T; A D T. V A; blank; Peak hour; blank; blank; Peak hour; Peak hour; blank; Peak hour; Peak hour.
Page 74
Suggested Citation: "Appendix B: Survey Responses." National Academies of Sciences, Engineering, and Medicine. 2025. Traffic Capacity Level of Service: Adaptations and Usage. Washington, DC: The National Academies Press. doi: 10.17226/29143.
The column headers are as follows: State 1; 2; 3; 4; 5; 6; 7; 8; 9. The data given in the table rows are as follows: C A: Peak hour; Peak hour; Peak hour; Peak hour; Peak hour; Peak hour; Peak hour; Peak hour; Peak hour. F L: A A D T; Peak hour; Peak hour; Peak hour; A A D T; Peak hour; A A D T; Peak hour; Peak hour. S C: A A D T; A A D T; Peak hour; Peak hour; A A D T; Peak hour; A A D T A A D T; Peak hour. CO: Default 15-minute period; Default 15-minute period; Default 15-minute period; Default 15-minute period; Default 15-minute period; Default 15-minute period; Default 15-minute period; Default 15-minute period; Default 15-minute period. S D: Peak hour; Peak hour; Peak hour; A D T; Peak hour; Peak hour; None; A A D T; A A D T. N E: A A D T; Peak hour; Peak hour; Peak hour; Peak hour; Peak hour; Peak hour; A A D T; A A D T. N C: Peak hour; Peak hour; Peak hour; Peak hour; Peak hour; Peak hour; Peak hour; Peak hour; Peak hour. O K: A A D T; Peak hour; Peak hour; A A D T; Peak hour; Peak hour; None; None; None. M I: A A D T; Peak hour; Default 15 minute period; Peak hour; Peak hour; Peak hour; None; A A D T; A A D T. O R: mix of peak hour or 15 min period, but only for determination of v c (L O S is extra info only) A D T; None; None. D C: Peak hour; Peak hour; Peak hour; Peak hour; Peak hour; Peak hour; Peak hour; Peak hour; Peak hour. K S: A D T; Peak hour; A D T; Peak hour; Peak hour; Peak hour; A D T; Peak hour; Peak hour. W A: Peak hour; Peak hour; Peak hour; Peak hour; Peak hour; Peak hour; other (please, describe below) Peak hour Peak hour. O H: A A D T; Peak hour; Peak hour; Peak hour; Peak hour; Peak hour; Peak hour; Peak hour; Peak hour. A R: A A D T; Default 15-minute period; Default 15-minute period; Default 15-minute period; Default 15-minute period; Default 15-minute period. A A D T; A A D T; Default 15-minute period. W I: K 30, K 250, and sometimes K 100 design hour volumes. Peak hour; Peak hour; Peak hour; Default 15-minute period; Default 15-minute period; None; Peak hour; Peak hour. G A: A A D T; A A D T; Peak hour; A A D T; Peak hour; Peak hour; A A D T; Peak hour; Peak hour. N V: A A D T; A A D T; Peak hour; Peak hour; Default 15-minute period; Default 15-minute period; Peak hour; Peak hour; Peak hour. I D: Peak hour; Peak hour; Peak hour; Peak hour; Peak hour; Peak hour; Peak hour; Peak hour; Peak hour. N H: None; Peak hour; Peak hour; Peak hour; Peak hour; Peak hour; None; None; None. W Y: A A D T; A A D T; A A D T; A A D T; A A D T; Peak hour; A A D T; A A D T; None. T N: A A D T; Peak hour; Peak hour; Peak hour; Peak hour; Peak hour; Peak hour; Peak hour; Peak hour. I A: A D T; Peak hour; Peak hour; Peak hour; Peak hour; Peak hour; None; None; None. I L: Peak hour; Peak hour; Peak hour; A A D T; Peak hour; A A D T; Peak hour; Peak hour; Peak hour. A K: Unknown; Peak hour; Peak hour; Peak hour; Peak hour; Peak hour; None; None; None. M S: A A D T; Peak hour; Peak hour; Peak hour; Peak hour; Peak hour; None; A A D T; Peak hour. P A: None; Peak hour; Peak hour; Peak hour; Peak hour; Peak hour; Peak hour; None; None. M O: A D T; Peak hour; Peak hour; Peak hour; Peak hour; Peak hour; A D T; Peak hour; Peak hour. N D: None; Peak hour; Peak hour; Peak hour; Peak hour; Peak hour; Peak hour; None; None. M E: Peak hour; Peak hour; Peak hour; Peak hour; Peak hour; Peak hour; Peak hour; Peak hour; Peak hour. K Y: None; Peak hour; Peak hour; Peak hour; Peak hour; A D T; None; Peak hour; Use 5-minute speed data from W A Z E. V T: A A D T; A A D T; A A D T; A A D T; A A D T; A A D T; A A D T; A A D T; A A D T. A Z: A A D T; A A D T; A A D T; A D T; Peak hour; Peak hour; A A D T; Peak hour; A D T. I N: A A D T; Peak hour; Peak hour; A A D T; Peak hour; Peak hour; Peak hour; Peak hour; Peak hour. L A: blank; blank; blank; blank; blank; blank; blank; blank; blank. N Y: None; Peak hour; Peak hour; Peak hour; Peak hour; Peak hour; Peak hour; Peak hour; Peak hour. M N: A A D T; A A D T; A M and P M; Peak hour; A A D T; A M and P M Peak hour: A M and P M Peak hour: A M and PM Peak hour; None; None. U T: Peak hour; Default 15-minute period; Default 15-minute period; Default 15-minute period; Default 15-minute period; Default 15-minute period; Default 15-minute period; Default 15-minute period; Default 15-minute period. N M: Peak hour; Default 15-minute period; Default 15-minute period; Default 15-minute period; Default 15-minute period; Default 15-minute period; None; None; None. T X: A A D T; Peak hour; Peak hour; Peak hour; Peak hour; Peak hour; Peak hour; A D T; A D T. V A; blank; Peak hour; blank; blank; Peak hour; Peak hour; blank; Peak hour; Peak hour.
Page 75
Suggested Citation: "Appendix B: Survey Responses." National Academies of Sciences, Engineering, and Medicine. 2025. Traffic Capacity Level of Service: Adaptations and Usage. Washington, DC: The National Academies Press. doi: 10.17226/29143.
The two column headers are as follows: Service measures; State. The data given in the table rows are as follows: Row 1: L O S F is defined based on the demand-to-capacity ratio (d c) and an H C M-specified service measure (or combination of service measures). Severity of congestion is not considered; F L, C O, S D, N E, O R, A R, N V, I D, W Y, I A, I L, A K, M O, N D, M E, V T, A Z, U T. Row 2: In addition to the H C M L O S F definitions, the severity of congestion is considered through: Temporal duration of L O S F; C A, S C, O K, M I, W A, O H, W I, G A, N H, I N, N Y, M N, N M. Row 3: In addition to the H C M L O S F definitions, the severity of congestion is considered through: Spatial extent of congestion (example, back of queue measurements); S C, N C, O K, M I, D C, O H, W I, G A, T N, K Y, I N, N Y, M N, N M. Row 4: In addition to the HCM LOS F definitions, the severity of congestion is considered through: Amount of excess of demand-to-capacity ratio over 1.0; O K, D C, G A, N H, T N, M S, P A, I N, M N. Row 5: Other: control delay for intersections; P A. Row 6: Other: change in travel time and speed; T X.
Page 76
Suggested Citation: "Appendix B: Survey Responses." National Academies of Sciences, Engineering, and Medicine. 2025. Traffic Capacity Level of Service: Adaptations and Usage. Washington, DC: The National Academies Press. doi: 10.17226/29143.
The column headers are as follows: 1; 2; 3; 4; 5; 6; 7; 8; 9. The data given in the table rows are as follows: Row 1: C A: A, C, D, F; C; C, D; C, F; C; C; C; C, D; C. Row 2: F L: A, B, C, D; A, B, C, D; A, B, C, D; A, B, C, D; A, B; A, B; A, B, C, D; A, B, C, D; A, L T S. V: S C: C, D; C, D; C, D; C, D; C, D; C, D; C; C, D; A. Row 4:C O: A, B, C, D, F; A, B, C, D, F; A, B, C, D, F; A, B, C, D, F, G; A, B, C, D, F; A, B, C, D, F; A, B, C, D; A, B, C, D; A, B. Row 5: S D: C; C; C, D; C, D; C; C; C, D; C; A. Row 6: N E: C; C; C; C; C; C; C; C; C. Row 7: N C: C, D; C, D; C, D; C, D; C, D; C, D; C, D; C, D; other methods. Row 8: O K: A, B, C, D, F; C, D; C, D; C, D, F, G; C, D C, D C, D C, D none. Row 9: M I: C; C, F; D; C; A, C; A, C; D; C, D; A. Row 10: O R: C; B, home-built tools or spreadsheets; C; C; C; C; C; C; A, B, modified H C M equations, home-built tools or spreadsheets. Row 11: D C: C, D, F; C, D, F; C, D, F; C; C; C; C; D, F; A, C. Row 12: K S: B, D, E, F; A, B; B, C, D, E, F, G; B, C, D, E, G; B, C, D; B, C, D; C, D; B, C, D; A, B, D. Row 13: W A: A, C; A, C; A; A, C; A, C; A, C; v per; c A, C; Ped L T S. Row 14: O H: C, D; C, D; C, D; C, D; C, D; C, D; C, D; C, D; none. Row 15: A R: A, B, C, D, E, F: A, B, C; A, B, C, D, E; A, B, C, D, E; A, B, C; A, B, C; A, B, C, D; A, B, C, D, E; Satisfaction of design standards. Row 16: W I: C, D, F; C D; B, C, G; B, C; B, C; C, D; unsure. Row 17: G A: C, F; C; C; C, G; C; C; A, C; C; C. Row 18: N V: B, C, D, E, F; B, C, D, E, F; B, C, F, G; B, C, F, G; B, C; B, C; B, C, D, F; B, C, D, F; B, C. Row 19: I D: C, D; C; C, D; C, D; C; C; C; C, D; not applicable. Row 20: N H: B, D; B; B; C; C; C; C; C, D; A. Row 21: W Y: C; C; C; C; C; C; C; C; C. Row 22: T N: A, B, C, D, E, F; A, B, C, E, F; B, C, D, E, F; B, C, D; B, C; B, C; B, C; B, C; B, C. Row 23: I A; B, C, D, E; B, C; B, C; B, C; B, C; B, C; B, C, D; B, C, D, E; not applicable. Row 24: I L: A, B, C, D, E, F; A; A, C, D; A, C; A; A; A, B, C, D; A, B, C, D, E, F; A. Row 25: A K: C; C; C; C, D; C; C; C, D; C; C. Row 26: M S: A, C, D; A, C, D; A, C, D; A, C, D; A, C, D; A, C, D; A, C, D; A, C, D; C, D. Row 27: P A: B; C; C; C, G; C; C; C; C; C. Row 28: M O: C, D, E, F; F; C, D, F; C, D, F; C, D, F; C, D, F; C, D, E, F; C, D, E, F; A. Row 29: N D: C; C; C; C; C; C; C; C; C. Row 30: M E: B; B; B; C; C; C; B; C; unsure. Row 31: K Y: A, C, D, E, F; A, C, D, F; A; C, G; A, C, D; A, C; A, C, D; A, C, D, E; A. Row 32: VT: A, B, F; A, B; A, B; A, B; A, B; A, B; A, B; A, B; A, B. Row 33: A Z: B, D, F; B, D; D, F; B, D, F; B, D, F; B, D, F; B, D, F; B, D; B, D, F. Row 34: I N: A, B, C, D, F; A, B, C, D, F; A, B, C, D, F; A, B, C, D, F; A, B, C, F; A, B, C, F; A, C, D, F; A, B, C, D, F; none. Row 35: L A: not applicable; not applicable; not applicable; not applicable; not applicable; not applicable; not applicable; not applicable; blank. Row 36: N Y: A, C, D, E, F; C, D, E, F; C, D, E, F; C, D, E, F; C, D, E, F; C, D, E, F; C, D, E, F; C, D, E, F; C, D, E, F. Row 37: M N: C, D; C, D; C, D; C, D; C, D; C, D; C, D; C, D; D. Row 38: U T: D, F; D, F, G; D, F, G; C, D, F, G; C, D, F; C, D, F; D, F; D, F; D Row 39: N M: A, C, D, F; A, C, F; A, C, D, F; A, C, D; A, C; A, C; A, C, D; A, C, D; none. Row 40: T X: C, D; C; C; C; C; C; C; C, D; A. Row 41: V A: not applicable; not applicable; not applicable; not applicable; not applicable; not applicable; not applicable; not applicable; blank. The data below the table reads as follows: A: Sketch planning. B: H C M or P P E A G computational engines. C: analytical tools. D: microsimulation. E: mesoscopic simulation. F: probe or connected vehicle data. F: A T S P M.
Page 77
Suggested Citation: "Appendix B: Survey Responses." National Academies of Sciences, Engineering, and Medicine. 2025. Traffic Capacity Level of Service: Adaptations and Usage. Washington, DC: The National Academies Press. doi: 10.17226/29143.
The column headers are as follows: 1; 2; 3; 4; 5; 6; 7; 8; 9. The data given in the table rows are as follows: Row 1: C A: A, C, D, F; C; C, D; C, F; C; C; C; C, D; C. Row 2: F L: A, B, C, D; A, B, C, D; A, B, C, D; A, B, C, D; A, B; A, B; A, B, C, D; A, B, C, D; A, L T S. V: S C: C, D; C, D; C, D; C, D; C, D; C, D; C; C, D; A. Row 4:C O: A, B, C, D, F; A, B, C, D, F; A, B, C, D, F; A, B, C, D, F, G; A, B, C, D, F; A, B, C, D, F; A, B, C, D; A, B, C, D; A, B. Row 5: S D: C; C; C, D; C, D; C; C; C, D; C; A. Row 6: N E: C; C; C; C; C; C; C; C; C. Row 7: N C: C, D; C, D; C, D; C, D; C, D; C, D; C, D; C, D; other methods. Row 8: O K: A, B, C, D, F; C, D; C, D; C, D, F, G; C, D C, D C, D C, D none. Row 9: M I: C; C, F; D; C; A, C; A, C; D; C, D; A. Row 10: O R: C; B, home-built tools or spreadsheets; C; C; C; C; C; C; A, B, modified H C M equations, home-built tools or spreadsheets. Row 11: D C: C, D, F; C, D, F; C, D, F; C; C; C; C; D, F; A, C. Row 12: K S: B, D, E, F; A, B; B, C, D, E, F, G; B, C, D, E, G; B, C, D; B, C, D; C, D; B, C, D; A, B, D. Row 13: W A: A, C; A, C; A; A, C; A, C; A, C; v per; c A, C; Ped L T S. Row 14: O H: C, D; C, D; C, D; C, D; C, D; C, D; C, D; C, D; none. Row 15: A R: A, B, C, D, E, F: A, B, C; A, B, C, D, E; A, B, C, D, E; A, B, C; A, B, C; A, B, C, D; A, B, C, D, E; Satisfaction of design standards. Row 16: W I: C, D, F; C D; B, C, G; B, C; B, C; C, D; unsure. Row 17: G A: C, F; C; C; C, G; C; C; A, C; C; C. Row 18: N V: B, C, D, E, F; B, C, D, E, F; B, C, F, G; B, C, F, G; B, C; B, C; B, C, D, F; B, C, D, F; B, C. Row 19: I D: C, D; C; C, D; C, D; C; C; C; C, D; not applicable. Row 20: N H: B, D; B; B; C; C; C; C; C, D; A. Row 21: W Y: C; C; C; C; C; C; C; C; C. Row 22: T N: A, B, C, D, E, F; A, B, C, E, F; B, C, D, E, F; B, C, D; B, C; B, C; B, C; B, C; B, C. Row 23: I A; B, C, D, E; B, C; B, C; B, C; B, C; B, C; B, C, D; B, C, D, E; not applicable. Row 24: I L: A, B, C, D, E, F; A; A, C, D; A, C; A; A; A, B, C, D; A, B, C, D, E, F; A. Row 25: A K: C; C; C; C, D; C; C; C, D; C; C. Row 26: M S: A, C, D; A, C, D; A, C, D; A, C, D; A, C, D; A, C, D; A, C, D; A, C, D; C, D. Row 27: P A: B; C; C; C, G; C; C; C; C; C. Row 28: M O: C, D, E, F; F; C, D, F; C, D, F; C, D, F; C, D, F; C, D, E, F; C, D, E, F; A. Row 29: N D: C; C; C; C; C; C; C; C; C. Row 30: M E: B; B; B; C; C; C; B; C; unsure. Row 31: K Y: A, C, D, E, F; A, C, D, F; A; C, G; A, C, D; A, C; A, C, D; A, C, D, E; A. Row 32: VT: A, B, F; A, B; A, B; A, B; A, B; A, B; A, B; A, B; A, B. Row 33: A Z: B, D, F; B, D; D, F; B, D, F; B, D, F; B, D, F; B, D, F; B, D; B, D, F. Row 34: I N: A, B, C, D, F; A, B, C, D, F; A, B, C, D, F; A, B, C, D, F; A, B, C, F; A, B, C, F; A, C, D, F; A, B, C, D, F; none. Row 35: L A: not applicable; not applicable; not applicable; not applicable; not applicable; not applicable; not applicable; not applicable; blank. Row 36: N Y: A, C, D, E, F; C, D, E, F; C, D, E, F; C, D, E, F; C, D, E, F; C, D, E, F; C, D, E, F; C, D, E, F; C, D, E, F. Row 37: M N: C, D; C, D; C, D; C, D; C, D; C, D; C, D; C, D; D. Row 38: U T: D, F; D, F, G; D, F, G; C, D, F, G; C, D, F; C, D, F; D, F; D, F; D Row 39: N M: A, C, D, F; A, C, F; A, C, D, F; A, C, D; A, C; A, C; A, C, D; A, C, D; none. Row 40: T X: C, D; C; C; C; C; C; C; C, D; A. Row 41: V A: not applicable; not applicable; not applicable; not applicable; not applicable; not applicable; not applicable; not applicable; blank. The data below the table reads as follows: A: Sketch planning. B: H C M or P P E A G computational engines. C: analytical tools. D: microsimulation. E: mesoscopic simulation. F: probe or connected vehicle data. F: A T S P M.
Page 78
Suggested Citation: "Appendix B: Survey Responses." National Academies of Sciences, Engineering, and Medicine. 2025. Traffic Capacity Level of Service: Adaptations and Usage. Washington, DC: The National Academies Press. doi: 10.17226/29143.
The column headers are as follows: State; 1; 2; 3; 4; 5; 6; 7; 8; 9. The data given in the table rows is as follows: C A: D; D; D; D; D; D; D; D; D. F L; C, D; C, D; C, D; C, D; C, D; C, D; C, D; C, D; A. S C: D; D; D; D; D; D; D; D; A. C O: C, D, F; A, C, F; A, C, D, F; A, C, D, F, G; A, C; A, C; A, C, D; D; A, D. S D: C; C; D; D; C; C; D; C; A. N E: C, D; C, D; C, D; C, D; C, D; C, D; C, D; C, D; C, D. N C: C, D; C, D; C, D; C, D; C, D; C, D; C, D; C, D; G I S tools. O K: A, C, D, F; A; A; A, C, F; A; A; A; A, D; A. M I: D; C; C; C; C; C; D; D; D. O R: travel demand model output -volumes, d c ratios, trip patterns; D, F; travel demand model output volumes, d per ratios, trip patterns; D; D; D; D; D; A. D C: A, C, D; A, C, D; A, C; A, C; A, C; A, C; A, C; A, C; A. K S: A, D, F; A, D, F; A, D, E, G; D, E, G; B, C, D, E; B, C, D, E; B, C, D; A, B, C, D, E, F; A, B, D. W A: D; D; D; not applicable; not applicable; not applicable; D; not applicable; not applicable. O H: C, D; C, D; C, D; C, D; C, D; C, D; C, D; C, D; none. A R: A, B, C, D, E, F; A, B, C; A, B, C, D, E; A, B, C, D, E; A, B, C; A, B, C; A, B, C, D; A, B, C, D, E; Stakeholder communication. W I: D; C; D; C; C; C; C; C, D; unsure. G A: C, D; C, D; C, D; C, D, G; C, D; C, D; C, D; C, D; C, D. N V: C, D, E, F; C, D; B, C, F, G; B, C, F, G; B, C; B, C; B, C, D, G; C; B, C, D. I D: unsure; unsure; unsure; unsure; unsure; unsure; unsure; unsure; unsure. N H: D; A; A; C; C; C; C; C, D; A. W Y: C; C; C; C; C; C; C; C; C. T N: A, D, F; A, F; A, F; A; A; A; A; A; A. I A: A, C, D, E, F; A, C, F; A, C, F; A, C, F; A, C, F; A, C, F; A, C, D, F; A, C, D, E, F; none. I L: A, D, E; A; A, D, E; A; A; A; A, B, C, D, E, F; A; A. A K: C; C; C; C, D; C; C; C, D; C; C. M S: C, D; C, D; C, D; C, D; C, D; C, D; C, D; C, D; C, D. P A: B, C, F; C; C; C, G; C; C; C; C; C. M O: D; F; D; D; D; D; D; D; A. N D: C; C; C; C; C; C; C; C; C. M E: C, F; C, F; C, F; C; C; C; C. K Y: A, D; A, D; A, D; A, C, D, G; A; A; A, D; A, D; A. V T: not applicable; not applicable; not applicable; not applicable; not applicable; not applicable; not applicable; not applicable. A Z: D; B, D, E; B, D, F; A, D; A, F; A, F; A, D, E, F; A, B, D, E, F; A, B, C, F. I N: A, B, C, D, F; A, B, C, D, F; A, B, C, D, F; A, B, C, D, F; A, B, C, F; A, B, C, F; A, C, D, F; A, B, C, D, F; none. L A: not applicable; not applicable; not applicable; not applicable; not applicable; not applicable; not applicable; not applicable; not applicable. N Y: D, E; C, D; C, D; C, D; C, D; C; C, D; C, D; D. M N: D; D; D; C,D; C,D; C,D; C,D; D; D. U T: D, F; D, F; D, F; D, F; D, F; D, F; D, F; D, F; D, F. N M: D, F; C; C, D, F; C; C; C; C; C, D, F; none. T X: C, D; C; C; C; C; C, D; C, D; A. V A: D; D; D; C, D; D; D; C, D; D; not applicable. The data below the table reads the following: A: Sketch planning. B: H C M or P P E A G computational engines. C: analytical tools. D: microsimulation. E: mesoscopic simulation. F: probe or connected vehicle data. F: A T S P M.
Page 79
Suggested Citation: "Appendix B: Survey Responses." National Academies of Sciences, Engineering, and Medicine. 2025. Traffic Capacity Level of Service: Adaptations and Usage. Washington, DC: The National Academies Press. doi: 10.17226/29143.
The column headers are as follows: State; 1; 2; 3; 4; 5; 6; 7; 8; 9. The data given in the table rows is as follows: C A: D; D; D; D; D; D; D; D; D. F L; C, D; C, D; C, D; C, D; C, D; C, D; C, D; C, D; A. S C: D; D; D; D; D; D; D; D; A. C O: C, D, F; A, C, F; A, C, D, F; A, C, D, F, G; A, C; A, C; A, C, D; D; A, D. S D: C; C; D; D; C; C; D; C; A. N E: C, D; C, D; C, D; C, D; C, D; C, D; C, D; C, D; C, D. N C: C, D; C, D; C, D; C, D; C, D; C, D; C, D; C, D; G I S tools. O K: A, C, D, F; A; A; A, C, F; A; A; A; A, D; A. M I: D; C; C; C; C; C; D; D; D. O R: travel demand model output -volumes, d c ratios, trip patterns; D, F; travel demand model output volumes, d per ratios, trip patterns; D; D; D; D; D; A. D C: A, C, D; A, C, D; A, C; A, C; A, C; A, C; A, C; A, C; A. K S: A, D, F; A, D, F; A, D, E, G; D, E, G; B, C, D, E; B, C, D, E; B, C, D; A, B, C, D, E, F; A, B, D. W A: D; D; D; not applicable; not applicable; not applicable; D; not applicable; not applicable. O H: C, D; C, D; C, D; C, D; C, D; C, D; C, D; C, D; none. A R: A, B, C, D, E, F; A, B, C; A, B, C, D, E; A, B, C, D, E; A, B, C; A, B, C; A, B, C, D; A, B, C, D, E; Stakeholder communication. W I: D; C; D; C; C; C; C; C, D; unsure. G A: C, D; C, D; C, D; C, D, G; C, D; C, D; C, D; C, D; C, D. N V: C, D, E, F; C, D; B, C, F, G; B, C, F, G; B, C; B, C; B, C, D, G; C; B, C, D. I D: unsure; unsure; unsure; unsure; unsure; unsure; unsure; unsure; unsure. N H: D; A; A; C; C; C; C; C, D; A. W Y: C; C; C; C; C; C; C; C; C. T N: A, D, F; A, F; A, F; A; A; A; A; A; A. I A: A, C, D, E, F; A, C, F; A, C, F; A, C, F; A, C, F; A, C, F; A, C, D, F; A, C, D, E, F; none. I L: A, D, E; A; A, D, E; A; A; A; A, B, C, D, E, F; A; A. A K: C; C; C; C, D; C; C; C, D; C; C. M S: C, D; C, D; C, D; C, D; C, D; C, D; C, D; C, D; C, D. P A: B, C, F; C; C; C, G; C; C; C; C; C. M O: D; F; D; D; D; D; D; D; A. N D: C; C; C; C; C; C; C; C; C. M E: C, F; C, F; C, F; C; C; C; C. K Y: A, D; A, D; A, D; A, C, D, G; A; A; A, D; A, D; A. V T: not applicable; not applicable; not applicable; not applicable; not applicable; not applicable; not applicable; not applicable. A Z: D; B, D, E; B, D, F; A, D; A, F; A, F; A, D, E, F; A, B, D, E, F; A, B, C, F. I N: A, B, C, D, F; A, B, C, D, F; A, B, C, D, F; A, B, C, D, F; A, B, C, F; A, B, C, F; A, C, D, F; A, B, C, D, F; none. L A: not applicable; not applicable; not applicable; not applicable; not applicable; not applicable; not applicable; not applicable; not applicable. N Y: D, E; C, D; C, D; C, D; C, D; C; C, D; C, D; D. M N: D; D; D; C,D; C,D; C,D; C,D; D; D. U T: D, F; D, F; D, F; D, F; D, F; D, F; D, F; D, F; D, F. N M: D, F; C; C, D, F; C; C; C; C; C, D, F; none. T X: C, D; C; C; C; C; C, D; C, D; A. V A: D; D; D; C, D; D; D; C, D; D; not applicable. The data below the table reads the following: A: Sketch planning. B: H C M or P P E A G computational engines. C: analytical tools. D: microsimulation. E: mesoscopic simulation. F: probe or connected vehicle data. F: A T S P M.
Page 80
Suggested Citation: "Appendix B: Survey Responses." National Academies of Sciences, Engineering, and Medicine. 2025. Traffic Capacity Level of Service: Adaptations and Usage. Washington, DC: The National Academies Press. doi: 10.17226/29143.
The column headers are as follows: State, Urban facilities; Rural facilities. The data given in the rows are as follows: C A; A, B, C, D; A, B, C, D. F L: A, B, C, D; A, B, C, D. S C: A; A. C O: A, B, C; A, B, C. S D: A, D; A. N E: A, B, C, D; A. N C: A, B, D; A, B, D. OK: A, B, C; A, B, C. M I: A, B, C, D; A, B, C, D. O R: A, B, C, D; A, B, D. D C: A, B; A. K S: A, B; A. W A: A, B; A, B. O H: A, B, D; A, B. A R: A, B, C, D; A, B, C, D. WI: A, B, C, D; A, B, C, D. GA: A, B, C; A, B, C. N V: A, B, D; A, D. I D: A; A. N H: A; A. W Y: A; A. TN: A, B, D; A, D. I A: A, B, C, D; A, B, C, D. I L: A, B, C, D; A, B, C, D. A K: A; A. M S: A; A. P A: A, B, C, D; A, B, C, D. M O: A, B, C; A, B, C. N D: A; A. M E: A, C, D; A, D. K Y: A, B, C, D; A, B, C, D. V T: A, B, C; A, B. A Z: A, B, C, D; A, B. I N: A, B, C; A, B, C. L A: blank; blank. N Y: A, B, C, D; A, B, C, D. M N: A, B, D; A, D. U T: A, B, C, D; A, B, C, D. N M: A, C, D; A, C. TX: A, B, D; A, B, D. V A: A, B, C, D; A, B, C, D. The data below the table reads as follows: A: traffic counts. B: detector or sensor data. C: connected vehicle data. D: big data.
Page 81
Suggested Citation: "Appendix B: Survey Responses." National Academies of Sciences, Engineering, and Medicine. 2025. Traffic Capacity Level of Service: Adaptations and Usage. Washington, DC: The National Academies Press. doi: 10.17226/29143.
The column headers are as follows: State; Are there policies?; If yes, describe the policies. The data given in the rows is as follows: C A: Not sure; A, B, C, D. F L: No; A, B, C, D. S C: No; A. C O: Not sure; A, B, C. S D: No; A. N E: No; A. N C: Yes; the Most important policy dictates road performance adjacent to a proposed new development. O K: No; blank. M I: No; blank. O R: No; blank. D C: Not sure; blank. KS: No; blank. W A: No; blank. O H: Yes; The Ohio D O T defines operations goals of a project, which include L O S. A R: No; blank. W I: Yes; No legislative framework, but we have guidance on how to apply or use L O S in our Facilities development manual. G A: No; blank. N V: No; blank. I D: No; blank. N H: Yes; N H D O T Highway design manual. W Y: Yes; Per chapter 3, Section 3-01 of our Road design manual, the level of service warranting improvements is defined for interstate and non-interstate sections. T N: Not sure; blank. I A: No; blank. I L: No; blank. A K: Yes; Alaska highway preconstruction manual. M S: No; blank. P A: Yes; Penn D O T Publication 46, Chapters 10 and 12. M O: No; blank. N D: No; blank. M E: Not sure; blank. K Y: No, blank. V T: Not sure; blank. A Z: No; blank. I N: No; blank. L A: not applicable; blank. N Y; Yes; Highway design manual includes L O S in design criteria. M N: No, blank. U T: Yes; U D O T Traffic analysis guideline. N M: Yes; The N M D O T State Access Management Manual and Design Manual describe acceptable L O S for facilities and intersections. T X: Not sure; the Most important policy dictates road performance adjacent to a proposed new development. V A: not applicable.
Page 82
Suggested Citation: "Appendix B: Survey Responses." National Academies of Sciences, Engineering, and Medicine. 2025. Traffic Capacity Level of Service: Adaptations and Usage. Washington, DC: The National Academies Press. doi: 10.17226/29143.
The data given in the table rows is as follows: S C: Big data is sourcing several programs through volume inputs, which are then evaluated in process and are feeding new methodologies and LOS determined. O R: Micromobility could definitely influence capacity, speed per density, and the overall L O S thresholds. Same goes with C A Vs. W I: It influences the methodologies used to develop L O S, but the L O S criteria remained the same. N V: We use their data as supplementary data for most projects. We also use their data when we do not have any data at all. N H: Big data can be used to calibrate L O S models. I A: Big data sources are used for T S M O-related congestion monitoring. LOS is not really used as a component in congestion monitoring. P A: Probe data being used to develop operational measures to drive program decisions. V T: I N R I X prode data is being investigated. N Y: data collection, origin–destination are influenced by using these new methods with big data. U T: The L O S criteria do not change, but the data available to perform traffic operations analyses is constantly evolving. As new data becomes available, projects are encouraged to evaluate those and if successful, they are adopted into practice. N M: In the past, analysis was used to determine things such as speed, delay, or density and then those measures were used to report performance. Emerging technology and big data allow the opportunity to skip the analysis step and provide the same measurable characteristics directly. T X: Big data is used to identify or confirm the selection of a representative day.
Page 83
Suggested Citation: "Appendix B: Survey Responses." National Academies of Sciences, Engineering, and Medicine. 2025. Traffic Capacity Level of Service: Adaptations and Usage. Washington, DC: The National Academies Press. doi: 10.17226/29143.
The column headers are as follows: State; Link to published guide. The data given in the table rows are as follows: Row 1, F L: https://www.fdot.gov/planning/systems/systems-management/systems-management-documents. Row 2, C O: https://www.codot.gov/safety/traffic-safety/assets/traffic_analysis_forecasting_guidelines/traffic_analysis_forecasting_guidelines. Row 3, S D: (link not provided). Row 4, N C: https://connect.ncdot.gov/resources/safety/Congestion%20Mngmt%20and%20Signing/Standards%20-%20Capacity%20Analysis%20Guidelines.pdf. Row 5, O R: https://www.oregon.gov/odot/Planning/Pages/APM.aspx. Row 6, W A: http://www.wsdot.wa.gov/. Row 7, O H: The Ohio D O T has an O A T S (Ohio Analysis and Traffic Simulation) Manual. https://www.transportation.ohio.gov/wps/wcm/connect/gov/4a5217b4-d590-41c0-923f-af08b93b26db/OATS+Manual+-+January+2024+-+opt+wApp.pdf?MOD=AJPERES&CONVERT_TO=url&CACHEID=ROOTWORKSPACE.Z18_79GCH8013HMOA06A2E16IV2082-4a5217b4-d590-41c0-923f-af08b93b26db-oSPvd2U. Row 8, W I: https://wisconsindot.gov/Pages/doing-bus/local-gov/traffic-ops/manuals-and-standards/teops/ch16.aspx, https://wisconsindot.gov/rdwy/fdm/fd-11-05.pdf#fd11-5-3. Row 9, I A: https://iowadot.gov/systems_planning/pr_guide/Traffic/Traffic_Impact_Guidelines.pdf. Row 10, I L: https://idot.illinois.gov/doing-business/procurements/engineering-architectural-professional-services/consultant-resources/highways/manuals-and-guides.html(Section 31-4 of the Illinois D O T Bureau of Design and Environmental Manual). Row 11, P A: https://www.dot.state.pa.us/public/PubsForms/Publications/PUB%2046.pdf (Chapters 10 and 12). Row 12, M O: https://epg.modot.org/index.php/Category:232_Facility_Selection. Row 13, N D: https://www.dot.nd.gov/sites/www/files/documents/construction-and-planning/Traffic-Operations-Manual.pdf. Row 14, V T: https://vtrans.vermont.gov/sites/aot/files/planning/documents/trafficresearch/TIS%20Guidelines%20Revised%20April%202019%20CGC.pdf. Row 15, A Z: https://azdot.gov/sites/default/files/media/2021/08/TGP0240-2021-08.pdf. Row 16, I N: https://www.in.gov/indot/traffic-engineering/corridor-development-office/intersection-traffic-analysis-procedures/. Row 17, N Y: https://www.dot.ny.gov/divisions/engineering/design/dqab/hdm/hdm-repository/chapt_05.pdf. Row 18, U T: https://www.udot.utah.gov/connect/docs/udot-traffic-analysis-guideline,https://www.udot.utah.gov/connect/docs/fhwa-utah-division-iacr-guide/. Row 19, T X: https://ftp.txdot.gov/pub/txdot/des/tsap/traffic-safety-analysis-procedures-manual.pdf.
Page 84
Suggested Citation: "Appendix B: Survey Responses." National Academies of Sciences, Engineering, and Medicine. 2025. Traffic Capacity Level of Service: Adaptations and Usage. Washington, DC: The National Academies Press. doi: 10.17226/29143.
The data given in the table rows is as follows: C A: Caltrans tried to publish its traffic analysis guide for many years. It was drafted up multiple times. C O: I don’t have too much insight into how C D O T uses L O S for multimodal purposes, my focus is primarily on vehicle traffic analysis. M I: Not used for peds, bikes, multimodal, transit (i.e, non-motor vehicle). K S: The L O S is provided with visuals to aid in explaining traffic flow. N H: Alternative analysis, driveway permitting, intersection control evaluation, signal optimization. W Y: We defer to the highway capacity Manual for analysis of either a future need for an increase in capacity (along with estimated future traffic volumes) or determination of a current need for improvement if the L O S (as defined in the AASHTO Green Book) meets our threshold for the road section type. P A: Shifting toward more measuring rather than modeling going forward. M O: One common issue is “How bad of L O S F” since this can be quite a wide range of delay per density. N D: N D D O T uses L O S as a factor to determine roadway design. Our guidance references the Green Book (Table 2-3) and F H W A’s L O S memo dated 5-6-16. U T: The H C M Capacities may be appropriate on a national level, but we have found, here in Utah, that 2000 v p l p h is not realistic. Our measured maximum capacities reach 1900, and in some cases drop as low as 800. There generally seems to be a lack of education relating to “Enemies of capacity” and how field conditions can have a substantial impact on real-life capacities. We are currently updating our traffic analysis guidelines to include this information. T X: T x D O T continue encouraging the use of H C M L O S analysis to support design decisions.
Page 61
Suggested Citation: "Appendix B: Survey Responses." National Academies of Sciences, Engineering, and Medicine. 2025. Traffic Capacity Level of Service: Adaptations and Usage. Washington, DC: The National Academies Press. doi: 10.17226/29143.
Page 61
Page 62
Suggested Citation: "Appendix B: Survey Responses." National Academies of Sciences, Engineering, and Medicine. 2025. Traffic Capacity Level of Service: Adaptations and Usage. Washington, DC: The National Academies Press. doi: 10.17226/29143.
Page 62
Page 63
Suggested Citation: "Appendix B: Survey Responses." National Academies of Sciences, Engineering, and Medicine. 2025. Traffic Capacity Level of Service: Adaptations and Usage. Washington, DC: The National Academies Press. doi: 10.17226/29143.
Page 63
Page 64
Suggested Citation: "Appendix B: Survey Responses." National Academies of Sciences, Engineering, and Medicine. 2025. Traffic Capacity Level of Service: Adaptations and Usage. Washington, DC: The National Academies Press. doi: 10.17226/29143.
Page 64
Page 65
Suggested Citation: "Appendix B: Survey Responses." National Academies of Sciences, Engineering, and Medicine. 2025. Traffic Capacity Level of Service: Adaptations and Usage. Washington, DC: The National Academies Press. doi: 10.17226/29143.
Page 65
Page 66
Suggested Citation: "Appendix B: Survey Responses." National Academies of Sciences, Engineering, and Medicine. 2025. Traffic Capacity Level of Service: Adaptations and Usage. Washington, DC: The National Academies Press. doi: 10.17226/29143.
Page 66
Page 67
Suggested Citation: "Appendix B: Survey Responses." National Academies of Sciences, Engineering, and Medicine. 2025. Traffic Capacity Level of Service: Adaptations and Usage. Washington, DC: The National Academies Press. doi: 10.17226/29143.
Page 67
Page 68
Suggested Citation: "Appendix B: Survey Responses." National Academies of Sciences, Engineering, and Medicine. 2025. Traffic Capacity Level of Service: Adaptations and Usage. Washington, DC: The National Academies Press. doi: 10.17226/29143.
Page 68
Page 69
Suggested Citation: "Appendix B: Survey Responses." National Academies of Sciences, Engineering, and Medicine. 2025. Traffic Capacity Level of Service: Adaptations and Usage. Washington, DC: The National Academies Press. doi: 10.17226/29143.
Page 69
Page 70
Suggested Citation: "Appendix B: Survey Responses." National Academies of Sciences, Engineering, and Medicine. 2025. Traffic Capacity Level of Service: Adaptations and Usage. Washington, DC: The National Academies Press. doi: 10.17226/29143.
Page 70
Page 71
Suggested Citation: "Appendix B: Survey Responses." National Academies of Sciences, Engineering, and Medicine. 2025. Traffic Capacity Level of Service: Adaptations and Usage. Washington, DC: The National Academies Press. doi: 10.17226/29143.
Page 71
Page 72
Suggested Citation: "Appendix B: Survey Responses." National Academies of Sciences, Engineering, and Medicine. 2025. Traffic Capacity Level of Service: Adaptations and Usage. Washington, DC: The National Academies Press. doi: 10.17226/29143.
Page 72
Page 73
Suggested Citation: "Appendix B: Survey Responses." National Academies of Sciences, Engineering, and Medicine. 2025. Traffic Capacity Level of Service: Adaptations and Usage. Washington, DC: The National Academies Press. doi: 10.17226/29143.
Page 73
Page 74
Suggested Citation: "Appendix B: Survey Responses." National Academies of Sciences, Engineering, and Medicine. 2025. Traffic Capacity Level of Service: Adaptations and Usage. Washington, DC: The National Academies Press. doi: 10.17226/29143.
Page 74
Page 75
Suggested Citation: "Appendix B: Survey Responses." National Academies of Sciences, Engineering, and Medicine. 2025. Traffic Capacity Level of Service: Adaptations and Usage. Washington, DC: The National Academies Press. doi: 10.17226/29143.
Page 75
Page 76
Suggested Citation: "Appendix B: Survey Responses." National Academies of Sciences, Engineering, and Medicine. 2025. Traffic Capacity Level of Service: Adaptations and Usage. Washington, DC: The National Academies Press. doi: 10.17226/29143.
Page 76
Page 77
Suggested Citation: "Appendix B: Survey Responses." National Academies of Sciences, Engineering, and Medicine. 2025. Traffic Capacity Level of Service: Adaptations and Usage. Washington, DC: The National Academies Press. doi: 10.17226/29143.
Page 77
Page 78
Suggested Citation: "Appendix B: Survey Responses." National Academies of Sciences, Engineering, and Medicine. 2025. Traffic Capacity Level of Service: Adaptations and Usage. Washington, DC: The National Academies Press. doi: 10.17226/29143.
Page 78
Page 79
Suggested Citation: "Appendix B: Survey Responses." National Academies of Sciences, Engineering, and Medicine. 2025. Traffic Capacity Level of Service: Adaptations and Usage. Washington, DC: The National Academies Press. doi: 10.17226/29143.
Page 79
Page 80
Suggested Citation: "Appendix B: Survey Responses." National Academies of Sciences, Engineering, and Medicine. 2025. Traffic Capacity Level of Service: Adaptations and Usage. Washington, DC: The National Academies Press. doi: 10.17226/29143.
Page 80
Page 81
Suggested Citation: "Appendix B: Survey Responses." National Academies of Sciences, Engineering, and Medicine. 2025. Traffic Capacity Level of Service: Adaptations and Usage. Washington, DC: The National Academies Press. doi: 10.17226/29143.
Page 81
Page 82
Suggested Citation: "Appendix B: Survey Responses." National Academies of Sciences, Engineering, and Medicine. 2025. Traffic Capacity Level of Service: Adaptations and Usage. Washington, DC: The National Academies Press. doi: 10.17226/29143.
Page 82
Page 83
Suggested Citation: "Appendix B: Survey Responses." National Academies of Sciences, Engineering, and Medicine. 2025. Traffic Capacity Level of Service: Adaptations and Usage. Washington, DC: The National Academies Press. doi: 10.17226/29143.
Page 83
Page 84
Suggested Citation: "Appendix B: Survey Responses." National Academies of Sciences, Engineering, and Medicine. 2025. Traffic Capacity Level of Service: Adaptations and Usage. Washington, DC: The National Academies Press. doi: 10.17226/29143.
Page 84
Next Chapter: Appendix C: Interview Discussion Topics
Subscribe to Email from the National Academies
Keep up with all of the activities, publications, and events by subscribing to free updates by email.