Traffic Capacity Level of Service: Adaptations and Usage (2025)
Chapter: 2 Literature Review
CHAPTER 2
Literature Review
This chapter presents the results of the literature review regarding the use and adaptations of the Highway Capacity Manual (HCM) level of service (LOS) framework. The literature review was informed by several sources, including manuals, policy documents, and standards used by state DOTs. This chapter is organized into the following sections: overview of the HCM LOS framework and methodologies for various facilities and modes; FHWA guidance on traffic analysis tools; agency-specific guidance on the use of the HCM and techniques used for LOS analysis and communication purposes.
Highway Capacity Manual LOS
The HCM LOS is a qualitative measure used to describe the operational conditions of a transportation system, such as roads, intersections, or transit systems, based on traffic flow and related parameters. The LOS is categorized into six levels, designated by the letters A through F, with each level representing a different range of operational conditions. LOS A represents the best operating conditions from the traveler’s perspective and LOS F the worst. LOS assessments are used by transportation planners and engineers to evaluate the performance of roadways and to determine necessary improvements to enhance traffic conditions. The LOS is an important component in decision-making for infrastructure investments, urban planning, and traffic management strategies.
The most recent editions of the HCM (starting with the sixth edition) include a subtitle “A Guide for Multimodal Mobility Analysis,” which underscores the recent efforts on evaluating the operational performance of several modes, including pedestrians and bicycles, and their interactions. As such, the current edition of the HCM, the seventh edition (HCM7) describes methods for estimating a variety of performance measures for multimodal transportation facilities, some of which are used as the designated service measures to estimate LOS. Figure 1 presents the key performance measures of the HCM methodologies and the service measures that determine LOS (in bold). This figure also appears as Exhibit 7-4 in HCM7 (Transportation Research Board, 2022).
The HCM provides three main types of tools for analyzing traffic operations: (1) generalized volume tables, (2) methods based on the use of default values, and (3) operations-level analysis, where a significant amount of inputs comes from measured or estimated values. These tool types can be used at different points along the course of a project. Generalized volume tables provide the maximum number of vehicles that a system element can carry at a given LOS. These tables are intended for use in planning-level applications where it is not necessary or feasible to evaluate every segment or intersection. The HCM also offers the option to evaluate or design for future conditions, by using default values for many of the required input parameters. These default values represent typical national values; therefore, the use of local values may reduce the uncertainty

of the analysis results. The Planning and Preliminary Engineering Applications Guide (PPEAG) to the HCM is a reference publication on best practices for applying the HCM methods to a variety of planning and preliminary engineering applications (Dowling et al., 2016). Note that the operational-level analysis requires the input of measured or forecasted values of all parameters.
State-Specific Guidance on the HCM LOS Framework
Twenty-eight state DOTs have published reports documenting the development of state-specific guidance related to the use of the HCM LOS concepts and tools for traffic analysis or communication purposes. A brief list of these documents is provided in Appendix D. Based on the literature, the HCM LOS is used across all steps of a project, starting from planning and preliminary engineering to geometric design and operations, and covering many different applications. The following sections summarize the HCM LOS uses by the analysis context.
Planning, Preliminary Engineering, and Design
The HCM has been adopted as a design standard by many state DOTs and is being used to drive planning studies, such as traffic impact analysis (TIA), preliminary engineering, or design. Detailed information on the use of the HCM LOS for these applications is provided below; Table 1 summarizes the state-selected LOS thresholds for these types of analyses.
Alaska DOT
For design designation, Alaska DOT considers LOS for urban roadways (Alaska DOT and Public Facilities, 2023). The design designation contains data that form the basis for establishing the design criteria, and LOS is one of these considerations, along with design functional
Table 1. Summary of LOS thresholds by area type for planning, preliminary engineering, and design analysis.
| State | LOS Thresholds | |
|---|---|---|
| Urban Areas | Rural Areas | |
| Alaska | AASHTO guidelines | |
| Arizona | same LOS as in horizon (planning) years without development | |
| Arkansas | D | C |
| California | C-E | C-D |
| Florida | D | C |
| Illinois | C (target) and D (lowest acceptable) for SRA routes. D for freeways | |
| Maryland | D | |
| Missouri | D (off-peak), E (peak) | C (off-peak), D (peak) |
| New Mexico | D | C |
| New York State | D | C |
| New Hampshire | B-D (varies by terrain and highway type, see Table 2) | C-D (varies by highway type, see Table 2) |
| North Dakota | D | |
| Texas | C (target) and D (lowest acceptable) | B (target) and C (lowest acceptable) |
| Vermont | C (freeways, highways, urban streets, intersections), D (high-volume TWSC intersections) | |
| Washington State | D | C |
| Wyoming | D | C |
Note: TWSC = two-way stop-controlled.
classification, project type, traffic projections, etc. Alaska DOT considers AASHTO’s A Policy on Geometric Design of Highways and Streets (Green Book) guidelines for selecting design LOS as a function of area and terrain type and functional class for new construction or reconstruction projects (Table 2.5, AASHTO, 2011). Designers may also follow AASHTO’s recommendations for lane and shoulder widths that are compatible with the LOS specifications for the project.
Arizona DOT
Arizona DOT considers LOS for TIAs (2021). Arizona DOT adopts the latest edition of the HCM or any software that uses the HCM methodologies for conducting capacity analysis. If arterial streets, intersections, approaches, or lane groups are projected to operate below LOS C in the planning horizon years without the development, the traffic impact is mitigated to provide the same LOS in the planning horizon year. Additionally, if the current LOS is F, then mitigation is required to maintain the same LOS after the development. LOS is estimated for the peak periods, or other periods depending on the project requirements.
Arkansas DOT
According to Arkansas’s long-range intermodal transportation plan (LRITP) (Arkansas DOT, 2021), when capacity expansion is needed to address congestion issues, the state-specific highway economic requirements system (HERS-ST) model is implemented, and highway improvements are considered for ensuring an acceptable LOS D in urban areas and LOS C in rural areas.
Caltrans
The Caltrans Highway Design Manual (2020) uses a target LOS for the design year of C-E for urban freeways, and C-D for rural freeways. Caltrans also suggests design year peak-hour capacities ranging from 1,400–2,400 veh/h/ln for urban freeways and 1,000–1,850 veh/h/ln for rural freeways.
Florida DOT
Florida DOT has developed the 2023 Multimodal Quality/Level of Service Handbook (Q/LOS Handbook) (FDOT, 2023) to guide engineers, planners, and decision makers through the evaluation process of users’ quality of service at the generalized planning level. This latest edition of the Q/LOS Handbook incorporates the HCM sixth edition (HCM6) (Transportation Research Board, 2016) techniques and introduces the level of traffic stress (LTS) for evaluating bicycle and pedestrian quality of service. Florida DOT uses the generalized planning to complete a range of high-level analyses, such as initial problem identification, statewide analyses, and future-year analyses. Florida DOT uses the generalized service volume tables by area type for freeways and context classification for highways and arterials, instead of area types (urban vs. rural) as used in the HCM. Florida DOT uses eight context classifications for highways and arterials, which consider a combination of area type and land use. Florida DOT uses the HCM LOS criteria to estimate the generalized service volume tables, assuming Florida-specific default values for roadways and traffic, such as peak-hour factor (PHF), speed adjustment factor (SAF), capacity adjustment factor (CAF), heavy vehicle percentage, directional distribution factor (D), etc. Florida DOT’s LOS policy sets the target vehicular LOS for the state highway system during peak hours as LOS D in urbanized areas, and LOS C outside of urbanized areas (Florida DOT, 2023).
Illinois DOT
Illinois DOT uses the service flow rates from the HCM for design purposes (Illinois DOT, 2024). Illinois DOT uses the 1994 HCM (Transportation Research Board, 1994) to calculate the service flow rates for two-lane highways. For intersection design and intersection capacity analysis, the LOS is calculated for each lane group, each approach, and the intersection as a whole. Multiperiod analysis is also performed if oversaturation occurs. An LOS D is considered for new construction or reconstruction purposes for freeways. Along strategic regional arterial (SRA) routes, the target peak-hour LOS for the through lanes is “C,” while the lowest acceptable is “D.” Generally, geometric improvements (e.g., climbing lanes, contra-flow lanes, interchanges) may be warranted to avoid significant drops in LOS in the design year. For example, if an intersection LOS in the design year is E or F using conventional improvements, an interchange may be constructed. For resurfacing, restoration, and rehabilitation (3R) projects, the design capacity should accommodate current traffic at LOS D.
Indiana DOT
Indiana DOT (2023) dictates that, at the intersection level, each approach has no more than one LOS worse for the design year traffic conditions compared to the present year. Apart from LOS, additional MOEs are required, such as delay, v/c ratio, average and 95th percentile queue length, aggregate travel time, and average travel speed. For alternative intersections, Indiana DOT suggests using the experienced travel time (ETT) to obtain LOS and refers to Chapter 23 of the HCM7.
Iowa DOT
Iowa DOT (2024) guidelines require capacity and LOS analysis for all TIAs following the latest edition of the HCM. Capacity analysis is required for both AM and PM peak hours for each analysis year. Apart from the reported LOS, the effects of queueing and blocking on the intersection operations also need to be reported.
Maryland State Highway Administration
Based on Maryland State Highway Administration guidelines, TIAs must evaluate traffic operations under current, background, and total traffic conditions, identify deficiencies, and propose mitigation for issues like queueing blockage and safety concerns. Mitigation is required for
intersections or movements below LOS D if background conditions are acceptable, and for development impacts in substandard LOS areas (Maryland State Highway Administration, n.d.).
Minnesota DOT
Minnesota DOT refers to the latest edition of HCM for highway design or traffic analysis. Highways and intersections need to accommodate the design hourly volume (DHV), which is the maximum traffic volume (i.e., capacity), following the methodologies outlined in the HCM (Minnesota DOT, 2018). Although LOS is reported for all types of intersections, it can be used for comparing two intersections of the same type, while delay is used for comparison between intersection types (Minnesota DOT, 2023).
Missouri DOT
According to Missouri DOT, the HCM LOS is a common performance measure used for planning and design applications, although other measures of effectiveness (MOEs) (e.g., crash frequency, speed, travel time, delay, density, queue lengths, and throughput) can be considered depending on site-specific conditions and concerns. Typically, a 20-year traffic forecast is used for the analysis. The forecasted peak-hour LOS of a rural corridor should be D and its off-peak LOS should be C. The forecasted peak-hour LOS of an urban corridor should be E and its off-peak-hour LOS should be D. In general, it is adequate for all routes in rural locations to accommodate the peak-hour traffic projection at a LOS of D and off-peak traffic at a LOS of C. Similarly, it is adequate for all roads in urban or suburban locations to accommodate the peak-hour traffic projection at a LOS of E and off-peak traffic at a LOS of D (Missouri Department of Transportation, n.d.).
New Mexico DOT
New Mexico DOT uses minimum LOS standards for traffic studies, such as TIAs and interchange access change requests (IACRs). The minimum LOS for interstates based on peak hour is “C” and the only exception is for large urban interstates in areas with a population of more than 250,000, where LOS “D” is considered acceptable (New Mexico Department of Transportation, 2020).
New York State DOT
New York DOT uses the HCM LOS as the primary MOE for all projects except for preventive maintenance projects to quantify the quality of traffic flow. LOS for intersections in New York is calculated for each lane group, approach, and the intersection as a whole. LOS D or better on each lane group for urban areas and LOS C for rural areas are set as accepted LOS criteria for the design year (New York State DOT, 2023).
New Hampshire DOT
According to New Hampshire DOT, the HCM is one of the references frequently used in the design process. Table 2 shows the selected LOS for various highway functional types. (New Hampshire DOT, 2023).
Table 2. New Hampshire DOT guide for the selection of design LOS.
| Highway Type | Rural Level | Rural Rolling | Rural Mountainous | Urban and Suburban |
|---|---|---|---|---|
| Freeway | B | B | B | C |
| Arterial | B | B | C | C |
| Collector | C | C | D | D |
| Local | D | D | D | D |
North Dakota DOT
North Dakota DOT suggests that capacity analysis should follow the procedures of the HCM. The capacity analysis is used to determine the number of traffic lanes needed, provide recommendations for the type of intersections, establish signal phasing, and establish LOS. North Dakota DOT’s guidance is to meet or exceed LOS D for traffic signals, roundabouts, highway segments, and interchange ramps (North Dakota DOT, 2024).
Oregon DOT
Oregon DOT applies the generalized capacity tables of the HCM and the PPEAG to conduct planning-level analyses [e.g., for regional transportation plans, transportation system plans (TSPs), and corridor plans]. The PPEAG’s simplified segment method is used to evaluate identified problem areas, whereas the PPEAG’s simplified facility method is used to preliminary evaluate alternatives and generate MOEs besides v/c. Oregon DOT has also developed local default values for saturation flow rates.
Pennsylvania DOT
Pennsylvania DOT’s Traffic Engineering Manual (2014) emphasizes that HCM 2010 (Transportation Research Board, 2010) should be the default method used in traffic analysis projects and adopts the HCM LOS thresholds. Pennsylvania DOT has established state-specific default values to be used in the LOS analysis. These include base saturation flow rates, traffic control calibration parameters (e.g., start-up lost time), base critical headways, and base follow-up headways at two-way stop-controlled (TWSC) intersections. When Pennsylvania-specific defaults or locally collected data are unavailable, HCM default values are used. Pennsylvania DOT accepts the use of the HCM methods related to signalized intersections, two-way and all-way stop-controlled intersections, roundabouts, urban streets, and freeway facilities, for auto and multimodal modes. In all cases, if a traffic facility falls outside the HCM framework, an alternative tool can be used (Pennsylvania DOT, 2014).
Texas DOT
According to the Texas DOT Roadway Design Manual, urban streets should be designed for LOS B, or LOS D in densely developed areas as defined in the HCM. The appropriate LOS should be determined based on the functional class from the statewide planning map. According to this manual, urban freeways and their auxiliary facilities should generally be designed for LOS C in the design year, with LOS D acceptable in heavily developed urban areas, and other MOEs including travel time, speed, and queue lengths in heavily congested areas. In rural areas, LOS B is desirable for freeway facilities, but LOS C may be acceptable for auxiliary facilities carrying unusually high volumes (Texas Department of Transportation, 2022).
Vermont Agency of Transportation
The Vermont Agency of Transportation’s highway design policy dictates that LOS, as defined in HCM 2000 (Transportation Research Board, 2000), is the selected performance measure for highway design. Apart from LOS, Vermont Agency of Transportation includes the v/c ratio and travel time as additional performance measures at the corridor level for planning purposes (Vermont Agency of Transportation, 2019). Vermont Agency of Transportation’s policy is to maintain an LOS C for all highway facilities, including freeways, rural highways, urban streets, and intersections, and an LOS D for TWSC intersections with high volumes. Some exceptions to this rule can be applied to densely populated areas, in which cases, at minimum, factors such as traffic volumes, emergency response needs, public delay, v/c ratio, safety, and potential negative impacts should be considered. If necessary geometric improvements are not feasible, a lower LOS may be acceptable if safety and mobility are improved through traditional traffic engineering approaches or transportation demand management (TDM) strategies.
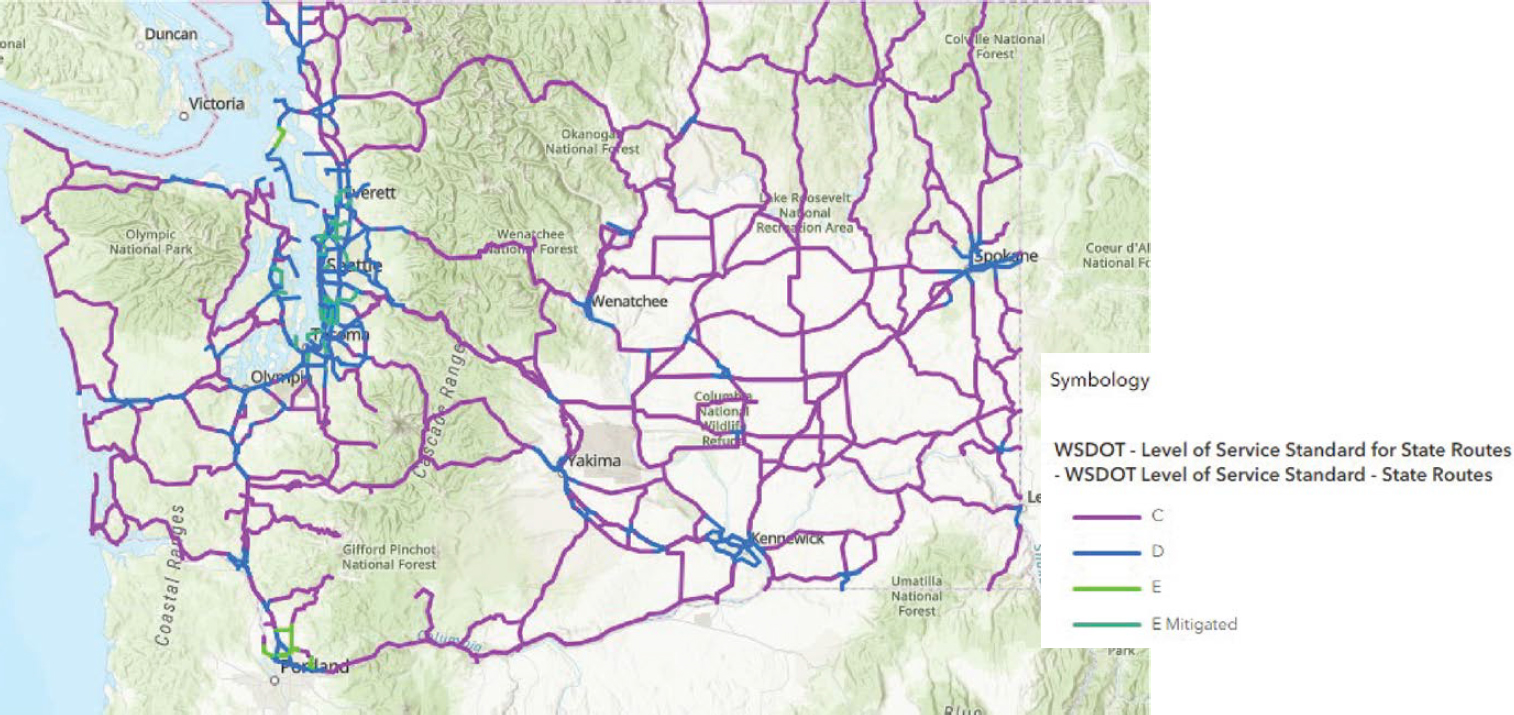
Washington State DOT
The Growth Management Act (GMA) of Washington State is a framework that was established to guide the development and management of the state’s growth sustainably. Washington DOT plays a significant role in ensuring that transportation planning and development align within this framework (Washington State DOT, 2023). As part of this effort, LOS standards are used to monitor the performance of the state system, evaluate improvement strategies, and assist in coordination between governments. This policy also requires local agencies to include LOS standards for highways of statewide significance within their comprehensive plans.
Washington State DOT follows the latest version of the HCM to conduct these studies. LOS along with other MOEs are required to be reported in a TIA. The LOS threshold is C for rural facilities and D for urban non-National Highway System (NHS) facilities, unless regional adjustments apply (Washington State DOT, 2023) (Figure 2). In addition to TIA, Washington State DOT applies HCM methods to freeway segments, weaving areas, ramps, multilane highways, two-lane highways, intersections, transit, pedestrian, and bicycle facilities to inform decision makers about the necessary extent of facilities to meet the acceptable facility operation. However, the HCM method has limitations. For instance, queue interactions in closely spaced signalized intersections can distort the results of HCM analyses. In these cases, microsimulation models can be used as an alternative.
Wyoming DOT
Wyoming DOT uses a design year LOS C for interstate mainline sections, and LOS D for interstate interchange ramps, intersecting roads, NHS arterials, and non-NHS state highway rural and urban mainline sections. Wyoming DOT refers to the HCM for the application of the LOS methodologies (Wyoming DOT, 2021).
Operational Analysis
The HCM LOS framework and concepts have been used for operational-level analysis by several state DOTs. A summary of the state-by-state considerations is provided in this section.
Arizona DOT
For capacity analysis, Arizona DOT uses the HCM methodology for calculating LOS at signalized and unsignalized intersections and reports this by intersection, intersection approach, and lane group for each approach. HCM is also used for LOS analysis along arterials. HCM is also used for conducting queueing analysis on turn lanes, median openings, and ramp terminals. HCM is not used for generating signal timings.
Colorado DOT
Colorado DOT uses LOS and associated performance measures to indicate traffic operations performance of facilities, in conjunction with additional performance measures on a case-by-case basis. At a minimum, Colorado DOT suggests reporting LOS, delay or density, and queue length for all analyses and facility types (basic freeway segments, merge and diverge segments, weaving segments, multilane and two-lane highways, urban arterials, signalized and stop-controlled intersections, and roundabouts). LOS, along with other MOEs, is required for traffic analysis purposes irrespective of the tool used (analytical vs. simulation). However, quantitative MOEs are more appropriate than LOS for oversaturated conditions (Colorado DOT, 2023).
Colorado DOT has developed the operational LOS (OLOS), which captures how a segment performs compared to its expected operation for travel times using the planning time index (PTI). OLOS is used for operational and investment decisions related to bottleneck identification,
corridor improvement potential, operations evaluation, incident, weather, event, and construction management, analysis for funding approvals, and project prioritization for long-term planning.
Colorado DOT has also developed the Intersection Control Assessment Tool (ICAT) for intersection control evaluation (ICE) and comparison of multiple alternatives. This tool is developed with the collaboration of Georgia DOT and considers operations, safety, environmental impacts, and costs. The ICAT is required for new intersections or projects that include significant changes to traffic control or geometry, while it is recommended but not required for intersection projects that do not involve federal or state funds. Although delay and v/c are the desired performance measures in the operational procedure in ICAT, LOS is not considered. The tool and user guide can be found on the Colorado DOT website (https://www.codot.gov/safety/traffic-safety/assets/project-operations-evaluation/cdot-icat-v1-0-users-guide_accessible.pdf).
Florida DOT
Florida DOT uses LOS and v/c ratio for evaluating the performance of a facility (FDOT, 2021). However, Florida DOT requests the reporting of additional MOEs, depending on the specific project and the analysis tool used. The typical MOEs needed for operational analysis are travel time, speed, delay, LOS, v/c ratio, throughput, density, queue length, and network-wide MOEs. More specifically, when using the HCM, LOS is always required along with additional MOEs depending on the facility type, as listed in Table 3.
For freeway facilities, Florida DOT uses speed obtained from microsimulation to indicate whether a facility is congested or uncongested (Florida DOT, 2021). The speed thresholds used by Florida DOT were developed using the speed-flow relationships from the HCM and are a function of the posted speed limit (Table 4). Florida DOT recommends applying these thresholds to freeway segments, merge/diverge segments, or weaving segments. However, these levels of congestion are not mapped to LOS categories or further break down LOS F to subcategories.
Iowa DOT
Iowa DOT recommends reporting density and LOS when using microsimulation; however, these will need to be consistent with the HCM6 definitions in terms of segments (basic freeway, merge/diverge, and weave) and units (e.g., convert vehicles to passenger cars) (Iowa DOT, 2017).
Kentucky Transportation Cabinet
Kentucky Transportation Cabinet (KYTC) recommends including several MOEs when conducting microsimulation, depending on the project’s needs. The typical MOEs are volume, speed, travel time, queue length, and LOS (density and delay). However, KYTC suggests that LOS should not be the primary MOE for model performance as it is “not the most applicable or accurate way to represent the results” (KYTC, 2021). As such, it is recommended to use it along with delay or density for a high-level evaluation and consider segment length, time duration, and units when reporting LOS from simulation outputs.
New Mexico DOT
New Mexico DOT recommends performing a capacity analysis before implementing a Road Diet (i.e., reduction of the number of vehicular lanes to add features such as bike lanes, pedestrian walkways, or bus stops) to confirm the roadway will function acceptably with the new lane configuration. New Mexico DOT uses methodologies from the HCM for assessing intersection capacities. For special situations, such as closely spaced intersections, coordinated signal systems, or corridors with at-grade rail crossings, microsimulation is recommended to accurately evaluate traffic arrival patterns and the formation and dissipation of queues (New Mexico DOT, 2020).
Table 3. Typical HCM-based MOEs used by Florida DOT.
| Facility Type | MOE |
|---|---|
| Freeway facilities | Individual segment: density (pc/mi/ln) |
| Individual segment: LOS | |
| Facility overall: density (pc/mi/ln) | |
| Facility overall: speed (mph) | |
| Basic freeway segments | •Density (pc/mi/ln) |
| •LOS | |
| Merge/Diverge segments | •Density (pc/mi/ln) |
| •LOS | |
| •V/C for major merge/diverge segments | |
| Weaving segment analysis | •Density (pc/mi/ln) |
| LOS | |
| Ramp Roadways | v/c (Calculated) |
| Signalized intersection | Intersection delay (sec/veh) |
| Movement delay (sec/veh) | |
| Intersection LOS | |
| Movement LOS | |
| Back of queue ft/ln (95th percentile) | |
| Back of queue veh/ln (95th percentile) | |
| Unsignalized intersection (All-Way Stop-Controlled) (Two-Way Stop-Controlled) | Intersection delay |
| Intersection LOS | |
| Movement delay | |
| Movement LOS | |
| 95th percentile queue length (veh) | |
| Urban Streets | Travel Speed (mph) |
| LOS | |
| Multilane highways | Density (pc/mi/ln) |
| LOS | |
| Two-lane highways | Follower density (followers/mi/ln) |
| LOS | |
| Roundabout | Control delay (sec/veh) |
| LOS | |
| Approach delay (sec/veh) | |
| Approach LOS | |
| 95th percentile queue length (veh) |
Note: pc/mi/ln = passenger car per mile per lane; sec/veh = seconds per vehicle; mph = miles per hour.
Table 4. Florida DOT’s congestion level thresholds for freeways (Source: Florida DOT, 2021).
| Congestion Level | Posted Freeway Speed (mph) | ||||
|---|---|---|---|---|---|
| 50 | 55 | 60 | 65 | 70 | |
| Uncongested | ≥50 | ≥53 | ≥59 | ≥61 | ≥63 |
| Lightly Congested | <50–47 | <53–48 | <59–54 | <61–56 | <63–57 |
| Moderately Congested | <47–42 | <48–43 | <54–44 | <56–45 | <57–45 |
| Heavily Congested | <42 | <43 | <44 | <45 | <45 |
Ohio DOT
Ohio DOT suggests that at minimum the outputs of LOS, delay or density, 95th percentile queue lengths, v/c ratio, and queue-storage ratios (QSR) should be reported for all analyses. The operational goal of mainline analyses including basic segments, merge, diverge, and weave is to operate at LOS D or better inside a metropolitan planning organization (MPO) and LOS C or better outside an MPO with a demand-to-capacity (d/c) ratio less than 0.93 in all cases. This DOT recommends that all intersection analyses including all-way stop-control, TWSC, roundabouts, and signalized intersections operate at LOS E or better for each approach and LOS D or better for the whole intersection within an MPO and LOS C or better outside an MPO. The v/c ratio for all cases and all movements should be less than 1, while the preferred v/c ratio is 0.93. The QSR should be less than 1 for all movements (Ohio DOT, 2024).
Oregon DOT
Oregon DOT’s Analysis Procedures Manual (APM) is generally based on the HCM but includes developed methodologies to address the limitations of the HCM. Oregon DOT uses the v/c ratio as one key MOE derived from HCM to evaluate motor-vehicle operating characteristics on highways. Oregon DOT requires v/c for the state highway system, while LOS is optional. LOS or a combination of v/c and LOS are required for the local system to compare with established performance targets and standards. These targets for peak hour are outlined in Oregon Highway Plan Policy (2011) and range between 0.85 and 1.0 for highways outside metro areas and between 0.99 and 1.1 within the Portland Metropolitan Region (Oregon DOT, 1999). Other performance measures can be considered as appropriate, such as queueing, capacity, travel time, simulation-based MOEs, etc.
The truck LOS index is another MOE used by ODOT that has been recently developed and assesses the quality of service a facility provides for truck freight hauling, as perceived by shippers and carriers. The truck LOS index is calculated as the ratio of the actual utility to the utility under ideal conditions. Detailed methodology can be found in the PPEAG (Oregon DOT, 2024).
Texas DOT
Texas DOT uses different measures of effectiveness (MOEs) to report project conditions. MOEs such as control delay, density, percent of free-flow speed, percent time spent following, queue length, reliability, speed, travel time, throughput, and LOS are defined in the HCM and calculated based on HCM methods when applicable (Texas Department of Transportation, 2023).
Virginia DOT
Virginia DOT employs HCM methodologies to analyze traffic flow and operational conditions. MOEs such as control delay, density, space mean speed, and v/c ratio are provided based on HCM methodologies to document the results. Although LOS is not one of the selected MOEs for operations, it can still be reported as long as it is estimated based on an analytical tool [e.g., highway capacity software (HCS)]. Generally, LOS is not used to support results from microsimulation models (Virginia DOT, 2020).
Multimodal LOS Methods
The HCM introduced a multimodal approach to analyzing and evaluating urban streets in its 5th edition, in 2010. The HCM multimodal LOS (MMLOS) framework comes from NCHRP Report 616 (Dowling et al., 2008). The LOS estimation for non-motorized vehicle modes combines factors that can be described as performance measures (e.g., speed) and others that have more descriptive character (e.g., sidewalk width). These factors are combined into a numerical score that is converted to LOS ranges A (≤2.00), B (2.00–2.75), C (2.75–3.50), D (3.50–4.25), E (4.25–5.00), and F (>5). The LOS results are provided for the different modes, and the method does not provide a single LOS measure that combines all of them.
The transit LOS for urban streets is based on a transit LOS score that includes variables related to passenger experiences walking to the transit stop (depends on the pedestrian LOS score), waiting for the transit vehicle (depends on service reliability and presence of shelters), and riding on the transit vehicle (depends on convenience and comfort).
The LTS is an alternative method to evaluate LOS for bicycle and pedestrian travel, developed by Mekuria et al. (2012). The authors classified bicycle facilities into 4 groups. LTS 1 refers to a level that most children can tolerate; LTS 2 is the level that can be tolerated by the typical adult population; LTS 3 can be tolerated by “enthused and confident” cyclists; and LTS 4 is the level tolerated only by people characterized as “strong and fearless.” The LTS methodology is intended for high-level plans such as transportation system plans (TSPs) and it requires fewer inputs than the HCM LOS method.
State-Specific Multimodal LOS Analysis
Several DOTs have reported using the MMLOS framework of the HCM or the LTS method. The following sections summarize the current practices of state DOTs related to multimodal LOS.
Caltrans
Caltrans (2020) dictates that for non-motorized traffic, sidewalks LOS, or on-street bicycle facilities LOS should be equal to that of vehicles using the roadway, or better. The design of off-street bicycle facilities can use the HCM LOS methodology when conditions deviate from the design standards.
Florida DOT
Florida DOT uses the bicycle level of traffic stress (BLTS) and the pedestrian level of traffic stress (PLTS) as the desired performance measures that quantify the quality of travel for people walking or biking (FDOT, 2023). FDOT uses the BLTS methodology developed by the Mineta Transportation Institute (Mekuria et al., 2012). There are no specific targets for multimodal facilities for LTS, but the local governments have established these.
Minnesota DOT
Minnesota DOT uses the HCM LOS framework when evaluating bicycle facilities alternatives, and avoids using LOS as a design parameter or criterion on its own. Minnesota DOT has chosen LTS as the preferred measure to identify how well a roadway serves people on bicycles (Minnesota DOT, 2021).
New York State DOT
New York State DOT uses HCM guidelines to determine LOS for non-automobile modes such as pedestrians and bicyclists. It might be necessary to calculate LOS for these modes in high-density main streets and business/walking districts (New York State DOT, 2023).
Oregon DOT
Oregon DOT had developed a simplified version of the HCM Bicycle and Pedestrian LOS, which uses fewer independent variables for the LOS determination using probability-based ranges. The developed method also overcomes a limitation of the full MMLOS method, which generally prevented obtaining LOS A and B. The simplified method applies to roadway sections with shared-use vehicle lanes or regular bike lanes. This method is also consistent with the bicycle LTS method if used as a screening tool, as poor LOS levels will result in poor segment stress levels (Oregon DOT, 2024).
Oregon DOT’s transit LOS method is based on user perception scores regarding transit service on a segment. It encompasses passengers’ views on walking to a transit stop, waiting for the transit vehicle, and the experience of riding the vehicle. This method applies to buses, streetcars, and other transit vehicles operating in mixed traffic on roadways, but not to transit systems in separated rights-of-way. Transit LOS is determined by factors such as transit schedule speed, frequency, and pedestrian LOS, and can be used to evaluate alternatives that impact these elements. This method is a streamlined version of the HCM transit LOS (Oregon DOT, 2024).
Pennsylvania DOT
Pennsylvania DOT adopts the use of the HCM 2010 multimodal methods and LOS criteria (Pennsylvania DOT, 2014).
Maryland State Highway Administration
Maryland State Highway Administration also adopts the HCM method for multimodal analysis. In areas with significant pedestrian and bicycle traffic, pedestrian and bicycle delays and LOS are required for all crosswalks, with requirements discussed during the scoping meeting (Maryland State Highway Administration, n.d.).
FHWA Traffic Analysis Toolbox
FHWA published the Traffic Analysis Toolbox (TAT) Volume I (Primer) and Volume II (Decision Support Methodology for Selecting Traffic Analysis Tools) in 2004 (FHWA, 2004a; FHWA, 2004b). The goals of these documents were to assist transportation practitioners in selecting the correct type of traffic analysis tool for operational improvements and promote the development of analytical consistency and uniformity across state DOTs. Apart from these two volumes, the FHWA TAT also includes guidance documents on other key topics (e.g., microsimulation guidance, case studies, performance measures, etc.).
The Volume I (Primer) is intended to provide an overview of the different types of traffic analysis tools and their role within the transportation analysis process. Some of the tool categories listed in Volume I include sketch-planning tools, travel demand models, analytical/deterministic (HCM-based), traffic signal optimization, and macroscopic/mesoscopic/microscopic simulation models. Volume I briefly describes HCM-based analytical/deterministic tools for predicting several performance measures, such as capacity, delay, speed, and queueing, and suggests their use primarily for analyzing the performance of small-scale facilities. This volume also presents several limitations of the HCM methods, compared to simulation, focused mostly on the limited ability to evaluate system effects, and interacting queues (FHWA, 2004a).
Volume II focuses on establishing a methodology and criteria for selecting the appropriate traffic analysis tool type. The criteria are centered around:
- The ability to analyze the geographic scope of interest.
- The capability of modeling various facility types (e.g., freeways, arterials, ramps, etc.)
- The ability to analyze different modes of travel.
- The ability to analyze various traffic management strategies and applications (e.g., ramp metering, incident management, etc.)
- The capability of estimating traveler responses to traffic management strategies, for example, route diversion, modal shift, etc.
- The ability to directly provide the desired performance measures.
- The cost-effectiveness of the task, including the capital cost, level of effort, ease of use, data requirements, etc. (FHWA, 2004b).
A worksheet with recommended weights for the abovementioned criteria is also provided in Volume II and from the FHWA website. However, given the substantial changes in the capabilities of all traffic analysis tools, the TAT Volumes I and II are currently undergoing a significant update.
The traffic analysis tool selection process is important as it determines the type of performance measures that will be reported. However, although several analysis tools may report the same types of performance measures (e.g., control delay), caution is needed regarding the definitions of these performance measures, especially if these are used as service measures for LOS.
Use of Analysis Tools for LOS Analysis
State DOTs have published and maintained guidelines that dictate the type of analysis tool to use depending on the application, as well as the reported performance measures, including LOS. Many of these guidelines follow the FHWA TAT guidelines and further adjust for their state practices.
Colorado DOT
Colorado DOT uses HCS for analyzing undersaturated freeway segments and FREEVAL and HCS for undersaturated freeway facilities. Simulation (e.g., TransModeler or VISSIM) is used in the case of complex geometries not covered by HCM or when these complex geometries affect downstream flow rates during oversaturation. For signalized or unsignalized intersections, Synchro is the preferred analysis tool for undersaturated conditions while simulation is used in oversaturated conditions. For roundabouts, multiple tools are used to compare results (e.g., Rodel, HCS, SIDRA). HCS and CAP-X are used to evaluate undersaturated alternative intersections while simulation is used for oversaturated intersections. Generally, Colorado DOT uses the TAT Vol. II guide (FHWA, 2004b). Colorado DOT uses speed probe data obtained from INRIX, HERE, or TomTom as a proxy for LOS to quickly assess large-area network performance.
Florida DOT
Similarly, Florida DOT recommends using HCM-based tools (such as HCS or Synchro) for analyzing isolated segments where the influence from adjacent segments is minimal and there is no congestion (LOS D or better), in which case, microsimulation is performed. For ICE, FDOT uses FHWA’s CAP-X tool, which is based on HCM methodologies, but the multimodal scoring was updated to expand its capabilities based on Florida requirements (FDOT, 2024). HCS is primarily used for freeway facilities and single-lane roundabouts, while Synchro is preferred for signalized and unsignalized intersections (all-way and TWSC) and SIDRA is used for multilane roundabouts. Microsimulation is used for analyzing oversaturated conditions where congestion exceeds the peak period of analysis, complex geometric configurations, or managed lanes. For these situations where microsimulation is required, the service measures (e.g., density) are converted to units of passenger cars, which can subsequently be used for estimating LOS using HCM thresholds.
Illinois DOT
Illinois DOT requires the use of the HCS and HCM for intersection and interchange capacity analyses and SIDRA for roundabout analyses. Synchro is suggested for optimizing traffic signals. HCS and HCM are also required for conducting an operational analysis of interchanges and alternative intersections [e.g., diverging diamond interchanges (DDIs)]. Synchro and VISSIM can be used to explore operations of alternative configurations. HCS and HCM are also used for intersection and corridor analysis, while a multiperiod analysis is required if an intersection is oversaturated. If other tools are used, their results must be comparable to the HCS outputs to be eligible for approval by the Illinois DOT Bureau of Design and Environment (Illinois DOT, 2024).
Indiana DOT
Indiana DOT suggests using HCS or Synchro/SimTraffic for standard intersections or arterials with at least two intersections. HCS, SIDRA, and VISSIM are suggested for roundabouts, where HCS and SIDRA are used primarily for individual roundabout analysis and VISSIM is used to evaluate how they perform as part of a network. Alternative intersections are modeled in VISSIM or Synchro/SimTraffic (Indiana DOT, 2023).
Kentucky Transportation Cabinet
KYTC (2021) follows FHWA TAT Vol. II for establishing the traffic analysis software tool selection process, which suggests that deterministic (HCM-based tools) may not be applicable for analyzing complex areas or segments that experience congestion. As such, HCS is used for typical freeway and intersection analysis, FREEVAL is used for typical freeway facilities analysis and reliability analysis, SIDRA is used for roundabouts, and microsimulation (TransModeler or VISSIM) is used for arterial and freeway analysis, signal optimization, and traffic studies. Synchro can be used for intersection analysis, signal optimization, and basic arterial simulation.
New Mexico DOT
New Mexico DOT recommends that HCM methodology or the current version of HCS should be used to perform all engineering analyses when possible. Other analysis tools can be used to supplement HCS analysis and might be required in more complex projects. If different procedures are applied, sufficient compatible data must be provided to verify the results using HCM procedures as much as possible (New Mexico DOT, 2020).
New York State DOT
New York State DOT refers to the HCM to determine specific traffic and physical data required to perform a full capacity analysis. It also requires designers to use capacity analysis software consistent with HCM. The use of microsimulation should follow guidelines in the HCM and of FHWA, and analysts are cautioned on the use of LOS from the microsimulation tool, given the difference in how it is defined compared to the HCM (New York State DOT, 2023).
Ohio DOT
Ohio DOT specifies the use of two analysis tools: an analytical/deterministic (HCS) and a microsimulation model (TransModeler). Ohio DOT specifically mentions that HCS should be used as the default analysis tool whenever applicable. TransModeler can be used in complex geometry or heavily congested situations or to evaluate system-wide impacts of improvement that are beyond the limitations of the HCS. Ohio DOT cautions about comparing results from simulation and the HCM. However, TransModeler reports LOS in a manner that is consistent with HCM methodologies. It should be noted that all weaving analyses from HCS that result in LOS F should be supplemented with TransModeler software (Ohio DOT, 2024).
Virginia DOT
Virginia DOT utilizes different tools for traffic analysis. Some of these tools are based on HCM methodology such as HCS, SIDRA intersection, Synchro, and FREEVAL. HCM methods also have limitations; for instance, they cannot be used with oversaturated conditions. In these cases, microsimulation tools are more appropriate. Since the definition and measures of LOS in microsimulation is different from the HCM, LOS shouldn’t be used to support the results from microsimulation. HCS is used by VDOT to analyze urban street facilities and segments, signalized and unsignalized intersections, freeway facilities, basic freeway segments, merging and diverging segments, weaving segments, collector-distributor facilities, multilane highways,
and two-lane highways. As a deterministic tool, HCS shall not be used to analyze oversaturated facilities. However, there are some exceptions to this rule. For instance, the freeway facility module can be used for an initial assessment of freeway alternatives. HCS can be also applied to optimize traffic signal timing for oversaturated conditions, and it should be also fine-tuned through field adjustments and microsimulation models for better accuracy (Virginia Department of Transportation, 2020).
Virginia DOT has developed a spreadsheet-based Junction Screening Tool (VJuST) for innovative intersection and interchange configuration selection (Virginia DOT, 2020). VJuST is a modified version of FHWA’s CAP-X software. Virginia DOT also uses HCS to analyze undersaturated conditions, although the freeway facilities module of HCS can be used for preliminary evaluation of alternatives. Apart from HCS, Synchro is also used for intersections and arterials, as well as for traffic signal optimization. Synchro is not used to analyze oversaturated conditions, but it can be used to optimize signal timing on an oversaturated network (Virginia DOT, 2020). Virginia DOT recommends using SIDRA for roundabout analysis. For oversaturated conditions, microsimulation (VISSIM) is recommended.
Wisconsin DOT
Wisconsin DOT uses HCS as the first choice for most traffic analyses. However, if there is a need to provide additional information or a limitation in the HCM methodology, alternative tools such as microsimulation can be used. Supported tools for LOS and capacity analysis include Synchro, PTV Vistro, and VISSIM. HCS is used for travel time reliability and SIDRA is used for roundabout analysis (Wisconsin DOT, 2022).
Summary of Key Findings
The literature review produced several findings pertinent to the use of the HCM LOS framework for different purposes and illustrated ways in which DOTs deviated from the HCM methodologies:
- The LOS concept and framework of the HCM represent a qualitative measure to describe the operational conditions of different transportation facilities considering a variety of performance measures. Besides the vehicle-centric LOS framework, the HCM has developed methodologies to evaluate the operational performance of several modes, including pedestrians, bicycles, and transit.
- The LTS is an alternative method to evaluate the LOS of multimodal facilities for bicycles and pedestrians. This method does not rely on inputs that are generally difficult to collect, such as demands, and is focused more on geometric and contextual information.
- The HCM has three main types of tools for analyzing traffic operations (i.e., generalized volume tables, methods based on default values, and operational-level analyses), all of which can be used at different stages of a project’s analysis. Although the LOS determination does not change based on the method used, the complexity or accuracy of the employed method may impact its adoption.
- State DOTs use the HCM LOS framework across various stages of transportation projects, including planning, preliminary engineering, and design, as well as operations. Each state has tailored the HCM LOS methodologies to meet specific needs and contexts. Some common implementations of the LOS framework include planning and design of facilities, ICE, IACRs, and traffic impact studies.
- Many state DOTs use the LOS as a target for design purposes of various facilities. Most DOTs (11) select LOS D for urban/high-volume areas and LOS C (8) for rural areas, although a few exceptions appear to exist.
- All DOTs reviewed, analyzed, and reported additional performance measures, beyond the LOS for different types of applications. Some DOTs (e.g., Colorado and Florida) go beyond reporting LOS, especially for congested conditions, given that LOS F does not adequately describe the extent of congestion. Oregon DOT relies on the v/c ratio instead of LOS determination.
- DOTs also rely on existing tools for deriving these performance measures or have developed their tools for analysis purposes. There is a wide range of tools that are currently used, ranging from simple spreadsheets to HCM-based tools, to more complex alternative tools including microsimulation. Given that microsimulation does not typically define LOS service measures comparably to the HCM, DOTs do not report LOS outputs from these tools.


