Traffic Capacity Level of Service: Adaptations and Usage (2025)
Chapter: 3 Survey Results
CHAPTER 3
Survey Results
A survey was distributed to 51 DOTs: the DOTs of all 50 states and the District of Columbia. The survey questionnaire is provided in Appendix A and the individual survey responses are presented in Appendix B. Forty-one of the 51 DOTs responded to the survey (80% response rate). A map of the responding DOTs is presented in Figure 3.
This chapter provides a summary of the survey results, including LOS methodologies adopted for each transportation facility and mode, adaptations and deviations from the HCM methods and reasons for such deviations, use of analysis tools for LOS determination and communication purposes, availability of data sources, and the effect of emerging technologies and big data in LOS criteria investigation. A summary of the survey results is provided at the end of this chapter. A complete list of manuals and guidelines developed by each DOT and available online is provided in Appendix D.
The survey was distributed to state DOT staff within the planning, traffic, or design offices, but the survey instructions encouraged consultation among other DOT staff who might have experience with the HCM LOS framework and its applications.
The first survey question asked which reference manual or guidelines the respondent’s DOT uses for LOS analysis. The survey respondents had the option of indicating that their DOT does not use LOS concepts; these respondents were asked one follow-up question regarding alternative performance measures used for various applications. Respondents who indicated that their DOT uses LOS concepts were asked 17 follow-up questions. All responding DOTs indicated they use LOS concepts. Figure 4 shows that the responding states either use the HCM (any version) or their guidelines or a combination of both for LOS analysis.
Typical Applications of the HCM LOS Framework
The bar chart in Figure 5 shows the types of applications/regulations for which LOS is considered by the state DOTs, either solely or in combination with other performance measures. LOS is considered for policy, planning, and operational applications. As the chart shows, LOS is considered to a lesser extent in multimodal projects, transportation system performance monitoring, and sustainability-related policies. Apart from the applications shown in Figure 5, respondents also included interstate access requests, signal optimization studies, work-zone capacity and detour analysis, temporary traffic control, and value engineering studies.
For those applications or regulations for which LOS is not considered at all, the respondent DOTs reported their adopted performance measures. A list of these performance measures is provided in Table 5.
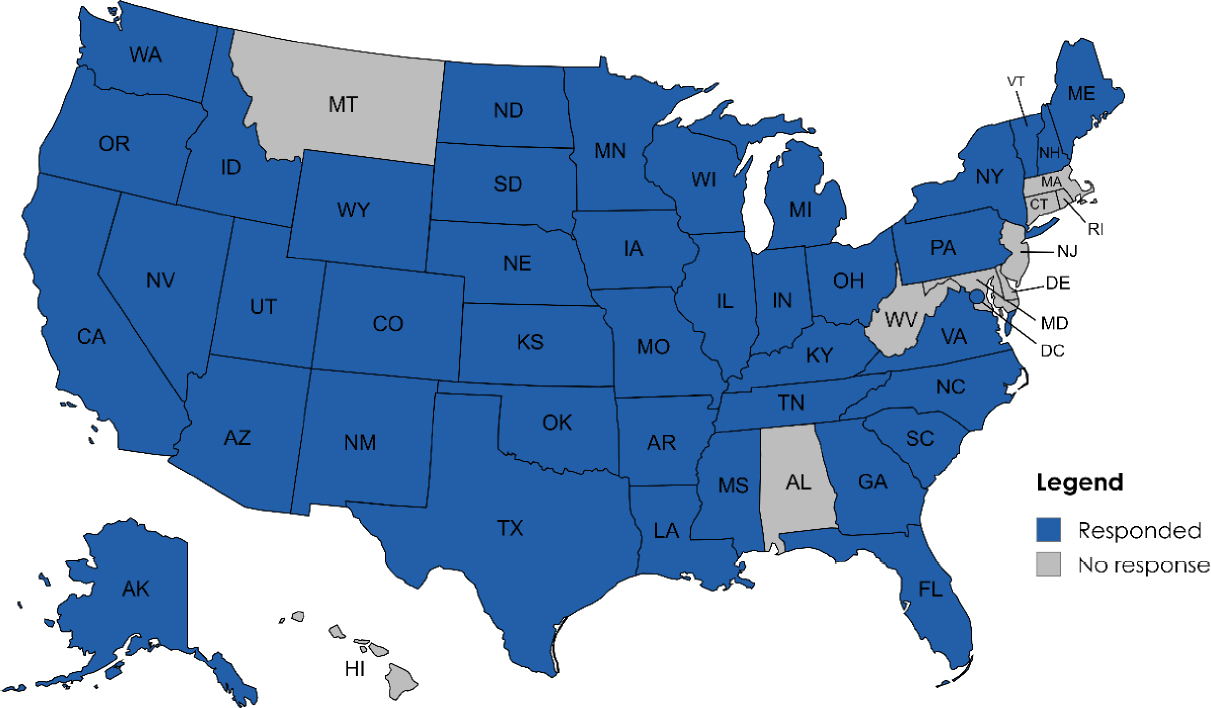
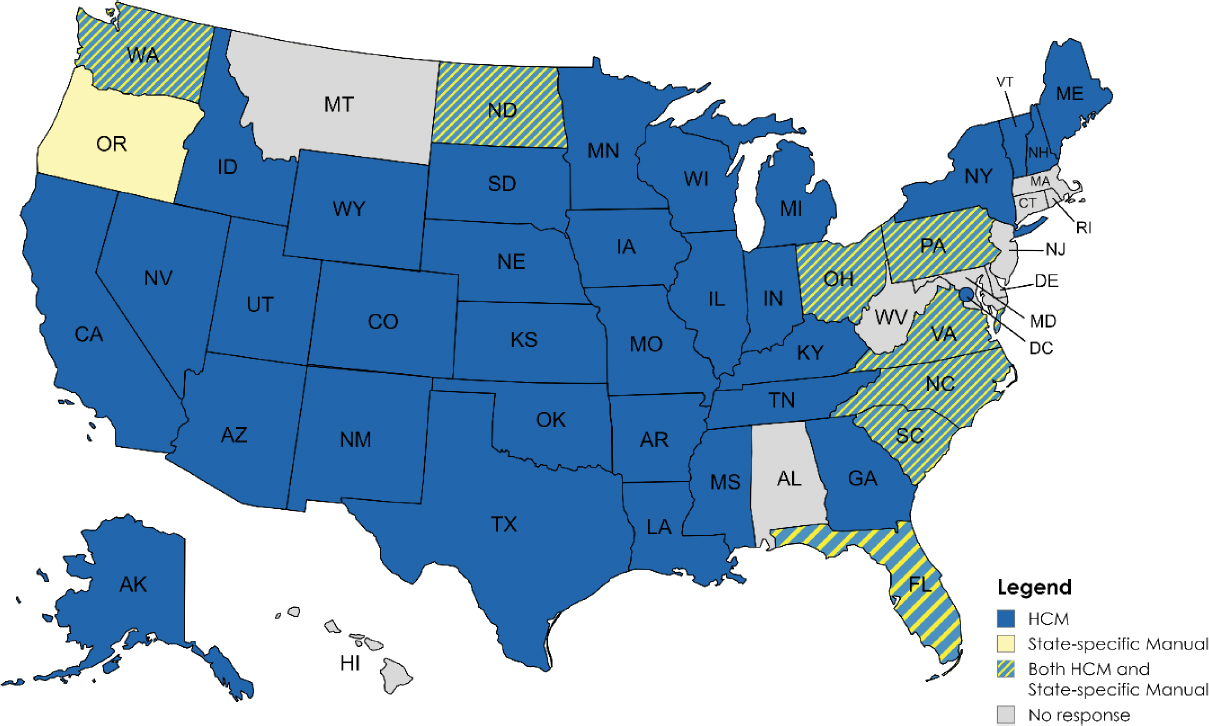
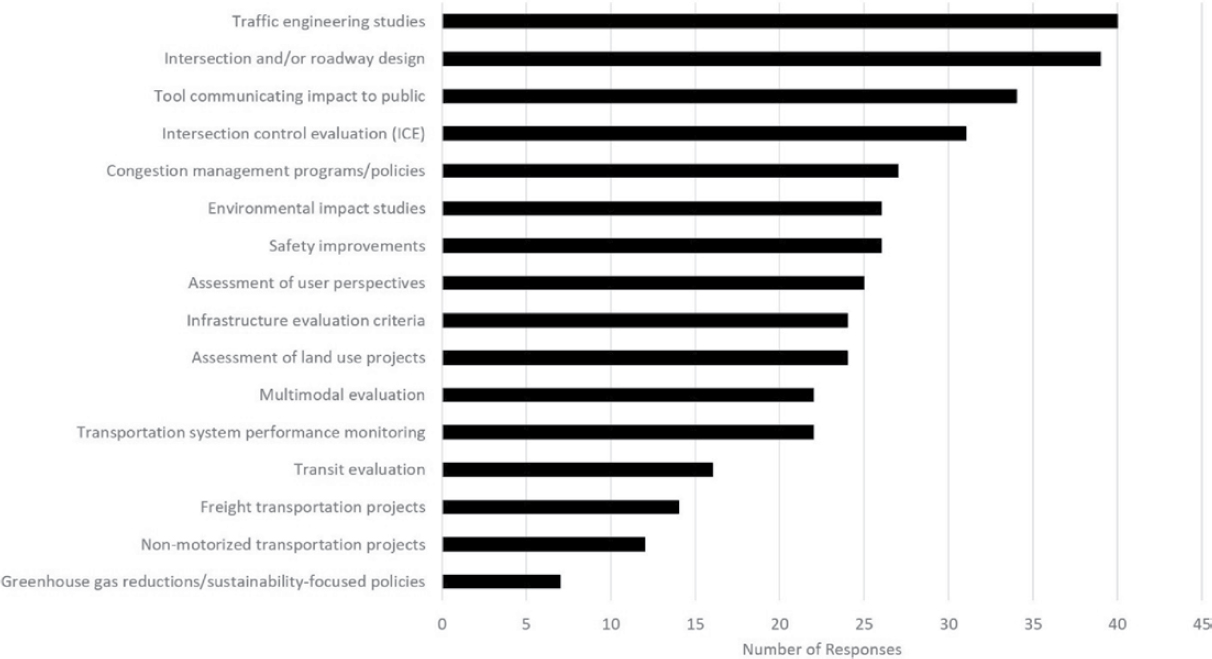
Table 5. Adopted performance measures when LOS is not considered (n = 30) (Question 5 in Survey, Appendix A).
| Applications/Regulations | Adopted Performance Measures | States |
|---|---|---|
| Environmental impact studies | v/c | OR |
| Greenhouse gas reductions/sustainability | Nitrogen Oxides (NOx) emissions, vehicle miles traveled/vehicle hours traveled (VMT/VHT), air quality, delay, travel time, change in annual average daily traffic (AADT) | MI, KS, WI, NH, MS, AZ, IN, NY, MN, UT |
| Congestion management programs/policies | air quality (CMAQ), travel time, reliability, speed, delay | WI, AK, PA, VA |
| Traffic engineering studies | v/c, travel time reliability, number of stops, delay, queue length | OR, VA |
| Transportation system performance monitoring | travel time, travel time reliability, VMT in excessively congested conditions, delay in unreliable conditions, speed, AADT, congestion, excess delay, vehicle hours of delay, pavement condition | NC, MI, NH, TN, IA, AK, PA, NY, MN, TX, VA |
| Infrastructure evaluation criteria | v/c or d/c, AADT, truck traffic, maintenance grades | OR, KS, UT |
| Assessment of land use projects | AADT, VMT, accessibility, v/c, right-of-way | MI, OR, WI, UT |
| Multimodal evaluation | level of traffic stress (LTS), network connectivity, various indices, satisfaction of design standards | FL, NC, MI, WS, AR, MO |
| Transit evaluation | ridership, travel time, reliability | NC, MI, KS, WS, NV |
| Non-motorized projects | LTS, various indices, demand, cost/benefit, satisfaction of design standards, safety, delay, network connectivity, speed, travel time | FL, NC, KS, WS, AR, NV, MO, AZ, MN |
| Freight transportation projects | travel time, delay, speed, truck route accessibility, case-by-case determination, VMT, clearance intervals, queue length | NC, MI, DC, AR, IN, MN, UT, NM |
| Intersection control evaluation | v/c, delay, safety, cost, capacity preservation | CO, OR, VA |
| Intersection/roadway design | v/c | OR |
| Tool for public communication | travel time, delay | NV, NM |
| Assessment of user perspectives | safety, public input, delay, speed | NV, NH, NM |
| Safety improvements | benefit/cost, v/c, crash rates, crash modification factors, Highway Safety Manual (HSM) excess expected crashes, reduction in crashes and severity (AASHTO, 2010) | SD, OR, KS, AR, NV, TN, PA, ND, KY, UT, NM |
LOS Use and Adoption by Facility Type and Travel Mode
Questions 6 through 8 of the survey sought information on the exact LOS methodologies adopted or used by the state DOTs for each transportation facility. Given that the HCM methodologies include multiple modes, the survey captures the methodologies used by mode as well. The most recent versions of the HCM (after 2000) were included in the survey. The survey also captures cases where the responding DOT has modified the HCM methodology to address local conditions or does not use any manual or method.
Auto Mode
Table 6 summarizes the survey responses for the auto mode. As the table shows, most DOTs use the HCM6 or HCM7 (latest update) for all facility types. For example, between 29 and 32 state DOTs use the HCM7, depending on the facility type. Note that each DOT may use multiple versions of the HCM for the same facility type or across facility types. In a few cases, older versions of the manual are used for these analyses.
Alternative methods for analyzing these facilities for the auto mode are:
- Caltrans is analyzing the freeway weaving segments using the Leisch method (1983) modifications to the HCM methods due to the low accuracy of the current HCM methodology for these types of segments.
- Oregon DOT follows the procedures outlined in the Analysis Procedures Manual (2024) for two-lane highways, signalized intersections, and all-way stop-controlled intersections. Oregon DOT only considers v/c and not LOS at signalized and unsignalized intersections.
- Washington State DOT, Wisconsin DOT, Oregon DOT, KYTC, and Indiana DOT analyze roundabouts using the SIDRA methodology.
DOTs have developed modifications of the HCM methodologies for the auto mode. Wisconsin DOT provides specific guidance for the use of saturation flow rates and right-turn-on-red (RTOR)
Table 6. Number of respondents using an HCM methodology by facility type for auto mode (n = 40) (Question 6 in Survey, Appendix A).
| Facility Type | HCM7 (latest update) | HCM6 | HCM 2010 | HCM 2000 | HCM with Modifications | Does Not Use Any Manual/Method |
|---|---|---|---|---|---|---|
| Freeway and multilane highways | 32 | 11 | 3 | 4 | 1 | 0 |
| Two-lane highways | 31 | 10 | 3 | 4 | 2 | 0 |
| Urban street facilities and segments | 31 | 11 | 5 | 4 | 2 | 2 |
| Signalized intersections | 31 | 10 | 5 | 5 | 3 | 0 |
| Two-way stop-controlled intersections | 32 | 12 | 4 | 2 | 1 | 1 |
| All-way stop-controlled intersections | 31 | 12 | 4 | 2 | 1 | 1 |
| Roundabouts | 29 | 10 | 6 | 3 | 5 | 1 |
| Ramp terminals and alternative intersections | 31 | 11 | 4 | 3 | 3 | 2 |
Note: State DOTs may use multiple HCM versions for each facility.
for signalized intersections analysis and Pennsylvania DOT has developed state-specific calibration factors for all methodologies. Arizona DOT has developed different LOS thresholds and capacities for urban street segments and facilities, roundabouts, ramp terminals, and alternative intersections. Last, Utah DOT only uses the HCM LOS tables but relies on VISSIM to produce the service measures that correlate to the LOS tables. For freeway segments and facilities, Utah DOT adopts a passenger car equivalent (PCE) value of 4 to capture the impact of the steep grades on heavy vehicle dynamics.
Bicycle, Pedestrian, and Transit Modes
Table 7 presents the survey responses for the bicycle, pedestrian, and transit modes and their respective facility types. As the table shows, many DOTs (between 14 and 20 respondents) do not use a specific manual or method for multimodal evaluation. For the most part, those that use the HCM LOS approach use the latest update.
Seven DOTs reported the use or adoption of the following alternative manuals and methods for multimodal analysis:
- LTS (Mekuria et al., 2012) is used across all pedestrian or bicycle modes by Washington State DOT, Florida DOT, Oregon DOT, and North Carolina DOT.
- In addition to LTS, North Carolina DOT uses various indices obtained from NCHRP Research Report 948 (Kittelson & Associates, Inc. et al., 2021) and Oregon DOT uses a simplified version of the HCM multimodal LOS (MMLOS) as described in its own APM (2024), which uses index-based methodology and different LOS thresholds.
- Arkansas DOT and Texas DOT primarily focus on geometric criteria. Texas DOT uses the Texas DOT Road Design Manual (2022) and the AASHTO Guide for the Development of Bicycle Facilities (2012).
Table 7. Number of respondents using an HCM methodology by facility type for bicycle, pedestrian, and transit modes (n = 40) (Question 6 in Survey, Appendix A).
| Facility Type | HCM7 (latest update) | HCM6 | 2010 HCM | HCM with Modifications | Does Not Use Any Manual/Method |
|---|---|---|---|---|---|
| Freeway and multilane highways - Bicycle | 15 | 6 | 2 | 2 | 15 |
| Two-lane highways - Bicycle | 13 | 4 | 2 | 4 | 17 |
| Urban street facilities and segments - Pedestrian | 16 | 5 | 2 | 3 | 16 |
| Urban street facilities and segments - Bicycle | 16 | 5 | 2 | 4 | 17 |
| Urban street facilities and segments - Transit | 17 | 6 | 2 | 3 | 17 |
| Signalized intersections - Pedestrian | 18 | 5 | 2 | 2 | 14 |
| Signalized intersections - Bicycle | 15 | 5 | 2 | 4 | 16 |
| TWSCs - Pedestrian | 17 | 5 | 2 | 2 | 15 |
| Off-street pedestrian | 14 | 5 | 2 | 3 | 20 |
| Off-street bicycle | 14 | 5 | 2 | 3 | 20 |
- Utah DOT uses the FHWA Bikeway Selection Guide (FHWA, 2019). Utah DOT only uses the HCM LOS tables but relies on VISSIM to produce the service measures that correlate to the LOS tables.
Regarding modifications to the HCM LOS framework for bicycles and pedestrians, Kansas DOT uses different service measures for the bicycle mode and Arizona DOT reported using different LOS thresholds.
Factors for Not Using the HCM LOS Framework
The survey solicited information on state DOTs’ factors for not selecting the HCM LOS framework and using alternative methodologies and performance measures. Most of the factors cited by the DOTs were related to MMLOS use. More specifically, 12 respondents indicated that their DOT does not need to analyze multimodal facilities or is not responsible for this task. Seven respondents suggested that the method is too complex or not accurate and does not capture the user’s perception of the quality of service. It was also suggested that safety-related performance measures may be more important for multimodal facilities.
Oregon DOT suggested that LOS can be easily manipulated, as minor adjustments in inputs can be critical for meeting targets. Oregon DOT also suggests that LOS F is not further delineated and cannot capture the variability in congestion. Respondents also criticized the accuracy of the freeway weaving method and the PCE values on steep roadways as factors for using alternative methods and tools. Table 8 summarizes the factors for not using the LOS framework, as cited by the DOTs.
Analysis Period for LOS by Type of Study
The responding state DOTs reported that the peak hour is the most frequently used analysis period when conducting LOS analysis for various types of projects (Table 9). The responding DOTs use the peak hour predominantly for preliminary engineering, alternatives analysis, roadway design, intersection or corridor evaluation studies, and traffic impact analysis (TIA). To a lesser extent, the peak hour is used for performance monitoring, congestion management, and multimodal studies. Some DOTs do not use any analysis period for multimodal facilities (10 respondents), performance monitoring (9 respondents), or congestion management (10 respondents), most likely because LOS is not required for these cases.
Table 8. Factors cited for not using the HCM LOS framework (n = 26) (Question 8 in Survey, Appendix A).
| HCM Methodology/Concept | Factors Cited |
|---|---|
| MMLOS | The DOT does not need to perform this type of analysis. |
| The methodology is too complex, not accurate, or it does not capture user perception of quality of service. | |
| Unsure how to use the method or has not used it yet. | |
| Other performance measures (e.g., safety-related) are more important. | |
| LOS concept | Can be easily manipulated. |
| LOS F has no further subcategories or upper limit. | |
| Methodological | The freeway weaving method is not as accurate as its alternatives. |
| PCE value does not capture local conditions. |
Table 9. Percentage and number of respondents using various analysis periods for LOS implementation (n = 40) (Question 9 in Survey, Appendix A).
| Type of Study | Peak Hour | ADT | AADT | Default 15-Minute Period | None |
|---|---|---|---|---|---|
| Long-range transportation plan | 28% (10) | 8% (3) | 47% (17) | 3% (1) | 14% (5) |
| Preliminary engineering | 71% (27) | 0% (0) | 18% (7) | 11% (4) | 0% (0) |
| Alternatives analysis | 76% (28) | 3% (1) | 8% (3) | 14% (5) | 0% (0) |
| Roadway design | 66% (25) | 5% (2) | 18% (7) | 11% (4) | 0% (0) |
| Existing intersection/corridor evaluation | 73% (27) | 0% (0) | 11% (4) | 16% (6) | 0% (0) |
| Traffic impact analysis | 76% (28) | 3% (1) | 5% (2) | 16% (6) | 0% (0) |
| Multimodal study | 41% (15) | 8% (3) | 19% (7) | 5% (2) | 27% (10) |
| Transportation system performance monitoring | 49% (19) | 3% (1) | 21% (8) | 5% (2) | 23% (9) |
| Congestion management/ITS/TSMO | 50% (19) | 5% (2) | 11% (4) | 8% (3) | 27% (10) |
Note: number in parentheses = number of respondents. ITS = intelligent transportation systems; TSMO = transportation systems management and operations.
Apart from these analysis periods, Wisconsin DOT indicated using the 30th highest (K30), 250th highest (K250), and sometimes the 100th highest (K100) hourly volumes of the year (design hourly volumes) for long-range transportation plans, and KYTC uses 5-minute speed data from Waze for congestion management purposes.
State DOT Consideration of LOS and Severity of Congestion
State DOTs reported which service measures are used to describe LOS F and whether the severity of congestion is considered. The responses were approximately split equally between the respondents. Nineteen responding DOTs (46%) indicated that the severity of congestion is not considered while 20 responding DOTs (49%) indicated that, in addition to LOS F, the severity of congestion is considered. Two DOTs (5%) did not respond to this question.
DOTs that also consider the severity of congestion, adopt various performance measures to quantify the severity. Figure 6 presents the performance measures used by DOTs to capture the severity of congestion.
Minnesota DOT reported further stratification of density below LOS F to five sub-levels. This stratification is done for freeway analysis and design, particularly when simulation modeling is involved. The five density sub-levels are presented in Table 10.
Tools for LOS Analysis Purposes
Respondents were asked to identify which tools their state DOTs use when performing a LOS analysis for various facility types. Respondents were asked to select all tools used by their DOT for these purposes (i.e., multiple selections were allowed). At least 30 DOTs reported using analytical tools when conducting a LOS study for all facilities covered in the HCM, except pedestrian and bicycle facilities (Figure 7). Analytical tools by facility type used by DOTs included signalized intersections (37 respondents), TWSC intersections, all-way stop-controlled intersections, ramp terminals and alternative intersections (35 respondents), roundabouts (34 respondents), freeway and multilane highways (33 respondents), two-lane highways, and urban street facilities and segments (30 respondents). Besides analytical tools, many DOTs

Table 10. Density levels for congested conditions for freeways implemented by Minnesota DOT.
| Level | Density Range (veh/mi/ln) |
|---|---|
| L1 | 43–53 |
| L2 | 53–70 |
| L3 | 70–105 |
| L4 | 105–150 |
| L5 | >150 |
also use microsimulation models, primarily for freeways and multilane highways or ramp terminals (27 respondents), urban streets (24 respondents), roundabouts (22 respondents), and signalized intersections (20 respondents). Although some DOTs do not consider LOS for pedestrians and bicycles (as also presented in Table 7), those DOTs that do consider LOS for these modes and facilities apply mostly sketch-planning or analytical tools. Probe data tools are mostly adopted for freeways and multilane highways LOS analysis (20 respondents).
Tools for LOS Visualization and Communication Purposes
State DOTs use a variety of tools to communicate or visualize LOS for each facility type. Respondents were asked to select all tools used by their DOT for these purposes (i.e., multiple selections were allowed). Microsimulation and analytical tools are primarily used for communication purposes. Sketch-planning tools may also be used occasionally, although more frequently for pedestrian and bicycle facilities than other facility types. Some DOTs also use probe data tools for freeways, two-lane highways, urban streets, and signalized intersections, and to a lesser extent for other facilities. Figure 8 presents the number of responding DOTs that use various tools for visualization purposes, as a function of the facility type.


Data Collection Methods to Assess LOS
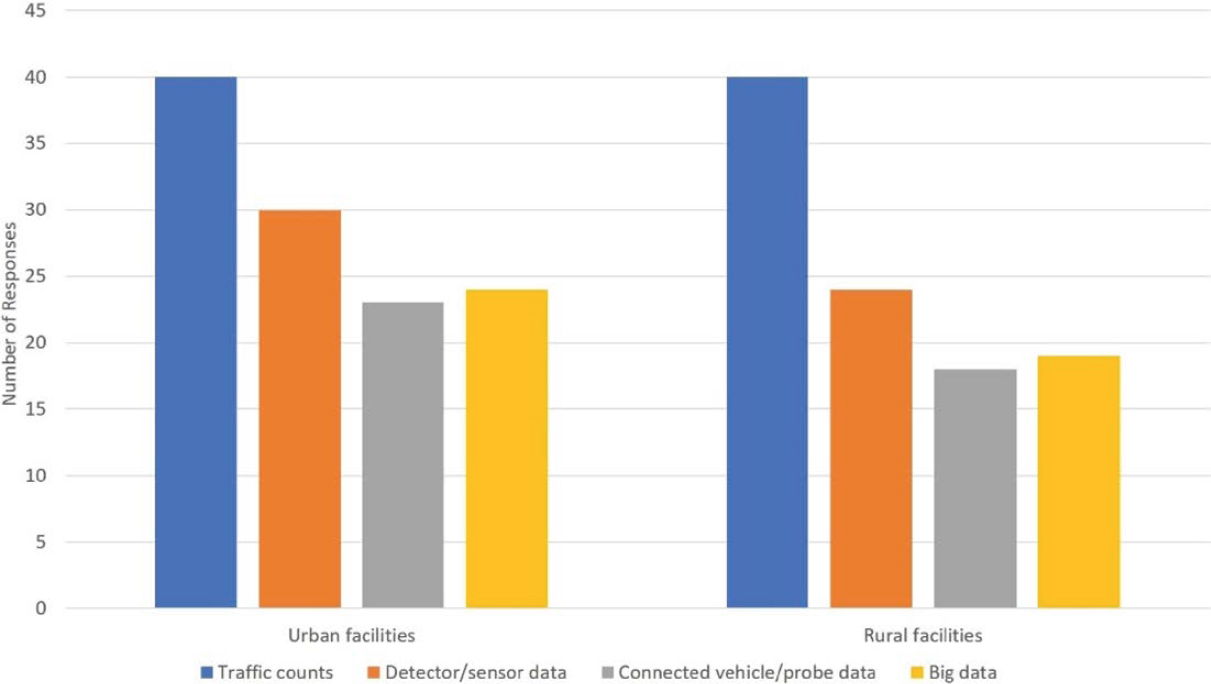
All state DOTs responded that they use traffic counts at urban and rural facilities for LOS assessment. Many state DOTs use other data from detectors or sensors in urban facilities (30 respondents) and rural facilities (24 respondents). Approximately half of the DOTs surveyed use connected vehicle or probe data. More than half of the responding DOTs use connected vehicle data (23 respondents) and big data (24 respondents) at urban facilities. In contrast, fewer use these data at rural facilities (18 respondents use connected vehicle data and 19 use big data there). Figure 9 presents the number of respondents that use a specific data collection method for LOS analysis.
Impact of Emerging Technologies and Big Data on LOS
State DOTs were further asked to describe whether and how emerging technologies and big data availability affect the adopted quality of service criteria or methodologies. A total of 18 respondents (44%) indicated that emerging data do not impact their LOS criteria and methods, while 12 respondents (29%) indicated that they do. Nine respondents (22%) were unsure and two (5%) did not answer this question. State DOTs that stated the positive impact of emerging technologies and big data on the LOS criteria and methodologies provided further explanations of these mechanisms.
- Big data can be used to calibrate LOS methodologies and models, identify or confirm the selection of representative data for further modeling and analysis, and aid in understanding origin–destination movements.
- Big data can be used to supplement data requirements for projects that require LOS analysis.
- Big data are used to skip analysis steps and directly collect performance measures.
- Probe data are used to develop operational performance measures to establish program decisions.
- The availability of big data does not affect the LOS criteria or threshold values.
- Emerging technologies, such as micromobility or connected and automated vehicles (CAVs), can influence performance measures such as capacity, speed, and density, and the overall LOS thresholds.
Apart from this impact of emerging technologies and big data on LOS, DOTs also pointed out that big data are used for real-time congestion monitoring and TSMO strategies, where LOS is not considered as a performance measure.
State Policy Frameworks for LOS
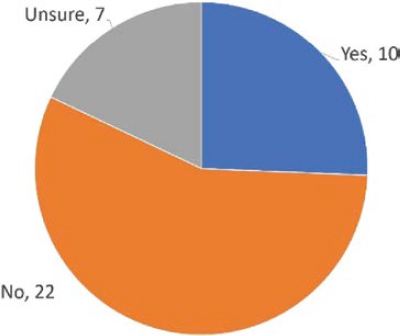
State DOTs were asked to report state policies or legislative frameworks that affect how LOS is used or defined. Most responding DOTs reported that there is no specific policy (22) or were unsure of one (7). Ten responding DOTs indicated that such policies exist, and these policies are primarily related to the roadway design criteria (Figure 10). Two DOTs did not respond to this question.
The responding DOTs were also asked to explain how they ensure that the use of LOS and the included criteria or definitions are in harmony with the DOTs’ overarching transportation policies and objectives. The majority of the DOTs (26) indicated that they perform regular policy reviews. Several states (including Oklahoma, Kansas, Missouri, and Washington) indicated that this is done on an ad hoc basis whenever may be needed and not through regular reviews. For Oregon DOT, LOS is not tied to policies or goals, therefore, alignment with the state’s policies is not required.
Summary of Key Findings
- LOS is primarily used by state DOTs for policy, planning, and operational applications, such as traffic impact studies, ICE, roadway design, and as a communication tool to the public. It is less commonly applied to multimodal projects, transportation system performance monitoring, and sustainability-related policies.
- For applications where LOS is not considered, DOTs use various other performance measures, such as v/c ratio, vehicle miles traveled (VMT), vehicle hours traveled (VHT), travel time, travel time reliability, and air quality metrics.
- Most DOTs (between 29 and 32 respondents) use the latest versions of the HCM for auto mode evaluations across various facility types. Some DOTs use older versions or modified versions of the HCM methodologies to suit local conditions.
- Specific methods like the Leisch method for freeway weaving segments and the SIDRA methodology for roundabouts are also employed by some states.
- A total of 15–20 responding DOTs do not use specific manuals for multimodal evaluations (depending on the facility type). Seven state DOTs indicated they do not use the HCM method for MMLOS. Alternative methodologies include level of traffic stress (LTS), various indices from the NCHRP Research Report 948, simplifications to the HCM MMLOS method, and design-related manuals such as the FHWA Bikeway Selection Guide.
- States have made modifications to the HCM methods to account for their local conditions. Modifications related to the auto mode include state-specific calibration factors, different LOS thresholds and capacity values for certain facility types (e.g., freeway segments, urban streets, roundabouts, ramp terminals, and alternative intersections), different PCE values, and guidance on the use of saturation flow rate and RTOR. Modifications related to MMLOS include different LOS threshold values and service measures.
- Nine DOTs reported that complexity, inaccuracy, and inability to capture user perception are major reasons for not using the HCM MMLOS framework. Wyoming DOT argued that safety-related performance measures are more appropriate for MMLOS. Other comments regarding the auto mode include the manipulability of LOS, lack of subcategories for LOS F, and inaccuracies in specific methods like freeway weaving and PCE values on steep roadways.
- The peak-hour analysis is most commonly used for various types of LOS studies, including preliminary engineering, alternatives analysis, roadway design, and traffic impact studies.
- Twenty DOTs reported using additional performance measures to describe and quantify the severity of congestion beyond LOS F. These DOTs also report the spatial extent of congestion (15 respondents or 37%), the temporal duration of congestion (13 respondents or 32%), and the amount of excess demand-to-capacity ratio (10 respondents or 25%). Texas DOT also considers the change in travel time and speed and New York State DOT considers the unmet demand. Minnesota DOT developed five sub-levels of LOS F based on density at freeway segments (beyond 43 veh/mi/ln) which is also used for arterial analysis and design, particularly if simulation modeling is involved.
- DOTs use multiple tools when conducting an LOS study. A total of 30 to 37 of the responding DOTs reported using analytical tools to analyze all facilities covered in the HCM, except pedestrians and bicycles. Depending on the facility type analyzed, many DOTs (between 20 and 27) use microsimulation, primarily for freeways and multilane highways, ramp terminals, urban streets, roundabouts, and signalized intersections. Responding state DOTs that perform LOS analysis for pedestrians and bicycles reported using mostly sketch-planning or analytical tools.
- Microsimulation and analytical tools are also widely used for visualization purposes and communicating LOS to stakeholders and the public. Depending on the methodology used, DOTs also use probe data for visualization purposes.
- Emerging technologies and big data can calibrate LOS methodologies, supplement data requirements, and provide real-time congestion monitoring. Responding DOTs reported using big data to skip analysis steps and directly collect performance measures. Responding DOTs also suggested that LOS criteria or threshold values are not impacted by emerging technologies and big data.
- Ten state DOTs have policies or legislative frameworks influencing the use and definition of LOS. Many DOTs also have manuals and guidelines that describe the use of LOS. A list of the relevant reference documents for 28 state DOTs is presented in Appendix D. Most DOTs (26 respondents) regularly review their processes to ensure alignment with broader transportation policies and goals.


