Traffic Capacity Level of Service: Adaptations and Usage (2025)
Chapter: 4 Case Examples
CHAPTER 4
Case Examples
The survey results presented in Chapter 3 were used to select the six state DOTs shown in Figure 11 for further discussion and examination. The selection criteria for the six DOTs are based on:
- The variability in the use of the HCM LOS framework;
- Geographic diversity in terms of state location, area and population, weather and climate conditions;
- Level of detail provided in the survey; and
- Willingness to participate in an interview (17 DOTs expressed willingness to participate in follow-up interviews; 6 were interviewed).
For each case example, the DOT contact was interviewed, typically with other DOT personnel who assisted in completing the survey. DOT-specific documentation and survey responses were reviewed before the interview to identify typical practices for using the HCM LOS framework. All interviewed DOTs have reviewed the case examples presented in this report and have confirmed their accuracy.
Arizona Department of Transportation
In Arizona DOT, LOS is typically considered when performing freeway analysis, for ramp metering operations (ramp meters are activated when LOS C is reached or when speed drops below 50 mi/h), and for congestion and bottleneck mitigation. LOS is also a design target for new roadways or to modify existing roadways and determine geometric features, such as the number of lanes. For arterial corridor analysis, Arizona DOT requires the estimation of LOS, along with additional measures of effectiveness (MOEs), such as progression quality, speed, etc. The HCM LOS framework is considered for any alternative analysis for both planning and operational applications.
As part of the analysis, the HCM LOS determination is conducted as the first step to evaluate current conditions. Depending on the project, if the resulting LOS does not accurately capture operations, the DOT adjusts the default input values or even LOS threshold values. The HCM LOS is also compared to the microsimulation output to verify the existing conditions. As the next step of the analysis, the future conditions/alternatives in both simulation and HCM are modeled to obtain the alternatives LOS. This process helps Arizona DOT calibrate the HCM LOS to its local conditions while using the HCM LOS framework as guidance.
The process for updating or reviewing LOS concepts includes analysis of multiple scenarios, documentation of all steps, and final review and approval by the traffic engineer and a committee. Arizona DOT is also in the process of developing manuals for operations based on the HCM LOS, simulation, and their own experience.

Crowdsourced data are used for performance monitoring, creating dashboards, and travel-time reliability analysis. The average speed obtained from the big data is also used for calibrating the traffic models. The speeds obtained from the crowdsourced data are compared with the free-flow speeds from the HCM, as well as historical speeds to identify the congestion level.
For small or non-critical segments, simple freeway facility configurations, or unsignalized intersections Arizona DOT uses highway capacity software (HCS) or FREEVAL. For more complex geometries and larger-scale projects with multiple interchanges, Arizona DOT uses VISSIM. Arizona DOT has significant hands-on experience creating models in VISSIM and has built several of its roadways in VISSIM. Arizona DOT would like to learn from other DOTs’ procedures for connecting crowdsourced/big data with traffic management systems for optimizing real-time operations.
Arkansas Department of Transportation
Arkansas DOT is using the HCM LOS framework primarily for corridor planning studies and for studying capacity problems either at existing or new corridors. Arkansas DOT’s long-range intermodal transportation plan (LRITP), which is aligned with the Moving Ahead for Progress in the 21st Century Act (MAP-21) and the Fixing America’s Surface Transportation Act (FAST Act), includes congestion reduction, mobility, and system reliability as one of its goal areas and LOS is one of the key considerations Arkansas DOT considers (safety, economic competitiveness, etc.).
Although LOS is not explicitly stated in the legislation or as part of a statewide policy, it does represent current practice. Arkansas DOT does not have a formal process in place for updating
or reviewing LOS concepts and applications. However, Arkansas DOT is keeping up to date through the HCM standing committee (ACP40) and the community. Occasionally, Arkansas DOT reverts to the HCM for interpretations on how to apply the methods and analyze highways that do not fit the “typical cases.”
Arkansas DOT uses primarily the planning-level methods of the HCM and the Planning and Preliminary Engineering Applications Guide (PPEAG). Arkansas DOT has developed its own threshold values for the generalized service volume tables, like FDOT, considering state-specific characteristics of terrain, percent of trucks, etc. The primary purpose of using these tables is to screen the entire highway system. For more detailed individual planning studies, Arkansas DOT uses the HCM methods or an agency-developed spreadsheet based on HCM 2010.
As a rural state, congestion problems in Arkansas are not as severe as in more urban states. HCM is used for most auto-related applications. For operational analyses, Arkansas DOT uses Synchro and SimTraffic, for urban arterial operations and microsimulation, respectively. Arkansas DOT also uses VISSIM when other methods cannot be used, for example, for interchange configurations or geometries not currently covered by the HCM. The HCM reliability methods have also been used when appropriate.
Arkansas DOT is currently exploring ways to use emerging technologies and big data for LOS applications. The most frequent use of crowdsourced data is origin–destination data, which is used to understand travel patterns or for traffic forecasting purposes, and not as an input to capacity analyses. Probe data from the National Performance Management Research Data Set (NPMRDS) are used to calculate travel time reliability (TTR) or to better understand operations at work zones. They are recently using these data to understand recurring and non-recurring congestion and delays along a rural interstate highway. NPMRDS is mostly used as a validation tool for capacity and LOS analyses.
HCM LOS is rarely used for multimodal purposes. Arkansas DOT works with local partners to determine the appropriate multimodal accommodations for a given context.
Arkansas DOT would be interested in learning more about how other DOTs are using the more advanced tools in the HCM, such as the new two-lane highway method, which they are not using due to a lack of resources. Arkansas DOT would also welcome more example applications of the freeway facilities and freeway reliability methods, as these may be easier to use than microsimulation.
Minnesota Department of Transportation
Minnesota DOT uses the HCM LOS framework for freeway segments but with some adaptations on the threshold values. For example, according to the HCM, LOS F is reached when density is 45 and 43 passenger cars/mile/lane for basic freeway and weaving segments, respectively, or when demand exceeds capacity at merge and diverge segments. However, Minnesota DOT considers the LOS F threshold for basic and merge/diverge segments equal to 43 passenger cars/mile/lane to be consistent across all segment types. For interrupted flow segments, Minnesota DOT uses the HCM-suggested thresholds for urban streets, signalized and unsignalized intersections, but there is a debate as to whether the signalized intersection thresholds should also be used for the roundabout segments.
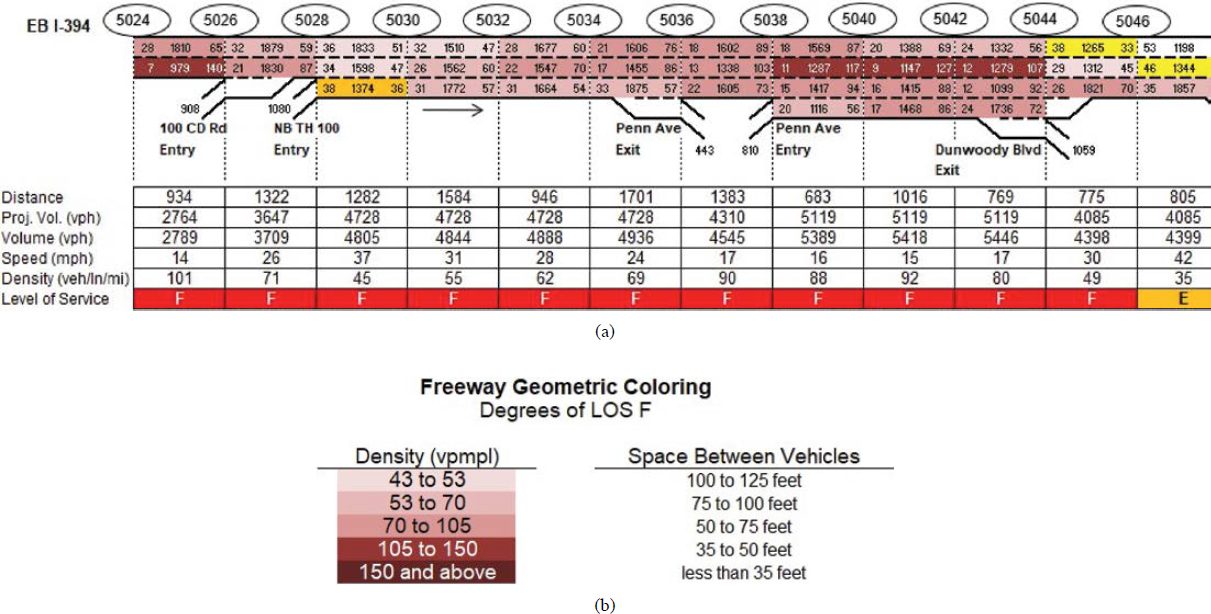
Minnesota DOT uses sub-levels of LOS F to illustrate and visualize the range of congestion on individual freeway segment lanes. This process is done on a per-lane basis, as this DOT found that reporting an average LOS F for the entire segment may hide issues related to the operation of the freeway segment. Minnesota DOT reports the per-lane densities beyond LOS F only in
their lane schematics while all of their MOE tables still use one level for LOS F, as those are segment-based. Figure 12 shows an example of a lane schematic where each lane appears in different red colors to reflect the per-lane density and identify more easily the LOS variations and the corresponding legend.
The HCM LOS framework is used primarily for interchange access requests (IARs). For this process, Minnesota DOT models both the segment and individual lanes in microsimulation to better understand operations at the merge, diverge, and weave areas. Minnesota DOT typically uses the HCM methodology and LOS framework when traffic volumes are low (e.g., outside of metro areas) and there is no congestion. Microsimulation is used within metro areas [annual average daily traffic (AADT) greater than 50,000 veh/day] and the reported performance measures are used to determine the LOS based on the HCM thresholds or the agency-specific thresholds. Color-coded plots with different LOS are created to visualize operations. This process is also used to facilitate design options, where the final three design options are simulated in microsimulation and LOS along with other MOEs (e.g., travel time) are estimated. At the planning and preliminary engineering level, Minnesota DOT also uses the HCM LOS for intersection control evaluation (ICE) for freeway capacity expansion (e.g., addition of auxiliary lanes, extension of acceleration or deceleration lanes).
LOS is one of the many policy-related criteria that Minnesota DOT uses for project scoping. The exact set of criteria changes from one project to another, but traffic and LOS considerations are part of this process.
In terms of the analysis tool selection process, Minnesota DOT uses the HCM/HCS models for uncongested conditions and isolated freeway or unsignalized segments. Synchro is used for analyzing signals and Rodel and HCS are used for roundabouts. VISSIM is used for congested freeways or any type of segment or facility with complex geometry.
Minnesota DOT uses big data for other applications but not currently for HCM LOS analyses. Big data are used for extracting origin–destination estimates or for turning movement estimates to calibrate simulation models.
Minnesota DOT would be interested in learning from other states what criteria and tables they use for determining LOS as well as what is their traffic analysis tool selection process (e.g., HCS vs. simulation).
New York State Department of Transportation
New York State DOT uses the HCM LOS concepts and framework for conducting traffic impact studies, intersection-level analysis, and freeway segment analysis (e.g., weaving and merging segments) that are not part of a larger network or connected to adjacent arterials. LOS is also reported in the case of design/approval documentation, e.g., for bridge replacement projects. LOS is also used for roundabout design and analysis. The most frequent MOEs that New York State DOT considers are travel time, queue, delay, and density. Depending on the tool used to derive these MOEs, New York State DOT may or may not report the resulting LOS. For example, if the HCS is used to obtain density on a freeway segment, then LOS is also reported. However, if VISSIM is used to obtain density along a freeway facility, then LOS is not reported, as the density definition in VISSIM is not consistent with the HCM definition.
New York State DOT adopts the current version of the HCM by default for traffic analysis or design purposes and the DOT staff participates in training or webinars related to the HCM updates. Users go back to the HCM to look for guidance when dealing with atypical configurations or to better understand what inputs are required in the HCS analysis.
LOS primarily affects New York State DOT’s policy decisions regarding design and is used to set targets for the design year. LOS is also considered for planning-level projects and operational analyses. Depending on the facility type analyzed, New York State DOT uses local capacity estimates derived from previous projects or local experience, which are different from the HCM default values. New York State DOT does not frequently perform a bike or pedestrian LOS analysis but has used the HCM process for some related projects. The majority of the analysis performed by New York State DOT is auto-focused. New York State DOT does not currently have access to automated traffic signal performance measure (ATSPM) data, but that could be useful in the future for traffic analyses.
Regarding the tool selection process, New York State DOT uses VISSIM primarily for freeway facilities analysis and Synchro for signals or arterial corridors. VISSIM is also used for visualization and communication purposes for most facilities, including signals and arterial corridors. New York State DOT currently uses HCM/HCS only for isolated freeway segments and has not had opportunities to use the most updated methods, such as the freeway facilities method. As New York State DOT looks into developing its guidelines for LOS analysis and tool selection, it will become easier to define and identify when to use the HCM LOS methodologies vs. other tools (e.g., microsimulation).
Big data are primarily used for origin–destination estimates that can be used for rerouting decisions due to roadway closures. Big data are also used to obtain freeway travel time estimates for simulation calibration purposes.
New York State DOT would be interested in learning more from other states about ways they simplify their analysis process, reduce the calibration time, cost, and effort, and select the appropriate level of analysis, depending on the project. New York State DOT would also be interested in looking at specific example applications from other DOTs to understand how other methods in the HCM are used.
North Carolina Department of Transportation
North Carolina DOT uses the LTS (Mekuria et al., 2012) and the “20 flag method” presented in NCHRP Research Report 948 (Kittelson et al., 2021) to analyze pedestrian and bicycle modes for various transportation facilities, in place of the LOS framework. In most cases, funding related to pedestrians or bicycles comes from either Complete Streets, where there is a safety concern, or through a direct grant funding mechanism. Therefore, an operational analysis is not required in either case, as these projects are primarily safety-oriented; traffic analysis and HCM LOS calculations are unnecessary.
North Carolina DOT typically uses the HCM LOS for auto mode and primarily to guide the design of transportation improvement program (TIP) projects, e.g., identification of the number of lanes, junction type, etc. The target LOS in the peak hour of the design year is D. The LOS framework is also used considerably for traffic impact analysis (TIA). In these projects, LOS is used as a standard to compare the LOS degradation due to new development and propose mitigations to restore LOS to the current level.
North Carolina DOT remains current and dictates in its policy that analysts should use the latest version of the HCM or related software that makes use of the HCM methodologies and frameworks. North Carolina DOT also performs periodic training throughout the state on the topic of TIA that focuses mostly on signalized or unsignalized intersections, where LOS is also a large component and helps maintain institutional knowledge related to this application of the HCM LOS framework.
Traffic analysis and LOS determination occur during the planning and preliminary engineering stages for screening alternatives and conducting environmental studies. Traffic analysis and LOS estimations are then repeated to refine the geometric design elements during the design/preconstruction stage. LOS is not typically estimated for operational analysis applications outside of the TIP process unless it involves problematic situations. An exception is the analysis of facilities around new or expanding schools, where LOS is needed to evaluate if the expansion will increase vehicular delays or travel times. When using the HCM methods, North Carolina DOT relies on the HCM default values and follows closely the HCM procedures.
North Carolina DOT uses emerging technologies and big data primarily for calibration purposes as part of large-scale projects developed in microsimulation (TransModeler). Big data are also used for extracting travel times through work zones or conducting TTR analysis through the acquired vendor’s system. North Carolina DOT also uses big data for creating dashboards for real-time operations and traffic management purposes. North Carolina DOT does not use big data or emerging technologies for HCM LOS procedures.
North Carolina DOT uses multiple tools for LOS evaluation along different facilities. The tool selection process depends on the project/network size, complexity, and facility type. SIDRA is used for roundabouts and Synchro for all intersections, excluding roundabouts, and short arterial streets. North Carolina DOT uses mostly microsimulation (TransModeler) for uninterrupted flow (freeway facilities and segments) and larger arterial corridors (with more than three to four intersections). North Carolina DOT may use the HCM/HCS procedures to obtain initial estimates of LOS but will focus on microsimulation for a more detailed analysis. North Carolina DOT has already modeled a large part of its network in TransModeler, therefore, the amount of effort required to run a detailed analysis is considerably reduced. Apart from LOS (i.e., delay or density), other MOEs that are reported are v/c ratio and travel time. Although LOS is included in North Carolina DOT’s policies, in some cases, v/c is preferred as it provides a continuous measurement, whereas the LOS thresholds have been designated.
This process of consistent use of the same tools and reported MOEs has allowed North Carolina DOT to develop a quantitative prioritization procedure, which can be very efficient considering
that North Carolina is the second largest DOT in terms of miles of roadway. North Carolina DOT would like to learn more from other DOTs regarding ways to improve their analysis processes and quality control.
Washington State Department of Transportation
Washington State DOT has shifted from using the HCM LOS to using the LTS for ped/bike facilities. The primary reason for using the LTS method is that the data required is more readily available and is less dependent on demand data, which can be limited and/or difficult to validate. It can help to bypass the limitations of not accurately capturing demand, which is an important input in the HCM method. When using HCM methodology for project development, active transportation alternatives can be penalized by low demand on bike/ped facilities due to the inadequacy of those facilities; LTS mitigates that impact. This effort has resulted in better quantitative comparisons between alternatives and more improvements in bike and pedestrian facilities. For transit mode, reliability seems to be more important than HCM LOS, although delay and travel times are also often used as metrics. For roundabouts analysis, Washington State DOT uses the method and MOEs included in SIDRA instead of the HCM LOS as this method was found to provide results closer to local data. According to Washington State DOT, the HCM method produces lower capacity values and tends to provide conservative estimates as it does not consider the geometrics of the roundabouts. Washington State DOT also typically uses the signalized LOS thresholds for roundabouts, rather than the unsignalized thresholds proposed by the HCM.
Apart from multimodal and roundabouts analysis, Washington State DOT uses the HCM LOS framework unless microsimulation is required. Washington DOT is trying to use deterministic methods, including the HCM, more frequently and avoiding using microsimulation where possible. Washington State DOT’s philosophy is to use the simplest tool possible. In the past, Washington DOT was more oriented toward microsimulation for facilities with queueing because deterministic methodologies have been limited in their ability to capture those effects well; but as those methodologies have improved over time, this DOT has been able to use HCM/HCS more often. However, microsimulation is still used in several cases, such as:
- Atypical geometric configurations,
- When lane-by-lane analysis is needed due to atypical driver behavior,
- Queue interactions between arterial and freeway mainline,
- HOV lanes or interactions between HOV lanes and general-purpose lanes, and
- Weaving segments.
Synchro and SimTraffic are also used for signalized corridor analysis and as a tool to verify spillback effects.
According to Washington State DOT’s policies for auto-centric facilities, the target LOS for the design year is C in rural areas and D in urban areas. While these targets inform this DOT’s design standards, they do not influence the funding decisions for large projects from an operational perspective. Washington State DOT recognizes that LOS is one of the many MOEs being evaluated; however, there are no set procedures to be followed for all projects, as these are determined based on the project’s context and focus (i.e., safety-oriented, mobility-oriented, etc.). In addition, agencies in Washington State can define LOS in different ways, even outside of the HCM, for any project except for highways of statewide significance.
Typical applications for which Washington State DOT uses the HCM LOS framework are TIAs, access revision requests (ARRs), and ICEs. In terms of operations, LOS is considered both in development review and state projects. LOS is never the sole MOE used in traffic analysis. For state projects where microsimulation is used, other MOEs are considered, such as the extent of congestion/queueing or TTR, while delay is converted to LOS for reporting purposes.
Washington State DOT maintains several guides, such as the design manual (Washington State DOT, 2023), the traffic manual (Washington State DOT, 2021), and individual protocols on the use of different tools, but some of these are not up to date with the most recent versions of the HCM or other tools.
Washington State DOT uses the HCM default values as inputs for the methodologies but also uses state-specific inputs when there is evidence that the national defaults are not representative of the local conditions.
Washington State DOT would like to see examples from other DOTs on their developed guidelines for using microsimulation or deterministic tools, such as VISSIM and SIDRA. Washington State DOT is also interested in learning how other DOTs are meeting FHWA requirements, given the limited funding and resources available.
Experience Gained from All Case Examples
The use of the HCM LOS framework varies across the six state DOTs although some commonalities are prevalent:
- Each of the interviewed DOTs reported that LOS is used as a target for highway design purposes.
- The interviewed DOTs reported that LOS is primarily used for auto-centric analysis, where the most common applications include traffic impact studies, TIP projects, and intersection control evaluation (ICE) projects.
- The HCM LOS framework for multimodal analysis is used sparsely. Washington State DOT and North Carolina DOT have adopted the LTS and NCHRP Research Report 948 (20 flags method).
- All interviewed DOTs calibrate the HCM models with local values or have generated capacities and service volume tables using local conditions. Arizona DOT, North Carolina DOT, and Minnesota DOT use different LOS threshold values to overcome inconsistencies between the HCM freeway segments methodologies or the unsignalized intersections methodologies.
- All interviewed DOTs reported using crowdsourced data, but the primary purpose of these data is to identify origin–destination movements or extract speed estimates to calibrate simulation models. Arizona DOT reported comparing historical speeds from probe data to the HCM free-flow speed to obtain congestion level estimates.
- There is a need to learn from peer DOTs on how to perform traffic analyses and improve analysis processes and quality. The interviewed DOTs also would like to learn how they can simplify and expedite their analyses by using the HCM methods and how to use the newer methods in the HCM.


