Improving Pedestrian Safety at Night (2025)
Chapter: Chapter 2: Data Collection and Analysis
CHAPTER 2
Data Collection and Analysis
Our analysis plan for this research was based on gaps identified in the literature review and the results of the state of the practice review. Our plan consists of several interrelated analyses beginning with a macro-level analysis of national crash data, followed by a more detailed, micro-level crash analysis to assess trends and contributing factors to pedestrian safety in darkness in several case cities. We then held a series of focus groups to understand pedestrian and/or driver expectations and behavior at night. The focus groups were complemented by experiments in a driving simulator to provide objective data on driver behavior relative to important factors of interest. Lastly, we conducted interviews with agencies to validate our findings.
This approach allowed us to consider an extensive array of contributing factors, including roadway characteristics, pedestrian and driver behavior, and factors that manifest in sociodemographic trends, across a number of urban environments. In keeping with the Literature Review and the State of the Practice, the emphasis was on urban environments (as defined by FARS) because of the highly disproportionate number of pedestrian fatalities in urban and suburban areas. Additionally, we intentionally included a focus on the safety of Black and Brown pedestrians in darkness in recognition of the disproportionate harm those communities suffer from traffic fatalities.
2.1 Macro-Level Analysis
Background
Our macro-analysis evaluates high-level trends and characteristics related to pedestrian safety in darkness. The primary purpose of our analysis is to determine factors that are associated with pedestrian fatalities occurring at night versus occurring during the daytime. This summary presents the descriptive statistics for key variables used in our analysis followed by our multivariate analysis. We summarize these descriptive statistics on a yearly basis to explore trends over time. For our multivariate analysis, we used binomial logistic regression to quantify the association between pedestrian fatality variables and pedestrian fatalities occurring during darkness. Specifically, we model whether or not a pedestrian fatality occurred in darkness, given that a pedestrian fatality occurred. In other words, our model results do not necessarily suggest that nighttime pedestrian fatalities are more likely to occur when significant variables are present. The significant variables in our models indicate that pedestrian fatalities with those specific characteristics are more likely to have occurred in the dark.
We consider several categories of factors associated with the Safe System Approach, including safe roadways, safe speeds, safe vehicles, and safe road users. We also examine contextual factors such as temporal (e.g., time of week, month of year) and weather conditions associated with pedestrian fatalities. Our analysis categorizes these factors more specifically into temporal (e.g., time of week, month of year), environmental (e.g., weather), location (e.g., intersection, midblock, sidewalk, crosswalk), roadway (e.g., number of lanes, speed limit), vehicle (e.g., car, truck, sport utility vehicle), movement (e.g., left turn, right turn), behavior (e.g., intoxication, speeding), and demographic (e.g., race/ethnicity, sex, age) variables.
We base our analysis on the eleven years of Fatality Analysis Reporting System (FARS) data from 2010 to 2020. FARS is a census of all fatalities on all public trafficways in the United States, including people who die from their injuries at the scene of the crash or up to 30 days after the crash (NHTSA 2022). It is considered the most reliable source of traffic crash data in the U.S. Our analyses build on recent multivariate research by members of the research team (Sanders et al. 2022) and others (Ferenchak et al. 2022) and allows us to further investigate the descriptive analysis of trends in pedestrian fatalities as reported in Schneider (2020) and Tefft et al. (2021).
Our analyses of characteristics associated with darkness compare darkness against daylight, dawn, or dusk. For this analysis, we define darkness using the FARS lighting condition variable, which is derived from police reports. Our definition of darkness includes “darkness with streetlights,” “darkness without streetlights,” and “darkness with unknown street lighting,” but it does not include “dawn” or “dusk.” For comparison, we also derived a variable for darkness based on the number of degrees the sun was below the horizon at the given time of day and latitude of the crash (“civil twilight” ends when the sun reaches six degrees below the horizon). Our empirically-derived darkness variable had a high correlation with the police-reported darkness variable, so we chose to use the police-reported variable to maintain consistency with the FARS database and make our results easier to replicate. The judgment of police on the scene might also better represent the influence of cloud cover on darkness.
Descriptive Statistics
Our dataset shows that the total number of U.S. pedestrian fatalities increased by 51% between 2010 and 2020 (4,302 to 6,516 fatalities per year) (Figure 3). During the same period, pedestrian fatalities during darkness (not including dawn or dusk) increased by 63% (3,030 to 4,951 fatalities per year). Therefore, the proportion of pedestrian fatalities that occurred during darkness increased from 71% to 76% between 2010 and 2020.
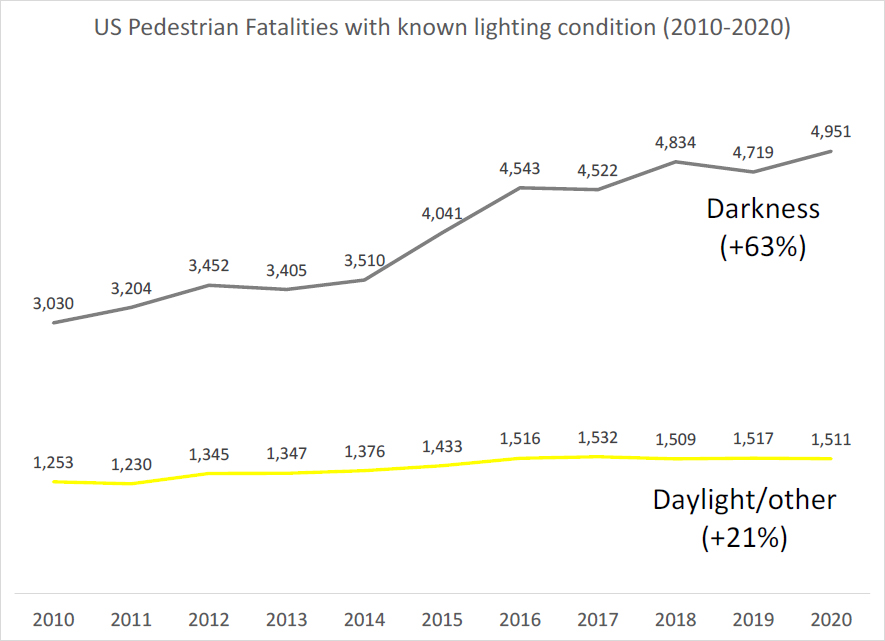
Table 2. United States Pedestrian Fatalities in Darkness, 2010 to 2020
| Year | Total Pedestrian Fatalities | Pedestrian Fatalities with Known Lighting Condition | Pedestrian Fatalities in Darkness | |
|---|---|---|---|---|
| Number | Percentage of Known Lighting Condition | |||
| 2010 | 4,302 | 4,283 | 3,030 | 70.74% |
| 2011 | 4,457 | 4,434 | 3,204 | 72.26% |
| 2012 | 4,818 | 4,797 | 3,452 | 71.96% |
| 2013 | 4,779 | 4,752 | 3,405 | 71.65% |
| 2014 | 4,910 | 4,886 | 3,510 | 71.84% |
| 2015 | 5,495 | 5,474 | 4,041 | 73.82% |
| 2016 | 6,080 | 6,059 | 4,543 | 74.98% |
| 2017 | 6,075 | 6,054 | 4,522 | 74.69% |
| 2018 | 6,374 | 6,343 | 4,834 | 76.21% |
| 2019 | 6,272 | 6,236 | 4,719 | 75.67% |
| 2020 | 6,516 | 6,462 | 4,951 | 76.62% |
| Total | 60,078 | 59,780 | 44,211 | 73.96% |
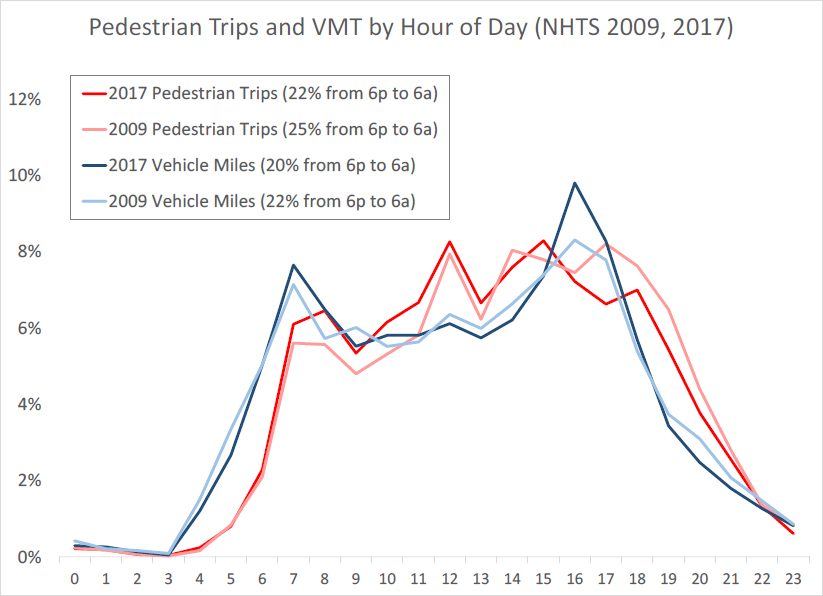
The exposure context for these pedestrian fatalities is important. Currently, the best available national-level data on both pedestrian and motor vehicle travel at different times of day comes from the National Household Travel Survey (NHTS) (FHWA 2017). This survey provides the start times for trips made between pairs of origins and destinations by different types of transportation (it also includes trips made for exercise or recreational purposes). While these trips are not coded by daylight versus darkness, we analyzed the proportion of trips starting between 6:00 pm and 5:59 am as a rough approximation of nighttime trips. We examined pedestrian trip and vehicle miles traveled data from 2009 and 2017 to approximate exposure by time of day. We analyzed pedestrian trips rather than pedestrian miles traveled because the 2017 NHTS pedestrian miles traveled data includes some large outlier values and we believe that the pedestrian trip data are more accurate.
The 2009 and 2017 NHTS show that there was between three and four times more pedestrian and vehicle travel during the hours of 6:00 am and 5:59 pm than between 6:00 pm and 5:59 am (Figure 4). There may have been a slight shift from nighttime to daytime travel between the 2009 and 2017 surveys. Given the high proportion of pedestrian fatalities corresponding with lower levels of pedestrian and vehicle activity at night, the relative risk of pedestrian crashes (per pedestrian trip and per vehicle mile traveled) occurring at night is much higher than during the day.
Additional contextual information about exposure is included in Appendix A.
The following subsections summarize the overall prevalence of specific characteristics in pedestrian fatalities as a whole and the proportion of pedestrian fatalities with these characteristics that occurred during darkness (Table 3 through Table 6). More detailed information about the descriptive statistics, including additional data tables, are provided in Appendix B. We also discuss the influence of exposure and other possible reasons for these specific results in this appendix.
Overall, the fourth quarter of the year has more pedestrian fatalities than any other quarter, as October, November, and December each account for more than 10% of total pedestrian fatalities (Table 3). The highest percentages of fatalities during darkness correspond with the darkest months of the year in the Northern Hemisphere (October through March). Comparing extremes, 81% of December pedestrian fatalities occur in darkness compared to 67% of June pedestrian fatalities.
Fridays overnight (noon on Friday to 11:59 am on Saturday) and Saturdays overnight (noon on Saturday to 11:59 am on Sunday) have more pedestrian fatalities than any other days of the week, each with more than 16% of total pedestrian fatalities (Table 3). These two days also have the highest proportion of pedestrian fatalities during darkness (79% of Friday fatalities and 83% of Saturday fatalities are during darkness).
Most pedestrian fatalities (75%) occur in clear conditions (Table 3). Of the fatalities that occur under clear conditions, 73% are during darkness. In contrast, 9% of pedestrian fatalities occur during rainy conditions yet 83% of rainy fatalities are in darkness. Therefore, rain may be associated with increased pedestrian fatality risk during darkness.
Table 3. Overall Prevalence of Specific Characteristics in Pedestrian Fatalities and Proportion of Fatalities with Each Characteristic that Occurred in Darkness, 2010 to 2020
| Temporal and Weather Characteristics | Number of Pedestrian Fatalities with Characteristic 1 | Characteristic as Percentage of Total Pedestrian Fatalities | Percentage of Fatalities with Characteristic that Occurred in Darkness |
|---|---|---|---|
| Month | 59,780 | 100% | 74.0% |
January | 5,274 | 8.8% | 78.8% |
February | 4,653 | 7.8% | 77.8% |
March | 4,633 | 7.8% | 72.3% |
April | 3,951 | 6.6% | 69.6% |
May | 4,141 | 6.9% | 67.8% |
June | 4,009 | 6.7% | 67.2% |
July | 4,411 | 7.4% | 67.7% |
August | 4,615 | 7.7% | 71.2% |
September | 5,288 | 8.8% | 70.7% |
October | 6,206 | 10.4% | 76.4% |
November | 6,207 | 10.4% | 79.1% |
December | 6,392 | 10.7% | 81.1% |
| Weekday (noon to 11:59 a.m. next day) | 59,554 | 100% | 73.9% |
Sunday | 7,233 | 12.1% | 71.7% |
Monday | 7,721 | 13.0% | 69.5% |
Tuesday | 7,804 | 13.1% | 69.2% |
Wednesday | 8,027 | 13.5% | 69.3% |
Thursday | 8,497 | 14.3% | 72.0% |
Friday | 10,364 | 17.4% | 78.9% |
Saturday | 9,908 | 16.6% | 82.7% |
| Weather Condition | 57,824 | 100% | 74.0% |
Clear | 43,064 | 74.5% | 72.7% |
Cloudy | 8,442 | 14.6% | 74.3% |
Rainy | 4,961 | 8.6% | 83.8% |
Other | 1,357 | 2.3% | 78.9% |
1) The total number of fatalities listed for each characteristic is the number of fatalities with known values for lighting condition and known values for the given characteristic. Fatalities with an unknown value for either variable are excluded from this table.
Most pedestrian fatalities occur at non-intersection locations (81%) (Table 4). Locations away from intersections are also overrepresented in fatalities during darkness (76%). Looking in more detail at intersection locations, pedestrian fatalities are more likely to occur on the far side of intersections (58%) than the near side (42%). However, pedestrian fatalities on the near side of intersections are more likely to occur in darkness (74% on the near side versus 61% on the far side). Marked crosswalk locations have far fewer pedestrian fatalities than other locations, as marked crosswalks account for less than 11% of all fatalities. Marked crosswalk fatalities are also less likely to be in darkness than other fatalities (56% versus 76%, respectively). We do not know the amount of pedestrian activity at marked crosswalks versus other locations, so we cannot compare the risk of these different crossing types.
Most pedestrian fatalities occur in the roadway (89%) rather than on driveways, sidewalks, and other non-roadway locations (Table 4). In-road pedestrian fatalities are much more likely to occur during darkness (77%) than pedestrian fatalities that happen in other locations (45%). This could be due to in-road locations being associated with higher vehicle approach speeds (and less reaction time) than driveway or other fatality locations. It could also be associated with roadway lighting being focused near intersections, driveways, or at the sides of roads rather than in the middle of the road. However, these are theories that require more detailed assessment.
Overall, pedestrian fatalities are most common along arterial roadways (69% of fatalities), roadways with four or more lanes (61% of fatalities), and roadways with 35 to 50 mph speed limits (53% of fatalities) (Table 4). These roadway characteristics are often found simultaneously on major thoroughfares, many of which are part of the national and state highway networks and are under the jurisdiction of state DOTs. These common roadway characteristics are also overrepresented in darkness-related fatalities. Pedestrian fatalities on roadways with higher speed limits are more likely to occur in darkness, ranging from 55% in darkness on roadways with speed limits of 30 mph or lower to 81% on roadways with speed limits of 55 mph or higher. Approximately 67% of pedestrian fatalities on roadways with three or fewer lanes occur in darkness, but this proportion increases to 80% in darkness on roadways with four or more lanes. Local roadways have less than 60% of their pedestrian fatalities occur at night, a much lower percentage than arterial roadways (76% in darkness) and freeways (81% in darkness).
Table 4. Overall Prevalence of Specific Characteristics in Pedestrian Fatalities and Proportion of Fatalities with Each Characteristic that Occurred in Darkness, 2010 to 2020
| Location and Roadway Characteristics | Number of Pedestrian Fatalities with Characteristic1 | Characteristic as Percentage of Total Pedestrian Fatalities | Percentage of Fatalities with Characteristic that Occurred in Darkness |
|---|---|---|---|
| Intersection Location | 58,886 | 100% | 74.0% |
Intersection | 10,870 | 18.5% | 64.1% |
Non-intersection | 47,889 | 81.3% | 76.3% |
Other | 127 | 0.2% | 41.7% |
| Intersection Leg (2014 to 2020) | 9,242 | 100% | 66.5% |
Near side | 3,844 | 41.6% | 73.8% |
Far side | 5,398 | 58.4% | 61.4% |
| Crosswalk Location | 58,886 | 100% | 74.0% |
In Marked Crosswalk | 6,202 | 10.5% | 55.9% |
Outside of Marked Crosswalk | 52,684 | 89.5% | 76.1% |
| Roadway Location | 58,886 | 100% | 74.0% |
In Road | 52,637 | 89.4% | 77.4% |
Not in Road | 6,249 | 10.6% | 45.2% |
| Speed Limit | 56,505 | 100% | 74.9% |
30 mph or lower | 10,698 | 18.9% | 55.0% |
35 mph to 50 mph | 30,073 | 53.2% | 78.8% |
55 mph or higher2 | 15,734 | 27.8% | 81.2% |
| Number of Lanes | 58,547 | 100% | 74.5% |
3 or fewer | 23,149 | 39.5% | 66.9% |
4 or more | 35,398 | 60.5% | 79.5% |
| Functional Classification | 59,055 | 100% | 74.1% |
Local roadway | 9,385 | 15.9% | 59.2% |
Arterial roadway | 40,571 | 68.7% | 76.1% |
Freeway | 9,099 | 15.4% | 80.9% |
1) The total number of fatalities listed for each characteristic is the number of fatalities with known values for lighting condition and known values for the given characteristic. Fatalities with an unknown value for either variable are excluded from this table.
2) Pedestrian fatalities on freeways are included in this category. Of the 15,734 fatalities on roadways with posted speed limits of 55 mph or higher, 7,840 were on freeways and 7,894 were on other roadways. Of the 7,840 freeway fatalities, 80.9% were in darkness. Of the 7,894 non-freeway fatalities, 81.5% were in darkness.
Passenger cars (46%) and pickup trucks, vans, and SUVs (46%) are involved in similar proportions of overall pedestrian fatalities (Table 5). For context, passenger cars made up slightly more of U.S. household vehicles (50% in 2009 and 2017) than pickup trucks, vans, and SUVs (45% in 2009 and 46% in 2017) (McGuckin and Fucci 2018). These figures do not include commercial vehicles. Pedestrian fatalities involving passenger cars are more likely to occur during darkness (77%) than pickup trucks, vans, and SUVs (71%) or commercial trucks and other heavy vehicles (57%). This may reflect less nighttime use of commercial vehicles in areas with high levels of pedestrian activity. The 2017 NHTS shows that 21% of passenger car miles traveled are between 6 pm and 6 am compared to 19% for pickup trucks, 19% for vans, and 18% for SUVs (FHWA 2017). This finding could also be related to geographic differences in vehicle characteristics (e.g., urban versus rural), where areas with more pedestrian activity at night might have more passenger cars and areas with less pedestrian activity at night might have more large trucks and SUVs. Additional research could help clarify these relationships.
Most pedestrian fatalities occur when vehicles are traveling straight (84%). Straight-traveling vehicle pedestrian fatalities are also overrepresented in darkness (79% of fatalities in darkness). Examining the movements of pedestrians relative to vehicles, most pedestrian fatalities involve a pedestrian traveling perpendicular to the vehicle’s line of travel. More detailed intersection data indicate that pedestrians struck while traveling from the driver’s left to right account for 43% of fatalities, and pedestrians traveling from the driver’s right to left account for 39% of fatalities. Both of these types of interactions are also overrepresented in darkness, with 78% of fatalities involving pedestrians traveling from the driver’s left to right occurring in darkness.
Approximately 35% of pedestrian fatalities are flagged for pedestrian alcohol involvement and 11% are flagged for driver alcohol involvement. Alcohol use by pedestrians is legal but alcohol use by drivers over a given blood alcohol concentration is illegal in all states. This finding is based on analysis of the “DRINKING” variable in FARS (NHTSA 2022), which indicates police-reported alcohol involvement in the fatal crash and therefore reflects the judgement of law enforcement rather than the result of a blood test. We used this variable in the analysis because it is more complete than blood test data. Research has found that driver alcohol usage is positively associated with hit-and-run crashes (described below) (Benson et al. 2017), suggesting that driver alcohol impairment may be underestimated in this sample. Approximately 19% of pedestrian fatalities are flagged for pedestrian drug involvement and 7% are flagged for driver drug involvement. Of these types of pedestrian fatalities, pedestrian alcohol involvement (92% occur in darkness), driver alcohol involvement (82%), and pedestrian drug involvement (88%) are overrepresented at night. Sixty-two percent of pedestrian fatalities that involve a driver with drugs occur in darkness. This does not mean that driver drug involvement is safer for pedestrians at night. Better data on how driver drug use is distributed throughout the daytime versus nighttime would help clarify risk related to this variable.
Nearly 20% of pedestrian fatalities involve hit-and-run drivers (Table 5). These hit-and-run fatalities are overrepresented in darkness: approximately 85% occur in darkness. Reckless driving is cited in approximately 2% of pedestrian fatalities (Table 5). Fifty-five percent of reckless driving pedestrian fatalities occur in darkness.
Table 5. Overall Prevalence of Specific Characteristics in Pedestrian Fatalities and Proportion of Fatalities with Each Characteristic that Occurred in Darkness, 2010 to 2020
| Vehicle, Movement, and Behavior Characteristics | Number of Pedestrian Fatalities with Characteristic1 | Characteristic as Percentage of Total Pedestrian Fatalities | Percentage of Fatalities with Characteristic that Occurred in Darkness |
|---|---|---|---|
| Vehicle Type | 54,605 | 100% | 72.5% |
Passenger car2 | 24,959 | 45.7% | 76.7% |
Pickup truck/Van/Sport utility vehicle3 | 25,071 | 45.9% | 71.0% |
Commercial truck/Heavy vehicle4 | 4,123 | 7.6% | 56.7% |
Other5 | 452 | 0.8% | 62.2% |
| Vehicle Maneuver | 57,776 | 100% | 73.9% |
Straight | 48,269 | 83.5% | 78.8% |
Turning right | 976 | 1.7% | 29.0% |
Turning left | 2,301 | 4.0% | 27.6% |
Negotiating curve | 3,128 | 5.4% | 68.9% |
Other | 3,102 | 5.4% | 52.4% |
| Pedestrian-Vehicle Interaction at Intersections (2014 to 2020) | 7,022 | 100% | 65.5% |
Traveling in same direction6 | 552 | 7.9% | 32.4% |
Traveling in opposite direction6 | 721 | 10.3% | 22.2% |
Pedestrian going from driver’s L to R7 | 2,999 | 42.7% | 78.2% |
Pedestrian going from driver’s R to L7 | 2,750 | 39.2% | 69.7% |
| Pedestrian Alcohol Involvement | 31,063 | 100% | 73.4% |
Alcohol involved | 10,776 | 34.7% | 92.7% |
No alcohol involved | 20,287 | 65.3% | 62.8% |
| Driver Alcohol Involvement | 41,389 | 100% | 73.4% |
Alcohol involved | 4,433 | 10.7% | 81.8% |
No alcohol involved | 36,956 | 89.3% | 72.4% |
| Pedestrian Drug Involvement | 25,237 | 100% | 72.2% |
Drugs involved | 4,841 | 19.2% | 88.3% |
No drugs involved | 20,396 | 80.8% | 68.4% |
| Driver Drug Involvement | 33,198 | 100% | 72.9% |
Drugs involved | 2,174 | 6.5% | 62.1% |
No drugs involved | 31,024 | 93.5% | 73.6% |
| Reckless Driving | 55,381 | 100% | 73.2% |
Yes | 1,315 | 2.4% | 55.0% |
No | 54,066 | 97.6% | 73.7% |
| Hit-and-Run Driver | 59,717 | 100% | 74.0% |
Yes | 11,489 | 19.2% | 84.8% |
No | 48,228 | 80.8% | 71.4% |
1) The total number of fatalities listed for each characteristic is the number of fatalities with known values for lighting condition and known values for the given characteristic. Fatalities with an unknown value for either variable are excluded from this table.
2) Passenger Car is classified as BODY_TYP = 1, 2, 3, 4, 5, 6, 7, 8, 9, and 17 from the FARS database.
3) Pickup Truck/Van/Sport Utility Vehicle is classified as BODY_TYP = 10, 14, 15, 16, 19, 20, 21, 22, 28, 29, 30, 31, 32, 34, 39, 40, 42, 45, 48, 49, and 67 from the FARS database.
4) Commercial Truck or Other Heavy Vehicle is classified as BODY_TYP = 12, 50, 51, 52, 55, 58, 59, 60, 61, 62, 63, 64, 66, 71, 72, 78, and 79 from the FARS database.
5) Other Vehicle Type is classified as BODY_TYP = 11, 13, 33, 41, 65, 68, 73, 80-89, and 90-97 from the FARS database.
6) Fatal crashes involving the pedestrian and vehicle traveling in either the same initial or opposite initial direction occurred in the far side crosswalk when a vehicle turned left or right. For example, if a northbound pedestrian was struck by an initially northbound vehicle that was turning left to go west, it was classified as “Pedestrian and Vehicle Traveling Same Direction.” If a southbound pedestrian was struck by an initially northbound vehicle that was turning left to go west, it was classified as “Pedestrian and Vehicle Traveling in Opposite Direction.”
7) Fatal crashes involving the pedestrian intersecting the vehicle path from left to right or right to left occurred in either the near side crosswalk for vehicles going straight, left, or right or the far side crosswalk for vehicles going straight.
Seventy-two percent of pedestrian fatalities involve people between age 20 and 64 (Table 6). The highest proportions of fatalities in darkness involve pedestrians between age 20 and 44, with more than 80% of those pedestrian fatalities occurring in darkness. Child pedestrians (younger than age 15) and older adults (older than age 64) are underrepresented in fatalities during darkness. Drivers aged 20 to 34 account for the largest shares of pedestrian fatalities (13% for ages 20 to 24 and 22% for ages 25 to 34). Drivers in the 20 to 24 and 25 to 34 age groups also have the highest proportions of pedestrian fatalities in darkness (76% and 75%, respectively). As described earlier, there is very likely an exposure element associated with age groups that are and are not more likely to be walking or driving at night.
Male pedestrians and male drivers account for more than twice as many pedestrian fatalities as their female counterparts (Table 6). Male pedestrians are also more likely to be killed in darkness (76%) than female pedestrians (68%). Some of this disparity could be explained by exposure since the 2017 NHTS shows that 24% of male pedestrian trips are between 6 pm and 6 am compared to 21% of female pedestrian trips (FHWA 2017). Overall, male drivers are more likely than female drivers to kill pedestrians (male drivers account for 71% of pedestrian fatalities). The disparity between male driver and female driver involvement in nighttime pedestrian fatalities is smaller, with 73% of male and 71% of female driver-involved pedestrian fatalities occurring in darkness. One possible reason for this result could be that male drivers are riskier at night around pedestrians. Another could be that males generally drive more at night. According to the 2017 NHTS, men did a greater proportion of their daily vehicle travel between 6 pm and 6 am (22%) than women (17%) (Federal Highway Administration 2017). More research would help clarify the degree to which these differences between men and women are due to behavior, exposure, or other factors.
More pedestrian fatalities involve pedestrians who are White (53%), Black (20%), and Hispanic/Latino (20%) than other racial and ethnic groups (Table 6). Other studies show that American Indian/Alaska Native, Black, and Hispanic/Latino pedestrians are overrepresented while White pedestrians are underrepresented in pedestrian fatalities on a per capita basis (Sanders and Schneider 2022). Pedestrian fatalities among American Indian/Alaska Native (86% in darkness), Black (80% in darkness), and Hispanic/Latino (75% in darkness) groups are all overrepresented in darkness.
There are likely exposure-related factors for differences in sex, race, and ethnicity that we are unable to tease out from the FARS data. However, it is unlikely that exposure alone explains these disparities (Sanders and Schneider 2022).
Table 6. Overall Prevalence of Specific Characteristics in Pedestrian Fatalities and Proportion o Fatalities with Each Characteristic that Occurred in Darkness, 2010 to 2020
| Demographic Characteristics | Number of Pedestrian Fatalities with Characteristic1 | Characteristic as Percentage of Total Pedestrian Fatalities | Percentage of Fatalities with Characteristic that Occurred in Darkness |
|---|---|---|---|
| Pedestrian Age | 59,315 | 100% | 73.9% |
0 to 4 | 843 | 1.4% | 27.8% |
5 to 9 | 693 | 1.2% | 30.5% |
10 to 14 | 892 | 1.5% | 49.7% |
15 to 19 | 2,501 | 4.2% | 79.7% |
20 to 24 | 4,367 | 7.4% | 86.3% |
25 to 34 | 8,906 | 15.0% | 85.1% |
35 to 44 | 8,402 | 14.2% | 82.9% |
45 to 54 | 10,552 | 17.8% | 79.9% |
55 to 64 | 10,469 | 17.6% | 74.4% |
65 to 74 | 6,020 | 10.1% | 62.5% |
75 and older | 5,670 | 9.6% | 47.5% |
| Driver Age | 52,921 | 100% | 72.2% |
15 to 19 | 3,124 | 5.9% | 72.9% |
20 to 24 | 6,935 | 13.1% | 76.1% |
25 to 34 | 11,765 | 22.2% | 74.5% |
35 to 44 | 9,189 | 17.4% | 72.7% |
45 to 54 | 8,790 | 16.6% | 72.2% |
55 to 64 | 7,321 | 13.8% | 71.8% |
65 to 74 | 3,831 | 7.2% | 66.9% |
75 and over | 1,942 | 3.7% | 52.2% |
| Pedestrian Sex | 59,632 | 100% | 74.0% |
Female | 18,023 | 30.2% | 68.3% |
Male | 41,609 | 69.8% | 76.4% |
| Driver Sex | 53,153 | 100% | 72.2% |
Female | 15,327 | 28.8% | 70.6% |
Male | 37,826 | 71.2% | 72.8% |
| Pedestrian Race/Ethnicity | 54,485 | 100% | 74.4% |
White | 28,976 | 53.2% | 72.0% |
Black | 10,878 | 20.0% | 80.4% |
Asian | 1,541 | 2.8% | 56.0% |
American Indian or Alaska Native | 1,181 | 2.2% | 85.9% |
Pacific Islander | 615 | 1.1% | 74.3% |
Hispanic/Latino | 10,809 | 19.8% | 75.3% |
Multiple Races/Other Race | 485 | 0.9% | 75.8% |
1) The total number of fatalities listed for each characteristic is the number of fatalities with known values for lighting condition and known values for the given characteristic. Fatalities with an unknown value for either variable are excluded from this table.
Method: Multivariate Statistical Analysis
We used multivariate statistical modeling to identify specific characteristics that had a significant association with pedestrian fatalities occurring in darkness versus daylight. Our analysis also quantified the odds of a pedestrian fatality with a specific characteristic occurring during darkness rather than daylight, all else equal. This modeling approach involved two steps: random forest analysis and binomial logistic regression modeling.
Random Forest Analysis
First, we prepared a database of more than 100 explanatory variables that could potentially be related to pedestrian fatalities occurring at night. We were initially concerned that this large number of variables might be impractical to work with and could have resulted in some variables showing statistical significance by random chance. Additionally, some of these variables were correlated, so we wanted to avoid including them in the same model. We used random forest analysis as a screening step to identify which of the FARS database variables might be the most important to include in our multivariate models. This was an early exploratory step, and we ultimately tested combinations of all variables in the binomial logistic regression modeling process.
Important variables identified by the random forest analysis included crashes occurring in the roadway, pedestrian and driver drinking and drug use, driver distraction, hit-and-run crash, vehicle traveling straight, speed limit less than 25 mph, pedestrian age (under age 16 and over age 64), day of week (Friday overnight and Saturday overnight), and season of year (October through December). Random forest analysis identifies the potential importance of a variable for predicting whether or not a pedestrian fatality occurs in darkness; it does not indicate the direction of the relationship (i.e., some of these variables could have positive associations with darkness while others could have negative associations with darkness).
Binomial Logistic Regression Modeling
Second, we used binomial logistic regression models to identify the significance and magnitude of relationships between specific variables and fatal pedestrian crashes occurring during darkness rather than daylight. Each multivariate model controls for the simultaneous influence of the full range of variables that are included in the model.
We estimated four sets of models and present final versions of each model in the results section (Table 7). Each model is shown as a main column in the table. Model 1 (n = 59,780) uses the entire dataset of pedestrian fatalities reported between 2010 and 2020. Model 2 is the subset of pedestrian fatalities that occurred at non-intersection locations (n = 47,889), and Model 3 is the subset of pedestrian fatalities that occurred at intersections (n = 10,870). Model 4 is estimated from a database of crashes that occurred at intersections from 2014 to 2020 (n = 7,224). This seven-year dataset incorporates pedestrian circumstance variables that were not available in the FARS database until 2014.
The total number of fatal pedestrian crashes used in each model (n) and an overall model Akaike information criterion (AIC) are listed at the top of each model column. The odds ratio for each variable (derived by taking e to the power of the estimated parameter), 95% confidence interval for the odds ratio, and statistical significance of the parameter estimate (Z-value) are given in the rows of the table. Asterisks indicate statistical significance at the 99.9% level (***), 99% level (**), and 95% level (*). Lower-script dots indicate parameter estimates that are significant at the 90% level (.).
The FARS database has missing or unknown values for several variables. We controlled for these missing values by incorporating missing value indicator (dummy) variables into the models. Not controlling for missing values appropriately could lead to systematic bias in the estimated effects of particular variables. For example, many hit-and-run crashes do not include information about driver characteristics, such as the driver drinking. Treating an unknown driver drinking value as zero (indicating “not drinking”) would likely bias the results to show that driver drinking at night is less prevalent than it is in reality. Controlling for missing values provides more accurate estimates of the association between known driver drinking and pedestrian fatalities at night.
We examined correlations between explanatory variables to avoid model estimation problems due to multicollinearity. Several pairs of missing value indicator variables were highly correlated (|p| > 0.7). These pairs were among the variables representing missing pedestrian drinking, missing pedestrian drug use, missing driver drinking, missing driver drug use, missing driver age, missing driver sex, and missing vehicle type. (Missing values for driver age, driver sex, driver drinking, driver drug use, and vehicle type also had high correlations with hit-and-run crashes, but they were below the |p| > 0.7 threshold.) However, the estimated coefficients for these variables were not central to the results, so we kept each of these variables to provide the most complete set of controls for missing values. The only other variables that were highly correlated were the interactions of arterial functional classification and traffic control (arterial × signal, arterial × stop sign, arterial × other, arterial × missing) and the corresponding traffic control variables (signal, stop sign, arterial, and other). We accepted this high correlation in order to better understand how different types of traffic control along arterials were associated with pedestrian fatalities during darkness.
Finally, we developed a separate model comparing factors associated with pedestrian fatalities that occurred between 2015 and 2019 with those that occurred between 2010 and 2014. We used darkness as an explanatory variable in these models. This allowed us to test whether or not darkness had a significant relationship with the increase in pedestrian fatalities during the 2010s, after controlling for a large set of other explanatory variables. Appendix C shows that darkness had a significant positive relationship with the increase in pedestrian fatalities over the last decade.
Findings: Variables Associated with Pedestrian Fatalities During Darkness
Many of the explanatory variables in our four binomial logistic regression models had statistically significant relationships with pedestrian fatalities occurring during darkness rather than daylight, dawn, or dusk (Table 7). Overall, the following variables had the strongest relationships with nighttime pedestrian fatalities (odds ratios generally greater than two): October through December time period, rainy weather, crashes occurring in the roadway at non-intersection locations, roadways with higher posted speed limits, drivers going straight (rather than turning), pedestrians and drivers drinking, and pedestrians who were age 16 to 64 (rather than children or older adults).
Several of these variables likely reflect the influence of exposure, as discussed earlier. For example, October through December have more hours of darkness than daylight in the United States. People are probably more likely to drink alcohol in the evening hours, which correspond with darkness. Children and older adults are probably less likely to be walking at night than people who are aged 16 to 64. However, reliable national data on how much pedestrian and driving activity occurs during different time periods, is associated with drinking, and is done by people of different ages, is unavailable.
Within the context of this limitation, we describe statistically significant model results for temporal, weather, location, roadway, vehicle, movement, behavior, and demographic variables in more detail below.
Table 7. Binomial Logistic Regression Model Results: Variables Associated with Pedestrian Fatalities During Darkness
| TABLE PART 1: Temporal, Weather, and Location Variables | Model 1: All Pedestrian Fatalities (2010-2020) | Model 2: Pedestrian Fatalities at Non-Intersection Locations (2010-2020) | Model 3: Pedestrian Fatalities at Intersection Locations (2010-2020) | Model 4: Pedestrian Fatalities at Intersection Locations (2014-2020) | ||||||||||||
|---|---|---|---|---|---|---|---|---|---|---|---|---|---|---|---|---|
| 95% CI | 95% CI | 95% CI | 95% CI | |||||||||||||
| Variable | Odds Ratio | 2.5% | 97.5% | Sig. | Odds Ratio | 2.5% | 97.5% | Sig. | Odds Ratio | 2.5% | 97.5% | Sig. | Odds Ratio | 2.5% | 97.5% | Sig. |
| Intercept | 0.52 | 0.42 | 0.64 | *** | 0.31 | 0.24 | 0.40 | *** | 2.34 | 1.48 | 3.71 | *** | 2.66 | 1.29 | 5.54 | ** |
| Year (base = 2010 for Models 1, 2, and 3; base = 2014 for Model 4) | ||||||||||||||||
| 2011 | 1.04 | 0.93 | 1.16 | 0.99 | 0.87 | 1.12 | 1.24 | 0.98 | 1.57 | . | ||||||
| 2012 | 1.04 | 0.93 | 1.16 | 0.98 | 0.86 | 1.11 | 1.24 | 0.98 | 1.56 | . | ||||||
| 2013 | 1.02 | 0.91 | 1.13 | 0.99 | 0.88 | 1.13 | 1.12 | 0.89 | 1.41 | |||||||
| 2014 | 1.02 | 0.91 | 1.14 | 0.96 | 0.84 | 1.09 | 1.29 | 1.02 | 1.63 | * | ||||||
| 2015 | 1.15 | 1.03 | 1.28 | * | 1.10 | 0.97 | 1.24 | 1.39 | 1.10 | 1.76 | ** | 1.06 | 0.84 | 1.33 | ||
| 2016 | 1.19 | 1.07 | 1.32 | ** | 1.12 | 0.99 | 1.27 | . | 1.50 | 1.19 | 1.89 | *** | 1.15 | 0.92 | 1.44 | |
| 2017 | 1.13 | 1.02 | 1.26 | * | 1.07 | 0.94 | 1.21 | 1.43 | 1.14 | 1.81 | ** | 1.12 | 0.90 | 1.41 | ||
| 2018 | 1.28 | 1.15 | 1.43 | *** | 1.20 | 1.06 | 1.36 | ** | 1.66 | 1.31 | 2.10 | *** | 1.26 | 1.00 | 1.58 | . |
| 2019 | 1.23 | 1.10 | 1.36 | *** | 1.15 | 1.02 | 1.30 | * | 1.49 | 1.18 | 1.88 | *** | 1.14 | 0.90 | 1.43 | |
| 2020 | 1.20 | 1.08 | 1.33 | *** | 1.18 | 1.04 | 1.33 | ** | 1.34 | 1.06 | 1.70 | * | 0.98 | 0.78 | 1.24 | |
| Season (base = January to March) | ||||||||||||||||
April to June | 0.59 | 0.55 | 0.63 | *** | 0.62 | 0.57 | 0.67 | *** | 0.49 | 0.42 | 0.57 | *** | 0.50 | 0.42 | 0.60 | *** |
July to September | 0.64 | 0.60 | 0.68 | *** | 0.66 | 0.61 | 0.71 | *** | 0.55 | 0.48 | 0.64 | *** | 0.56 | 0.47 | 0.66 | *** |
October to December | 1.22 | 1.15 | 1.30 | *** | 1.25 | 1.17 | 1.34 | *** | 1.14 | 1.00 | 1.30 | * | 1.16 | 0.99 | 1.35 | . |
| Weekday (base = Monday)1 | ||||||||||||||||
Sunday | 0.99 | 0.91 | 1.08 | 1.02 | 0.93 | 1.12 | 0.89 | 0.74 | 1.07 | 0.94 | 0.75 | 1.18 | ||||
Tuesday | 0.99 | 0.92 | 1.08 | 1.00 | 0.91 | 1.09 | 0.94 | 0.79 | 1.12 | 0.95 | 0.76 | 1.18 | ||||
Wednesday | 0.98 | 0.91 | 1.07 | 1.00 | 0.91 | 1.10 | 0.92 | 0.77 | 1.09 | 0.89 | 0.72 | 1.10 | ||||
Thursday | 1.08 | 0.99 | 1.17 | . | 1.09 | 0.99 | 1.19 | . | 0.99 | 0.83 | 1.18 | 0.88 | 0.71 | 1.09 | ||
Friday | 1.39 | 1.28 | 1.50 | *** | 1.42 | 1.30 | 1.56 | *** | 1.27 | 1.07 | 1.51 | ** | 1.26 | 1.02 | 1.56 | * |
Saturday | 1.59 | 1.46 | 1.73 | *** | 1.62 | 1.47 | 1.78 | *** | 1.42 | 1.18 | 1.72 | *** | 1.31 | 1.03 | 1.65 | * |
Missing value | 1.29 | 0.85 | 2.00 | 1.52 | 0.94 | 2.55 | 0.98 | 0.33 | 3.10 | 0.74 | 0.22 | 2.78 | ||||
| Weather (base = Clear) | ||||||||||||||||
Cloudy | 1.05 | 0.99 | 1.12 | 1.00 | 0.93 | 1.08 | 1.24 | 1.07 | 1.44 | ** | 1.22 | 1.01 | 1.46 | * | ||
Rainy | 2.08 | 1.90 | 2.28 | *** | 1.82 | 1.64 | 2.02 | *** | 3.04 | 2.51 | 3.68 | *** | 2.87 | 2.27 | 3.66 | *** |
Other | 1.41 | 1.21 | 1.64 | *** | 1.29 | 1.09 | 1.53 | ** | 2.02 | 1.34 | 3.09 | *** | 2.13 | 1.21 | 3.92 | * |
Missing value | 0.96 | 0.85 | 1.09 | 0.92 | 0.79 | 1.06 | 1.09 | 0.84 | 1.42 | 1.07 | 0.82 | 1.40 | ||||
| Intersection location (base = no)2 | ||||||||||||||||
Yes | 1.09 | 1.01 | 1.18 | * | ||||||||||||
| In Road (base = no)2 | ||||||||||||||||
Yes | 3.09 | 2.73 | 3.49 | *** | 4.86 | 4.18 | 5.66 | *** | 0.95 | 0.73 | 1.24 | 1.09 | 0.73 | 1.62 | ||
| Crosswalk (base = no)2 | ||||||||||||||||
Yes | 0.64 | 0.58 | 0.70 | *** | 0.53 | 0.43 | 0.66 | *** | 0.72 | 0.64 | 0.81 | *** | 0.72 | 0.62 | 0.84 | *** |
| Shoulder (base = no)2 | ||||||||||||||||
Yes | 0.70 | 0.60 | 0.81 | *** | 1.08 | 0.91 | 1.28 | |||||||||
| Sidewalk (base = no)2 | ||||||||||||||||
Yes | 0.53 | 0.44 | 0.64 | *** | 0.80 | 0.65 | 0.98 | * | ||||||||
| Other location (base = no)2 | ||||||||||||||||
Yes | 0.71 | 0.46 | 1.08 | |||||||||||||
| Missing location | ||||||||||||||||
Yes | 1.97 | 1.60 | 2.43 | *** | ||||||||||||
| Work Zone (base = no) | ||||||||||||||||
Yes | 0.51 | 0.44 | 0.59 | *** | 0.49 | 0.42 | 0.57 | *** | 0.62 | 0.39 | 1.00 | * | 0.62 | 0.35 | 1.13 | |
Missing value3 | 0.72 | 0.12 | 4.83 | 0.82 | 0.05 | 29.97 | 0.00 | |||||||||
| TABLE PART 3: Behavior and Demographic Variables | Model 1: All Pedestrian Fatalities (2010-2020) | Model 2: Pedestrian Fatalities at Non-Intersection Locations (2010-2020) | Model 3: Pedestrian Fatalities at Intersection Locations (2010-2020) | Model 4: Pedestrian Fatalities at Intersection Locations (2014-2020) | ||||||||||||
| Pedestrian Drinking (base = no) | ||||||||||||||||
|
Yes |
3.68 | 3.37 | 4.02 | *** | 3.78 | 3.43 | 4.18 | *** | 3.42 | 2.78 | 4.23 | *** | 2.98 | 2.31 | 3.88 | *** |
|
Missing value |
1.46 | 1.35 | 1.59 | *** | 1.54 | 1.40 | 1.69 | *** | 1.14 | 0.95 | 1.37 | 1.10 | 0.86 | 1.41 | ||
| Pedestrian Drugs (base = no) | ||||||||||||||||
|
Yes |
1.61 | 1.45 | 1.80 | *** | 1.57 | 1.40 | 1.77 | *** | 1.64 | 1.25 | 2.16 | *** | 1.70 | 1.26 | 2.32 | *** |
|
Missing value |
1.06 | 0.97 | 1.15 | 1.01 | 0.92 | 1.11 | 1.30 | 1.07 | 1.57 | ** | 1.33 | 1.04 | 1.72 | * | ||
| Hit and Run (base = no) | ||||||||||||||||
|
Yes |
1.92 | 1.76 | 2.09 | *** | 1.92 | 1.75 | 2.12 | *** | 1.90 | 1.56 | 2.32 | *** | 1.75 | 1.38 | 2.24 | *** |
|
Missing value |
1.52 | 0.80 | 3.08 | 3.18 | 1.09 | 11.87 | . | 1.50 | 0.21 | 12.74 | 0.39 | 0.01 | 5.85 | |||
| Speeding (base = no) | ||||||||||||||||
|
Yes |
0.65 | 0.60 | 0.71 | *** | 0.65 | 0.59 | 0.71 | *** | 0.69 | 0.57 | 0.83 | *** | 0.69 | 0.55 | 0.88 | ** |
|
Missing value |
0.79 | 0.71 | 0.88 | *** | 0.77 | 0.67 | 0.87 | *** | 0.88 | 0.69 | 1.13 | 0.91 | 0.69 | 1.22 | ||
| Driver Drinking (base = no) | ||||||||||||||||
|
Yes |
2.44 | 2.21 | 2.71 | *** | 2.50 | 2.23 | 2.80 | *** | 2.15 | 1.69 | 2.77 | *** | 2.10 | 1.54 | 2.89 | *** |
|
Missing value |
0.89 | 0.83 | 0.96 | ** | 0.85 | 0.78 | 0.93 | *** | 1.01 | 0.85 | 1.19 | 1.05 | 0.84 | 1.31 | ||
| Driver Drugs (base = no) | ||||||||||||||||
|
Yes |
0.64 | 0.57 | 0.72 | *** | 0.62 | 0.55 | 0.70 | *** | 0.87 | 0.65 | 1.18 | 0.75 | 0.53 | 1.08 | ||
|
Missing value |
1.03 | 0.96 | 1.11 | 1.07 | 0.98 | 1.16 | 0.94 | 0.80 | 1.10 | 0.87 | 0.71 | 1.08 | ||||
| Reckless Driving (base = no) | ||||||||||||||||
|
Yes |
0.65 | 0.57 | 0.75 | *** | 0.65 | 0.56 | 0.77 | *** | 0.84 | 0.58 | 1.22 | 0.70 | 0.45 | 1.09 | ||
|
Missing value |
1.13 | 1.02 | 1.26 | * | 1.13 | 1.00 | 1.29 | . | 1.07 | 0.85 | 1.36 | 1.00 | 0.75 | 1.32 | ||
| Pedestrian Age (base = 16 to 64 years) | ||||||||||||||||
|
Younger than 16 years |
0.26 | 0.24 | 0.29 | *** | 0.25 | 0.23 | 0.28 | *** | 0.30 | 0.24 | 0.37 | *** | 0.26 | 0.19 | 0.35 | *** |
|
Older than 64 years |
0.45 | 0.43 | 0.48 | *** | 0.46 | 0.44 | 0.49 | *** | 0.45 | 0.40 | 0.50 | *** | 0.46 | 0.41 | 0.53 | *** |
|
Missing value |
0.87 | 0.67 | 1.14 | 0.92 | 0.68 | 1.25 | 0.62 | 0.35 | 1.14 | 0.59 | 0.30 | 1.17 | ||||
| Pedestrian Sex (base = Male) | ||||||||||||||||
|
Female |
0.93 | 0.88 | 0.97 | ** | 0.99 | 0.93 | 1.04 | 0.76 | 0.69 | 0.84 | *** | 0.77 | 0.68 | 0.87 | *** | |
|
Missing value |
0.83 | 0.53 | 1.31 | 0.88 | 0.52 | 1.53 | 0.81 | 0.33 | 2.13 | 0.83 | 0.33 | 2.23 | ||||
| Pedestrian Race/Ethnicity (base = Non-Hispani White) | ||||||||||||||||
|
Black |
1.32 | 1.24 | 1.40 | *** | 1.29 | 1.21 | 1.39 | *** | 1.43 | 1.23 | 1.67 | *** | 1.35 | 1.12 | 1.62 | ** |
|
American Indian/Alaska Native |
1.38 | 1.14 | 1.67 | *** | 1.29 | 1.05 | 1.59 | * | 1.68 | 1.01 | 2.95 | . | 1.89 | 1.02 | 3.75 | . |
|
Asian |
0.87 | 0.77 | 0.99 | * | 0.98 | 0.83 | 1.15 | 0.76 | 0.61 | 0.94 | * | 0.83 | 0.64 | 1.08 | ||
|
Pacific Islander |
1.44 | 1.16 | 1.79 | ** | 1.38 | 1.07 | 1.80 | * | 1.60 | 1.06 | 2.45 | * | 1.65 | 1.02 | 2.70 | * |
|
Non-Hispanic unknown race |
1.11 | 0.75 | 1.66 | 1.26 | 0.80 | 2.06 | 0.74 | 0.33 | 1.66 | 0.71 | 0.30 | 1.76 | ||||
|
Hispanic/Latino |
1.09 | 1.02 | 1.15 | ** | 1.12 | 1.04 | 1.20 | ** | 1.04 | 0.91 | 1.18 | 1.15 | 0.98 | 1.36 | . | |
|
Multiple or other race |
1.07 | 0.85 | 1.35 | 1.20 | 0.91 | 1.60 | 0.80 | 0.50 | 1.26 | 0.99 | 0.56 | 1.79 | ||||
|
Missing value |
0.98 | 0.91 | 1.06 | 0.94 | 0.86 | 1.03 | 1.07 | 0.91 | 1.26 | 1.18 | 0.95 | 1.48 | ||||
| Driver Age (base = 15 to 19 years) | ||||||||||||||||
|
20 to 24 years |
1.01 | 0.90 | 1.13 | 1.05 | 0.93 | 1.19 | 0.84 | 0.64 | 1.10 | 1.03 | 0.73 | 1.44 | ||||
|
25 to 34 years |
0.97 | 0.88 | 1.08 | 1.01 | 0.90 | 1.14 | 0.80 | 0.62 | 1.03 | . | 0.92 | 0.67 | 1.26 | |||
|
35 to 44 years |
0.93 | 0.83 | 1.04 | 0.98 | 0.87 | 1.11 | 0.71 | 0.55 | 0.92 | * | 0.86 | 0.62 | 1.18 | |||
|
45 to 54 years |
0.93 | 0.83 | 1.03 | 0.96 | 0.85 | 1.09 | 0.80 | 0.62 | 1.04 | . | 0.86 | 0.62 | 1.19 | |||
|
55 to 64 years |
0.95 | 0.85 | 1.07 | 1.00 | 0.88 | 1.14 | 0.77 | 0.59 | 1.00 | * | 0.84 | 0.60 | 1.16 | |||
|
65 years or older |
0.63 | 0.56 | 0.71 | *** | 0.63 | 0.55 | 0.72 | *** | 0.60 | 0.46 | 0.78 | *** | 0.67 | 0.49 | 0.93 | * |
|
Missing value |
0.70 | 0.51 | 0.97 | * | 0.66 | 0.46 | 0.96 | * | 0.90 | 0.44 | 1.91 | 1.06 | 0.46 | 2.53 | ||
| Driver Sex (base = Male) | ||||||||||||||||
|
Female |
0.81 | 0.77 | 0.86 | *** | 0.82 | 0.78 | 0.87 | *** | 0.76 | 0.68 | 0.85 | *** | 0.76 | 0.67 | 0.88 | *** |
|
Missing value |
1.97 | 1.44 | 2.68 | *** | 2.28 | 1.58 | 3.25 | *** | 1.30 | 0.63 | 2.60 | 1.40 | 0.60 | 3.10 | ||
|
|
||||||||||||||||
| Model sample size (n)5 | 5978 | 47889 | 10870 | 7200 | ||||||||||||
| Model AIC | 5143 | 39866 | 10486 | 6996 | ||||||||||||
1) Days of the week correspond with the 24-hour period from noon for the day listed to 11:59 am the following day (e.g., Friday represents noon on Friday until 11:59 am on Saturday). This is done to ca
2) Missing values for all location-related variables are controlled by the missing location variable. By definition, there are no FARS fatality records with “other location” or “missing location” values i
3) There are only 10 missing values for work zones in the entire FARS pedestrian fatality dataset, so the estimates for this parameter are very small or undefined in Model 3 and Model 4.
4) Missing values for one-way streets are identical to missing values for the number of lanes, so a missing value indicator variable was not included.
5) The model samples exclude FARS pedestrian fatality records that had unknown values for lighting condition.
Temporal Characteristics
After controlling for all other variables, the odds of a pedestrian fatality occurring in darkness increased over time. The odds of a pedestrian fatality being in darkness increased steeply in the mid-2010s, and highest odds of a pedestrian fatality being in darkness were during 2018 (28% higher than 2010 in the model with all pedestrian fatalities). The odds ratios for 2019 and 2020 decreased slightly but were still higher than 2010 in all three models that covered the full study period.
These year-specific variables allow us to organize the otherwise unexplained variation in our models temporally. There are a number of important factors that could affect the proportion of pedestrian fatalities that occur in darkness, but we do not have data to represent. Importantly, these unmeasured factors could have shifted in the last 10 years. For example, the distribution of pedestrian volume during night vs. day could have increased (due to changing employment shift hours), traffic volumes at night vs. day could have increased (due to increased nighttime TNC use), or the prevalence of driver distraction or blinding from in-vehicle screens could have increased more at night (due to vehicle entertainment system changes). We were not able to measure these factors directly, but finding that the likelihood of nighttime pedestrian fatalities became higher during particular years when some of these changes were probably happening provides insight into what further research could explore. For example, additional studies could try to see if any of the factors mentioned in this paragraph (or others) increased fairly steeply between about 2014-2018.
October through December had the highest odds of pedestrian fatalities at night, with more than twice the likelihood of being at night than April through June. The higher odds of nighttime fatalities are likely due to more hours of darkness during October through December than other times of year.
Fridays overnight (noon on Friday to 11:59 am on Saturday) and Saturdays overnight (noon on Saturday to 11:59 am on Sunday) are more likely to have pedestrian fatalities in darkness than other days of the week. Since the models control for behaviors such as drinking that may be more likely on Friday and Saturday nights, these results likely reflect higher pedestrian and motor vehicle activity during these two nights.
Weather Characteristics
Rain was consistently associated with a higher likelihood of pedestrian fatalities during darkness across all four models (nearly twice as high as clear weather at non-intersection locations and three times as high at intersection locations). A possible explanation for this result is that rain increases roadway glare, and it might make it more difficult for drivers to see through their windshields, especially at night. Rain also decreases roadway friction, increasing the time and space needed for drivers to stop. “Other” conditions associated with pedestrian fatalities at night include snow and sleet, which may have similar effects as rain.
The intersection models showed that cloudy conditions were also significant, but these parameter estimates are less precise and do not have a clear theoretical connection with fatalities at night.
Location Characteristics
The non-intersection model showed that crashes occurring within the roadway were over four times more likely to occur at night versus day than non-roadway locations (such as shoulder, parking lane, driveway, or sidewalk). Nearly all crashes at intersections occur in roadways (regardless of day or night), so this finding did not translate to intersection locations.
Pedestrian fatalities at crosswalks had a significantly lower likelihood of occurring at night than during the day across all four models. This could indicate that crosswalk locations are less risky at night (potentially
due to better lighting, markings, or more predictable or cautious pedestrian and driver behaviors at these locations (e.g., watching for approaching cars or pedestrians at intersections)). It could also be due to fewer pedestrians using crosswalks at night.
Roadway Characteristics
Higher posted speed limits were associated with pedestrian fatalities at night. This relationship was demonstrated by all four models: successively higher speed limit categories had higher odds of pedestrian fatalities during darkness. Compared to roadways with 25 mph speed limits, crashes on roadways with 50 mph or higher speed limits were more than twice as likely to experience pedestrian fatalities at night. Since the model controls for other variables, this probably reflects that drivers are less able to detect and react to pedestrians at a safe stopping distance on higher-speed roadways. In other words, having the same speed limit during the daytime and at night – without other interventions to mitigate the effects of darkness on human cognition and perception-reaction time – leads to pedestrians being killed systematically more often at night the higher the speed limit is set. Our models even show evidence of this effect between 25 mph and 30 mph.
Arterial roadways had a significant association with pedestrian fatalities at night in the non-intersection model, though this functional classification was not significant in the intersection models. Examining interactions between arterial roadways and types of traffic control showed that uncontrolled arterial locations (in the overall model and intersection models) generally had higher odds of nighttime pedestrian fatalities than arterial locations with traffic signals and stop signs. Freeways were positively associated with nighttime pedestrian fatalities in the non-intersection model. Since the models control for other variables such as the number of lanes and speed limits, the significance of arterial roadways and freeways may be due to traffic being proportionally more concentrated on these types of roadways at night than during the day (i.e., local roadway traffic may be more common during the day than at night). Arterial roadways may also have adjacent land uses that attract more nighttime pedestrian activity (e.g., third-shift employment, restaurant, entertainment uses). Still, there may be other characteristics of arterial roadways, such as clear zones or frontage parking lots, that further reinforce auto-centric design and contribute to arterials’ deadly relationship with pedestrian fatalities in darkness.
The freeway finding likely has several contributing factors, given that pedestrians are generally prohibited from walking along or crossing limited access freeways. Some of these pedestrians may be stranded motorists; others, may be people for whom crossing a freeway appears a better option than walking out of the way; still others may be houseless pedestrians who, particularly in recent years, have been allowed to camp on DOT land when prohibited from camping elsewhere, making them extremely exposed to these high-speed, high-volume roadways. Additional research would help clarify these findings.
The traffic signal variable alone (not interacted with arterial) is statistically significant in the model with all pedestrian fatalities, but it is not significant in the intersection models; further research to understand the relationship between signalization and nighttime pedestrian fatalities would be helpful.
Roadways with four or more lanes had a significant association with pedestrian fatalities at night. They had approximately 20% higher odds of nighttime pedestrian fatalities at night than roadways with three or fewer lanes across all four models. Multilane roadways have longer crossing distances for pedestrians, meaning that there is more opportunity for drivers to have difficulty seeing pedestrians in the roadway at night. It may also be more difficult to illuminate the full width of a multilane roadway with adequate street lighting.
Vehicle Characteristics
Pedestrian fatalities involving sedans (i.e., smaller cars) had significantly higher odds of occurring during darkness than larger vehicles. Large commercial trucks are probably more likely to be on roadways during the day than at night. Pickup trucks, vans, and SUVs could possibly be more likely than sedans to be used for daytime work purposes, so they may also have lower odds of pedestrian fatalities at night because of lower exposure. The 2017 NHTS shows that 21% of passenger car miles traveled are between 6 pm and 6 am compared to 19% for pickup trucks, 19% for vans, and 18% for SUVs (FHWA 2017). However, we did not examine commercial versus personal use of vehicles in this analysis, so this hypothesis requires further research. It might also be possible that these larger personal vehicles could have some type of design advantage (e.g., headlights that are higher or at a different angle than smaller cars) that reduces their risk to pedestrians at night. While the possibility of a marginal nighttime safety benefit associated with pickup trucks, vans, and SUVs could be explored through further research, research shows that these heavier vehicles with higher front ends are associated with more severe and fatal injuries to pedestrians overall (Lefler and Gabler 2004). Additionally, SUVs were overrepresented in the increase in pedestrian fatalities that occurred at night when comparing 2010-2017 with 2002-2009 (Ferenchak and Abadi 2021).
Movement Characteristics
Pedestrian fatalities that involve drivers going straight are at least three times more likely than fatalities that involve drivers turning left or right to occur during darkness. This likely reflects the importance of vehicle speed for drivers being able to detect and react to pedestrians in the dark. Since left- and right-turning vehicles tend to travel at slower speeds than those traveling straight, drivers are more likely to have adequate time to see pedestrians at night when they are turning.
We did not find statistically significant differences in the odds of nighttime pedestrian fatalities between near side and far side crosswalks at intersections.
Pedestrian fatalities involving pedestrians and drivers traveling in the same direction prior to the crash were significantly more likely to be at night than during the day. This is likely due to drivers having a harder time seeing pedestrians ahead of them on the roadway during darkness. Given this finding, further human factors research could explore the challenge of visually detecting longitudinal movement versus lateral movement at night.
Pedestrians crossing from left to right in front of a driver were more likely than pedestrians crossing from right to left to be associated with nighttime pedestrian fatalities. While this difference was not statistically significant, this result could add support to the theory that pedestrian visibility at night is diminished by opposing traffic headlights.
Behavior Characteristics
Pedestrian fatalities that involve pedestrians or drivers who were drinking are significantly more likely to be at night. Most models showed that the odds of nighttime pedestrian fatalities were at least three times higher for drinking pedestrians and two times higher for drinking drivers, which is likely related to greater alcohol consumption at night.
Pedestrian drug use is positively associated with pedestrian fatalities at night across all four models. Yet, driver drug use is negatively associated with pedestrian fatalities at night (significant association in the total pedestrian fatality model and non-intersection model but non-significant association in the intersection models). We are not aware of a theoretical explanation for these opposite results for pedestrians and drivers, but further research could help identify possible explanations.
Hit-and-run pedestrian fatalities are significantly more likely to occur during darkness. This may be due to drivers not realizing that they hit a pedestrian (and the difficulty of detecting them in the dark in the first place). It could also relate to some drivers perceiving that they can leave the scene of a crash more easily at night without being identified. As stated earlier, leaving the scene may also be associated with driver impairment, although this information is not directly available in FARS data.
Pedestrian fatalities due to speeding and reckless driving were significantly less likely to be reported during darkness (reckless driving was only significant in the models with all pedestrian fatalities and non-intersection pedestrian fatalities). We think that speeding and reckless driving behaviors would make it more difficult to detect and react to pedestrians at night. However, there may be fewer witnesses observing these behaviors at night, and law enforcement officers may be less likely to record these behaviors due to less clear visual evidence, so these behaviors may be underreported for nighttime pedestrian fatalities. Further research could help to explore this finding.
Demographic Characteristics
After controlling for all other variables, several demographic characteristics of pedestrians and drivers are still associated with higher odds of pedestrian fatalities occurring at night.
Pedestrians younger than age 16 were less than one-third as likely and pedestrians older than age 64 were less than half as likely as pedestrians aged 16 to 64 to be killed at night rather than during the day. This likely reflects that children and older adults are less likely to be walking along and across roadways at night. Male pedestrians were more likely to be killed at night than female pedestrians, especially at intersections. We do not know why intersections seemed to have a stronger relationship with nighttime pedestrian fatalities for males.
Pedestrians who were Black or Pacific Islander (most commonly Native Hawaiian) were significantly more likely to be killed at night in all four models. Hispanic/Latino and American Indian/Alaska Native pedestrians were significantly associated with nighttime fatalities in the models with all fatalities and non-intersection fatalities. The overrepresentation of these racial and ethnic groups may have to do with exposure, such as walking at night for work in service jobs. For instance, higher proportions of Black workers work at night than White workers (Population Reference Bureau 2008; Lieberman et al. 2020). People who are Black also have lower motor vehicle ownership and access (Brumbaugh 2020), which research suggests stems from historic exclusion from many kinds of work (Adkins-Jackson et al. 2022). So, to access third-shift jobs, Black workers may be more likely than White workers to rely on walking or taking the bus in darkness. However, this association may also reflect a more general exposure to less safe roadway conditions due to historical factors like redlining (Roll 2021; Sanders and Schneider 2022). There may also be a relationship between pedestrian safety, lighting effectiveness, and skin tone that additional research could help illuminate.
Pedestrian fatalities involving drivers aged 15 to 19 had significantly higher odds of being at night than those involving drivers older than age 64. This result is unlikely to be due to older drivers being able to see pedestrians better at night. More likely, it could be due to exposure, especially for older drivers who may try to avoid driving at night. The higher likelihood of young drivers being involved in pedestrian fatalities at night could also reflect their inexperience dealing with dark conditions.
Female drivers had 20% lower odds of being involved in a pedestrian fatality during darkness than male drivers. This could indicate that female drivers are less risky at night around pedestrians or that females
generally drive less at night. Further research would help clarify any relationship between driver gender and pedestrian safety outcomes.
Conclusion
We analyzed FARS data from 2010 to 2020 to identify factors associated with pedestrian fatalities during darkness at the national level. Overall pedestrian fatalities increased, and pedestrian fatalities in darkness became more prevalent over this 11-year period. We used separate binomial logit models to examine pedestrian fatalities in darkness overall, at intersections, and at non-intersection locations separately. Our detailed exploration of variables is one of the first to include weather conditions, traffic control along arterial roadways, near side versus far side intersection legs, and pedestrian movement relative to vehicle movement prior to the crash at intersections.
We confirmed many findings from our team’s literature review, including that pedestrian fatalities in darkness are significantly associated with higher-speed conditions (including roadways with higher posted speed limits and drivers going straight), the October through December time period, non-intersection locations, pedestrians and drivers drinking, and pedestrians who were age 16 to 64 (rather than children or older adults).
Many of the factors associated with pedestrian fatalities during darkness reflect differences in exposure. Future studies could account for exposure to quantify the specific underlying risk of roadway, vehicle, movement, or demographic characteristics at night. Still, these findings help further our understanding that higher vehicle speeds are associated with elevated pedestrian fatality risk at night. This association is likely because, under available lighting conditions and above certain speed thresholds, drivers cannot see and react to pedestrians in the roadway in time to avoid hitting them.
Additional study would contribute to a more complete understanding of why specific factors are associated with pedestrian fatalities during darkness. Our NCHRP research team explored many of the significant factors from this macro-level analysis by examining more detailed pedestrian crash data in specific cities, using driver simulation, and conducting focus group interviews, as described in the following sections. Future research on pedestrian safety would be strengthened through incorporating more detailed measurements of lighting conditions at crash (and non-crash) locations, collecting and estimating more detailed pedestrian exposure data by time of day, developing exposure-based nighttime pedestrian safety performance functions, conducting human factors research on driver detection of pedestrians moving longitudinally versus laterally, and observing nighttime driving and walking behavior in naturalistic settings. Lighting condition research could include (but not be limited to) analyzing the fatalities coded under “darkness with streetlights” and “darkness without streetlights” in FARS. We did not explore these lighting condition variable values in this project because these values are subjective and streetlight locations tend to be correlated with urban areas that have higher levels of pedestrian activity (i.e., results would reflect differences in exposure); future research could attempt to address these limitations. A research roadmap to guide nighttime pedestrian safety research would also be helpful.
2.2 Micro-Level Analysis
Background
There is no travel mode more theoretically accessible than walking. It is free, requires no or relatively minimal equipment compared to other modes, and accrues mental, emotional, and physical health benefits. Yet many people and places in the U.S. experience less accessibility, due in part to a lack of safety from traffic, particularly in dark conditions. Despite decades of progress in reducing pedestrian fatalities between 1980 and 2010 (Schneider 2020), a confluence of factors since that time has resulted in increasing pedestrian fatalities, culminating in a 40-year high in pedestrian fatalities in 2021 – of which 76% occurred in dark conditions (Petraglia and Macek 2023). Myriad studies in the past twenty years focused on understanding factors that are associated with fatal and injurious outcomes of motorist-pedestrian crashes, routinely finding darkness as a significant correlate (e.g., Siddiqui et al. 2006; Kim et al. 2010). However, few studies until recently have examined pedestrian safety explicitly in darkness, and those that did (e.g., Sullivan and Flanagan 2002) often used simpler, bivariate analysis to investigate the problem. For example, in their comprehensive review of factors, Tefft et al. (2021) found that 73% of the increase in pedestrian fatalities between 2009 and 2018 occurred in darkness, and that roadway classification (particularly arterials) and posted speed were strongly correlated with the increase in pedestrian fatalities, but the authors did not control for lighting condition when examining other factors.
Other recent studies have sought to understand the significant rise in pedestrian fatalities since 2010 by focusing specifically on dark conditions and using multivariate models to provide insight into the relative importance of certain factors while controlling for others. Several studies have found significant associations between pedestrian fatalities in dark conditions and roadway design and operations (e.g., Sanders et al. 2022; Ferenchak and Abadi 2021), sociodemographic characteristics (e.g., Long and Ferenchak 2021; Sanders and Schneider 2022; Dumbaugh et al. 2023), and land uses such as liquor stores, restaurants, and shopping centers (Long and Ferenchak 2021; Dumbaugh et al. 2023). In other words, while these factors may be associated with pedestrian injuries and fatalities in both daytime and dark conditions, their relationship to injury severity appears to be particularly related to the lighting condition. For example, a pedestrian hit at 45 mph is highly unlikely to survive at any time of day. But if pedestrian fatalities are significantly more likely to occur on 45-mph roadways in dark conditions (Sanders et al. 2022), it would be helpful to understand the root causes of this phenomenon.
This section presents the results of a case-control analysis that builds on recent efforts to examine pedestrian safety specifically in darkness (Sanders et al. 2022; Ferenchak and Abadi 2021; Kumfer et al. 2019). Through this work, we intentionally controlled for the known risk factor of functional street classification to try to further isolate and identify the factors associated with an increased likelihood of a pedestrian fatality or severe injury in dark conditions.
Methodology and Data
Methodology
This study uses a case-control methodology to evaluate the likelihood of certain variables being significantly associated with a fatal or severe pedestrian injury in darkness. Case-control studies originate in the field of public health, where they were developed to analyze rare events (and correspondingly small sample sizes) with additional rigor. In this case, while the overall number of pedestrians who are killed or severely injured in the U.S. has steadily increased in recent years, the number dying or being severely injured in any one year in any one city is relatively small from a statistical perspective, which makes the case-control methodology an attractive option for deeper analysis of the many potential factors associated with these fatalities and severe injuries. This study focuses on motorist-pedestrian crashes from the years 2015-2019 to reflect recent trends, including the steep rise in pedestrian fatalities in the last decade, while precluding pandemic-era effects from clouding the findings. In seeking a balance between statistical rigor and the study timeline and budget, we elected from the outset to gather a sample of 100 cases and 100 controls for each case city.
A key component of case-control studies is selecting an appropriate matching characteristic for the comparison. Cases and controls are selected from datasets matched on certain criteria to ensure that they are sufficiently comparable to provide insights about other variables of interest once they are evaluated in comparison to one another. In addition to being a key aspect of the case-control methodology, this matching helps to prevent the crediting of conclusions to certain variables when they are more substantially related to other, often underlying variables. For example, controlling for functional class while allowing variation in number of lanes and posted speed allows greater insight into the role of the two latter variables when functional class might otherwise dominate in a regression model.
Case-control studies can also provide deeper investigation into known risk factors by controlling for those factors themselves. In this case, research has established that most pedestrian fatalities at night occur along urban arterials, with a disproportionate number at midblock locations. But urban arterials comprise dozens if not hundreds of roadway miles in most urban and suburban areas, and most of those locations do not experience a pedestrian fatality or serious injury, even when they appear to be equally high risk. Thus, this study sought to provide insight into factors associated with a fatal or severe pedestrian injury in darkness by controlling for functional class and then examining if and how various built environment and land use factors differ between locations that have experienced a fatal or severe pedestrian injury in darkness (cases) and matched locations that have not experienced a fatal or severe pedestrian injury in the same timeframe (controls). In this vein, this study used functional classification (primary and secondary arterials and major collectors) and location type (midblock and unsignalized intersections) as the matching criteria. Variables that were not controlled for through matching, including other elements of roadway design and exposure proxies, were then explicitly examined as potential contributors to the outcome of interest (fatal or severe pedestrian crash in darkness).
Case City Selection
Identifying potential case cities
In order to conduct this analysis, we first identified a list of potential case cities for subsequent analysis. To identify this list, we examined the number of pedestrian fatalities in cities across the country and selected the 30 cities with the highest numbers of pedestrian fatalities between 2015-2019 (shown in Table 8) as initial candidates.
Table 8. Top 30 Cities to Examine Pedestrian Safety in Darkness (2010-2020 FARS Data)
| Census Designated Place | State | Total Number of Pedestrian Fatalities | Number of Pedestrian Fatalities in Darkness | Percentage of Pedestrian Fatalities in Darkness | Average Pedestrian Fatalities in Darkness Per Capita | Census Region |
|---|---|---|---|---|---|---|
| New York | NY | 1,365 | 713 | 52% | 0.77 | Northeast |
| Los Angeles | CA | 1,191 | 846 | 71% | 1.97 | West |
| Houston | TX | 827 | 620 | 75% | 2.51 | South |
| Phoenix | AZ | 699 | 540 | 77% | 3.12 | West |
| Dallas | TX | 511 | 390 | 76% | 2.76 | South |
| San Antonio | TX | 501 | 396 | 79% | 2.49 | South |
| Chicago | IL | 448 | 224 | 50% | 0.75 | Midwest |
| Philadelphia | PA | 392 | 240 | 61% | 1.40 | Northeast |
| Detroit | MI | 359 | 271 | 75% | 3.62 | Midwest |
| Jacksonville | FL | 358 | 278 | 78% | 2.89 | South |
| San Diego | CA | 351 | 242 | 69% | 1.60 | West |
| Memphis | TN | 308 | 233 | 76% | 3.27 | South |
| Austin | TX | 280 | 225 | 80% | 2.23 | South |
| Fort Worth | TX | 259 | 211 | 81% | 2.29 | South |
| Indianapolis | IN | 250 | 195 | 78% | 2.07 | Midwest |
| Albuquerque | NM | 237 | 173 | 73% | 2.82 | West |
| Charlotte | NC | 219 | 162 | 74% | 1.79 | South |
| San Jose | CA | 218 | 158 | 72% | 1.43 | West |
| Miami | FL | 213 | 141 | 66% | 2.94 | South |
| Tucson | AZ | 212 | 164 | 77% | 2.79 | West |
| Nashville-Davidson | TN | 212 | 164 | 77% | 2.29 | South |
| El Paso | TX | 192 | 134 | 70% | 1.80 | South |
| Oklahoma City | OK | 191 | 141 | 74% | 2.04 | South |
| Atlanta | GA | 185 | 127 | 69% | 2.49 | South |
| San Francisco | CA | 184 | 87 | 47% | 0.93 | West |
| Fresno | CA | 173 | 143 | 83% | 2.50 | West |
| Tampa | FL | 173 | 135 | 78% | 3.34 | South |
| Sacramento | CA | 171 | 131 | 77% | 2.42 | West |
| Columbus | OH | 164 | 130 | 79% | 1.39 | Midwest |
| Denver | CO | 161 | 112 | 70% | 1.52 | West |
We sent the list to the project panel and received their concurrence to move forward with additional data collection and evaluation to further refine the list.
Evaluating available data
We then conducted a high-level investigation into the presence and type of data available via online search, using the following questions to frame our search:
- Are crash data available for public download?
- – Are pedestrian crashes easily identifiable within the data? To determine this, one may need to download the state’s crash data manual.
- – Are data in a flat file (e.g., one row per crash), or are there multiple files (e.g., for victim, collision, and party) that can be triangulated for more information?
- Are roadway design and operations data available for public download via the target city’s website?
- – If not available for download, is there information on the website that indicates a contact person and willingness to share the data?
- – What data are available, and in what format (e.g., integrated network file v. separate files for number of lanes, signalization, average annual daily traffic (AADT), sidewalks, etc.)?
- – Is there a readily available data dictionary for each dataset?
At the end of this step, we narrowed our case city options from the original 30 to the 16 cities shown in Table 9.
Table 9. Top 16 Cities to Examine Pedestrian Safety in Darkness (2010-2020 FARS Data)
| Census Designated Place | State | Total Number of Pedestrian Fatalities | Number of Pedestrian Fatalities in Darkness | Percentage of Pedestrian Fatalities in Darkness | Average Pedestrian Fatalities in Darkness Per Capita | Census Region |
|---|---|---|---|---|---|---|
| New York | NY | 1,365 | 713 | 52% | 0.77 | Northeast |
| Los Angeles | CA | 1,191 | 846 | 71% | 1.97 | West |
| Houston | TX | 827 | 620 | 75% | 2.51 | South |
| San Antonio | TX | 501 | 396 | 79% | 2.49 | South |
| Chicago | IL | 448 | 224 | 50% | 0.75 | Midwest |
| Philadelphia | PA | 392 | 240 | 61% | 1.40 | Northeast |
| Detroit | MI | 359 | 271 | 75% | 3.62 | Midwest |
| Jacksonville | FL | 358 | 278 | 78% | 2.89 | South |
| San Diego | CA | 351 | 242 | 69% | 1.60 | West |
| Austin | TX | 280 | 225 | 80% | 2.23 | South |
| Fort Worth | TX | 259 | 211 | 81% | 2.29 | South |
| Charlotte | NC | 219 | 162 | 74% | 1.79 | South |
| San Jose | CA | 218 | 158 | 72% | 1.43 | West |
| Miami | FL | 213 | 141 | 66% | 2.94 | South |
| San Francisco | CA | 184 | 87 | 47% | 0.93 | West |
| Sacramento | CA | 171 | 131 | 77% | 2.42 | West |
Digging deeper to determine data quality
The third step in the process included a more detailed look at the presence and type of data available via online search and city contacts where necessary.
Key elements of this investigation included:
- What elements are included in the crash data?
- – Fields for pedestrian pre-crash action/movement and location.
- – Availability of crash severity levels within the data (i.e., are each of the KABCO [a commonly used injury severity scale in police crash reports, with the following values: K = Killed, A = Suspected serious injury, B = Suspected moderate injury, C = Suspected minor injury, O = Property damage only] values available, or are the data aggregated into fatality v. injury v. non-injury?)
- Are roadway design and operations data available for public download via the target city’s website?
- – How are the data coded relative to spatial units?
- – Are the data available network-wide, or are they available in patches throughout the network, e.g., isolated counts?
- – In what format are the data (e.g., tabular, spatial, PDF)?
- – Are there primary keys available for joining the data?
- Are pedestrian and/or bike exposure data (e.g., average annual daily pedestrians (AADP) and/or average annual daily bicyclists (AADB) or counts) available? [While pedestrian safety is the primary concern of this study, bicycle volumes were of interest as a potential proxy for pedestrian activity at this screening stage.]
- – Actual pedestrian and/or bike counts and/or exposure models
- – Pedestrian/bike-specific page with additional information, even if not counts?
- – Is the city represented in the Ped/Bike Data Portal (https://bikeped.trec.pdx.edu/)?
- Other data of interest:
- – Turning movement counts (e.g., as related to intersection timing updates)
- – Vendor data subscriptions (e.g., Streetlight, Strava)
- – Observed speed data
- – Pedestrian-specific infrastructure: sidewalks, curb bulb-outs, median crossing islands, midblock crossings, etc.
We also examined the number of fatal and serious pedestrian injuries specifically in darkness, as well as the number that occurred midblock or at unsignalized locations along arterial or collector streets – the areas of primary interest for our study. Along the way, we encountered barriers to getting crash data in several locations, whether due to a lack of key information within the data or a lack of access. For this reason, several of the top 16 cities fell out of contention and the city of Portland, OR, was added to our finalized list. At the end of this step, we narrowed our case city options from 16 to the six cities listed in Table 10 and began to build the city-specific datasets.
Table 10. Final Six Cities to Examine Pedestrian Safety in Darkness (2014-2020 FARS Data)
| Census Designated Place | State | Number of Pedestrian Fatalities in Darkness | Census Region |
|---|---|---|---|
| Los Angeles | CA | 609 | West |
| Charlotte | NC | 113 | South |
| San Diego | CA | 179 | West |
| Houston | TX | 454 | South |
| Detroit | MI | 181 | Midwest |
| Portland | OR | 65 | West |
Data and Quality Control
After finalizing the six case cities, we created city-specific datasets from a combination of police-reported crashes, manually collected data, city data, open-source data, and publicly available data, as described below.
Creating city-specific datasets
We created the city-specific datasets through a selection of locations that fit certain criteria. For cases, these criteria included:
- Location of a police-reported pedestrian fatality or serious injury during dark conditions between the years 2015-2019
- Location midblock or at unsignalized intersection
- Location along an arterial or collector roadway
For controls, the criteria included:
- Not having been the location of a police-reported pedestrian fatality or serious injury at any point between the years 2015-2019
- Location midblock or at unsignalized intersection
- Location along an arterial or collector roadway
- For midblock locations: block length of at least 200 feet in length
At the outset of the study, we intended to just focus on pedestrian fatalities on urban arterials at midblock locations, based on findings from Tefft et al. (2021) about the predominance of urban arterials and midblock locations for pedestrian fatalities at night. However, upon finding that there were not enough cases for these fairly restrictive criteria within our case cities, we expanded our matching criteria in the following ways:
- We added secondary arterials and major collectors, which have similar characteristics to primary arterials in many cities, and
- We added unsignalized intersection locations, which are often problematic locations for pedestrian safety along arterials due to the driver priority (similar to midblock locations) that is communicated by the lack of signal control for the intersecting street.
Control locations were randomly selected using only the segment that met the above requirements. The final balance between midblock and unsignalized intersections was a 50/50 split.
Each case and control location was treated as a point. For intersections, crashes are often geo-located to the intersection centroid, so that convention was kept for this study. For midblock locations, the midpoint of the segment was selected. When contextualizing the locations, buffers were used for the contextualization process, which varied by attribute.
We also added severe pedestrian injuries to the pedestrian fatalities when needed to increase the sample size. For some cities, the numbers were large enough that we used a random selection within the pool of cases that match the criteria, up to 100 cases. For other cities, we used all available cases to get as close to 100 cases as possible. Control locations were always randomly selected, then assigned a faux “crash year” in proportion to the distribution of years in the case set. Both groups were reviewed for quality control before proceeding with data collection. Our final analysis consisted of 539 cases and 595 controls, for a total of 1134 locations. The distribution of cases and controls by year and by city follows in Table 11 and Table 12. Table 13 shows the distribution of fatal and severe crashes by city.
Table 11. Distribution of Observation Dates by Case-Control Status
| Observation Dates | Case (n = 539) | Control (n = 595) | Total (N = 1,134) |
|---|---|---|---|
| 2015 | 18% | 19% | 18% |
| 2016 | 18% | 18% | 18% |
| 2017 | 20% | 21% | 20% |
| 2018 | 22% | 22% | 22% |
| 2019 | 22% | 20% | 21% |
| Total | 100% | 100% | 99%1 |
1 Total sums to 99% due to rounding.
Table 12. Distribution of Cases and Controls by City
| City | Sample Size | Percentage Cases | Percentage Controls |
|---|---|---|---|
| Charlotte, NC | 176 | 44% | 56% |
| Detroit, MI | 196 | 49% | 51% |
| Houston, TX | 198 | 49% | 51% |
| Los Angeles, CA | 200 | 50% | 50% |
| Portland, OR | 168 | 41% | 59% |
| San Diego, CA | 196 | 49% | 51% |
| Total | 1,134 | 48% | 52% |
Table 13. Distribution of Crashes by Severity and City
| City | Number of Fatal Crashes | Percentage of Fatal Crashes | Number of Severe Crashes | Percentage of Severe Crashes | Number of Crashes Overall | Percentage of Total Crashes |
| Charlotte | 56 | 23% | 26 | 8% | 82 | 15% |
| Detroit | 40 | 16% | 60 | 19% | 100 | 18% |
| Houston | 40 | 16% | 60 | 19% | 100 | 18% |
| Los Angeles | 40 | 16% | 60 | 19% | 100 | 18% |
| Portland | 31 | 13% | 50 | 16% | 81 | 14% |
| San Diego | 40 | 16% | 60 | 19% | 100 | 18% |
| Total | 247 | 100% | 316 | 100% | 563 | 100% |
Due to the need for an adequate size for the analysis, we used all of the cases that were available in most of our case cities. However, we conducted exploratory analysis of the crashes at the case locations to understand if and how the crash types at these locations differed, which could influence our interpretation of results. As Table 14 shows, the majority of the fatal and severe pedestrian injury crashes in our case dataset involved a pedestrian who was crossing the street (76.4%) and a motorist going straight (90%). This distribution was similar by location type (intersection v. midblock). These findings support the case-control approach and the ability to draw broader conclusions from this work.
Table 14. Distribution of Case Crashes by Location Type, Pedestrian Pre-Crash Movement, and Motorist Pre-Crash Movement (Crash Type)1
| Location Type | Pedestrian Pre-Crash Movement | Motorist Pre-Crash Movement | Percentage of Crashes | Number of Crashes |
|---|---|---|---|---|
| Intersection n = 172 (54.6%) | Crossing (36.0%) | Stopped | 0.3% | 1 |
| Straight | 32.5% | 123 | ||
| Turning Left | 1.8% | 7 | ||
| Turning Right | 0.5% | 2 | ||
| Unknown | 0.8% | 3 | ||
| In Road (5.5%) | Straight | 5.0% | 19 | |
| Turning Left | 0.3% | 1 | ||
| Unknown | 0.3% | 1 | ||
| Not in Road (1.0%) | Straight | 1.1% | 4 | |
| Unknown (2.9%) | Straight | 2.4% | 9 | |
| Unknown | 0.5% | 2 | ||
| Intersection Total | 45.4% | 172 | ||
| Midblock n = 207 (45.4%) | Crossing (40.4%) | Entering Traffic | 0.5% | 2 |
| Straight | 39.8% | 151 | ||
| In Road (11.3%) | Entering Traffic | 0.3% | 1 | |
| Straight | 10.8% | 41 | ||
| Turning Left | 0.3% | 1 | ||
| Not in Road (1.0%) | Straight | 0.8% | 3 | |
| Turning Left | 0.3% | 1 | ||
| Unknown (1.8%) | Straight | 1.1% | 4 | |
| Turning Left | 0.3% | 1 | ||
| Unknown | 0.5% | 2 | ||
| Midblock Total | 54.6% | 207 | ||
1 Data from Houston and Charlotte excluded from this table due to lack of usable information about pedestrian actions and driver movements.
Manual data collection
To collect the necessary contextual data for each case and control site, we developed a data collection protocol and used the Fulcrum™ app to help ensure consistency in data collection and input. Project team members were trained on the data collection app, which included up to 37 separate fields for data collection when all fields were applicable. The data collection protocol was designed to gather variables that previous research, including research reviewed through this project’s extensive literature review and our macro-level pedestrian fatal crash analysis, had found to be significantly or likely related to pedestrian crash risk. These variables included roadway design and operations variables that were difficult to find via other reliable data sources, such as number of through and turn lanes, posted speed limit, presence and completeness of sidewalks, presence and type of street lighting, and the presence and type of pedestrian countermeasures. Other variables of primary interest for manual data collection included land use variables related to pedestrian activity, such as the presence and type of housing and commercial uses such as grocery, convenience, and liquor stores. A selection of the data collected at each location is represented in Figure 5; additional data from the manual data collection effort are shown in Table 15 through Table 17.
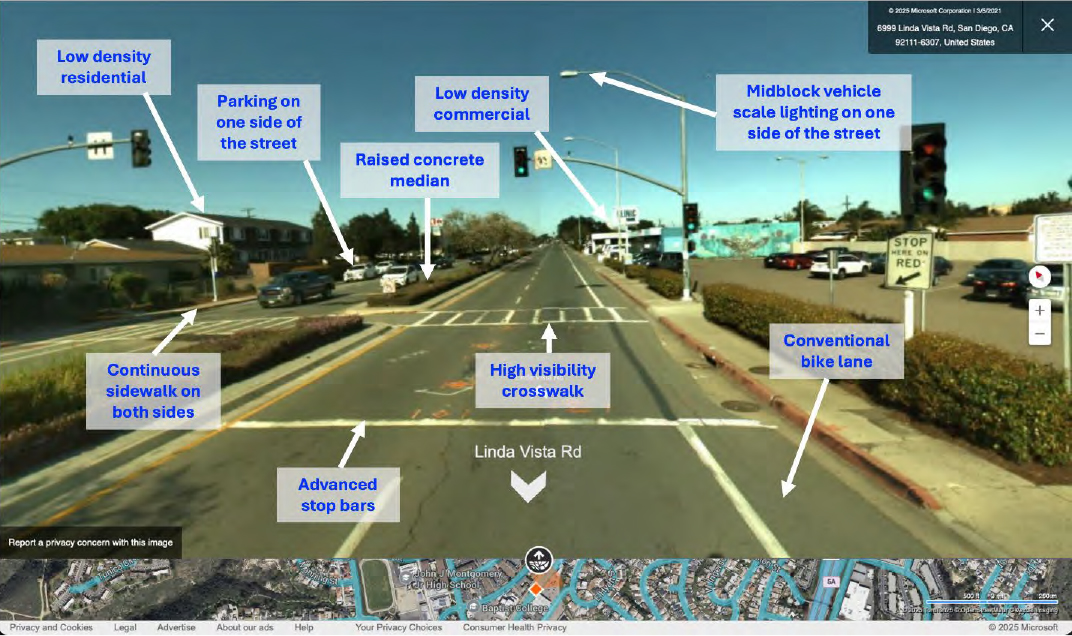
The data collection team was given a set of 60 locations (case/control status was concealed) to pilot-test the data collection process using Google Maps™ and Google Streetview™. Streetview generally contains annual images of the sites, which allowed the data collection process to reflect site conditions at the time of the crash (or the faux crash year, in the case of controls). In the event that an image from the crash year was not available, the team was instructed to use the closest image, with priority given to past, rather than future, years. The team collected a sample of 60 sites, evaluated and slightly revised the data collection protocol, and then proceeded with the remainder of data collection. In the event of construction or other problems with a location, queries were sent to the data analysis team and replacements were generated when possible (i.e., for controls and when there were additional case options).
Quality control
Quality control was conducted in rounds. The first round occurred after the data collection form was piloted on 60 locations. After the data were gathered for the 60 locations, a member of the analysis team reviewed every 10th location to assess the data collection and determine whether the data collection was proceeding as planned. The review effort revealed a couple of fields for which the coding options did not sufficiently cover conditions on the ground. These fields were revised and the data collection team received additional instruction and proceeded with data collection for the remaining sites across the six cities.
The second round of quality control occurred once the data collection was finished. At that point, a member of the analysis team examined every 15th to 20th record in detail to look for discrepancies between the collected data and the data available online. Because each location could have information for up to 37 variables, there were occasional errors, usually in the range of 1 or 2 errors for every few records. When a discrepancy was identified, the project’s research director was brought in for review and made the final determination as to the accurate data collection entry, and the record was updated and noted in the team’s quality control records. Given the extensive nature of the manual data collection, some degree of error is to be expected. While we corrected what we could, it was beyond scope and budget to exhaustively re-review each data record, and variables that were found to be consistently less reliable (generally those being measured via online tools) have been excluded from the analysis in this report. We recorded the discrepancies and corrected records and estimate a manual data collection error rate of less than 3 percent for the full dataset.
Open-source and public data
After completing this QA/QC process, we matched the geocoded location for each record to contextual variables from larger open-source and publicly available datasets to allow for additional analysis. These data included infrastructure data from Open Street Maps (www.openstreetmap.org); data from the Environmental Protection Agency’s Smart Location Database (EPA SLD) (https://www.epa.gov/smartgrowth/smart-location-mapping, 2019 vintage), on housing density, road network density and characteristics, and jobs; sociodemographic data from the U.S. Census American Community Survey (ACS) (https://www.census.gov/, five-year estimates from 2015-2019); transit stop and service data from the General Transit Feed Specification (GTFS) dataset (https://gtfs.org/); and highway performance monitoring system (HPMS) data, which provides information on functional classification, roadway ownership, and AADT
(https://www.fhwa.dot.gov/policyinformation/hpms/fieldmanual/page05.cfm#toc249159691).
All census and EPA SLD values were calculated at the Census block group (CBG) level using an area-weighted proportional aggregation approach for the ½-mile radius around each case and control location. Using GTFS data, service level at each transit stop was estimated using a systematic sample of weekdays and weekends in October for each year of crash data. The number of times a transit vehicle stopped at each stop location per day was tabulated and averaged over all the days in the sample. These data were assigned to case and control locations by aggregation - the distance to nearest stop and the service level estimate for that stop, the count of stops and sum of service level estimates for all stops within 200 feet, and the count of stops and sum of service level estimates for all stops within ¼ mile.
Exposure data
We know that pedestrian exposure plays some role in pedestrian risk – if no pedestrians are in an area, no pedestrians will be hit, regardless of other present risk factors. However, no pedestrian exposure data were available in any of the case cities, so this study used proxies in the form of pedestrian activity generators (e.g., certain land uses, like convenience stores), census variables known to have a relationship with pedestrian activity, such as percentage of residents commuting to work by walking and total
population, and EPA SLD variables related to walking, such as pedestrian network density and the National Walkability Index.
Analysis
To analyze our data, we used a combination of bivariate analysis, random forest regression, and conditional logistic regression (CLR). We evaluated bivariate significance between case-control status and categorical or ordinal variables through Chi-square and Fisher’s exact (for small cell sizes) tests. We examined significance between case-control status and continuous variables using the Wilcox Mann-Whitney test, which is appropriate when distributions are non-normal. Random forest models were used to help with data reduction and to hone the modeling approach.
CLR is the standard modeling method for case-control datasets. The CLR accounts for the matching criteria when the data are modeled using the following formula (NCSS nd):
logit(p) = α1 + α2z2 + . . . + αszs + β1x1 + . . . + βpxp
where:
s = stratum (matching criterion),
z = binary indicator variable for each stratum,
α = regression coefficient associated with each stratum,
x = independent variable (covariate), and
β = population regression coefficients to be estimated.
In this formula, logit(p) equates to log(p/1 − p), or the probability of the observation being a case. The CLR algorithm estimates the population regression coefficients (betas), but not the regression coefficients for the strata (alphas), which are matched and therefore do not vary meaningfully within the data. The results are typically presented as odds ratios, to help the reader interpret and understand the relationship of each covariate to the cases and controls after adjusting for the effects of the other covariates.
All data were processed using Python and analyzed using R Version 2023.06.1+524.
Dataset Summary
Table 15 shows summary statistics for the continuous variables in the dataset by organizational category. Variables from the manual data collection are presented in the Findings section.
Table 15. Summary Statistics for Continuous Variables of Interest in the Dataset
| Variable1 | Min | 1st quartile | Median | Mean | 3rd Quartile | Max |
|---|---|---|---|---|---|---|
| Population and Selected Race/Ethnicity Variables (ACS) | ||||||
| Total population | 0 | 2,793 | 4,698 | 5,929 | 7,777 | 38,949 |
| Percentage of total population identifying as Black | 0.0% | 3.9% | 10.6% | 27.3% | 43.5% | 98.8% |
| Percentage of total population identifying as Hispanic or Latino | 0.0% | 6.4% | 17.2% | 27.0% | 42.5% | 96.3% |
| Percentage of total population identifying as White | 0.3% | 7.7% | 28.9% | 35.0% | 61.7% | 94.6% |
| Percentage of total population identifying as Asian | 0.0% | 1.0% | 4.9% | 7.3% | 10.7% | 57.2% |
| Percentage of total population identifying as American Indian or Native American | 0.0% | 0.0% | 0.1% | 0.3% | 0.4% | 7.1% |
| Selected Household Variables (ACS) | ||||||
| Estimated median household income | $12,109 | $40,087 | $55,996 | $63,864 | $81,374 | $234,677 |
| Estimated total households | 0 | 1,053 | 1,821 | 2,257 | 2,774 | 16,370 |
| Pct of households with no vehicle | 0.0% | 5.6% | 10.3% | 13.1% | 18.2% | 58.6% |
| Selected Journey-to-Work Variables (ACS) | ||||||
| Percentage of eligible population whose primary commute mode is car | 25.3% | 74.9% | 82.9% | 79.9% | 88.1% | 97.8% |
| Percentage of eligible population whose primary commute mode is walking | 0.0% | 0.8% | 2.0% | 3.8% | 4.1% | 44.4% |
| Percentage of eligible population whose primary commute mode is transit | 0.0% | 2.5% | 6.0% | 7.2% | 10.4% | 33.8% |
| Variable1 | Min | 1st quartile | Median | Mean | 3rd Quartile | Max |
|---|---|---|---|---|---|---|
| Selected Network Density Variables (EPA Smart Location Data) | ||||||
| Percentage of eligible population whose primary commute mode is bicycle | 0.0% | 0.0% | 0.4% | 1.3% | 1.4% | 17.1% |
| Network density in terms of facility miles of auto-oriented links per square mile2 | 0 | 0.2 | 1.6 | 2.3 | 3.5 | 17.8 |
| Network density in terms of facility miles of multimodal links per square mile3 | 0.1 | 2.3 | 3.6 | 4.0 | 5.0 | 22.2 |
| Network density in terms of facility miles of pedestrian-oriented links per square mile4 | 2.2 | 13.5 | 17.8 | 17.7 | 21.4 | 63.2 |
| Intersection density in terms of auto-oriented intersections per square mile2 | 0 | 0.43 | 3.78 | 7.22 | 9.22 | 92.41 |
| Intersection density in terms of multimodal intersections having 4 or more legs per square mile3 | 0 | 5.3 | 11.3 | 14.4 | 20.1 | 75.3 |
| Intersection density in terms of pedestrian-oriented intersections having 4 or more legs per square mile4 | 0.9 | 14.8 | 31.7 | 42.5 | 57.9 | 278.9 |
| Walkability index comprised of weighted sum of the ranked values of [D2a_EpHHm] (D2A_Ranked), [D2b_E8MixA] (D2B_Ranked), [D3b] (D3B_Ranked) and [D4a] (D4A_Ranked)5 | 4.3 | 12.3 | 13.9 | 13.7 | 15.4 | 19.3 |
| Selected Employment Variables (EPA Smart Location Data) | ||||||
| Jobs per household (total employees/household) | 0.0 | 0.4 | 0.7 | 2.7 | 1.8 | 181.4 |
| Percentage of low wage workers in a Census block group (CBG) (home location), 2017 Census LEHD RAC | 9.0% | 19.6% | 24.1% | 24.2% | 28.5% | 41.4% |
| Percentage of low wage workers of total #workers in a CBG (work location), 2017 Census LEHD WAC | 5.7% | 23.0% | 29.2% | 30.7% | 37.7% | 66.6% |
| Variable1 | Min | 1st quartile | Median | Mean | 3rd Quartile | Max |
|---|---|---|---|---|---|---|
| 5-tier employment entropy (denominator set to the static 5 employment types in the CBG) | 5.5% | 47.2% | 60.7% | 58.0% | 70.1% | 94.5% |
| Selected Transit Service Variables (GTFS) | ||||||
| Distance to nearest transit stop in feet | 13 | 109 | 245 | 783 | 554 | 25,215 |
| Number of times per day a transit vehicle services any of the stop locations w/in 200 ft of case/control location | 0 | 0 | 0 | 159 | 102 | 6,724 |
| Number of times per day a transit vehicle services any of the stop locations w/in one-quarter mi of case/control location | 0 | 203 | 640 | 2,174 | 1,954 | 83,107 |
1 All ACS and EPA SLD variables calculated for ½-mile radius around the case and control locations.
2 EPA SLD documentation defines auto-oriented facilities as: “Any controlled access highway, tollway, highway ramp, or other facility on which automobiles are allowed but pedestrians are restricted; any link having a speed category value of 3 or lower (speeds are 55 mph or higher); any link having a speed category value of 4 (between 41 and 54 mph) where car travel is restricted to one-way traffic; or any link having four or more lanes of travel in a single direction (implied eight lanes bi-directional – turn lanes and other auxiliary lanes are not counted). For all of the above, ferries and parking lot roads were excluded.”
3 EPA SLD documentation defines multimodal facilities as: “Any link having a speed category of 4 (between 41 and 54 mph) where car travel is permitted in both directions; any link having a speed category of 5 (between 31 and 40mph); or any link having a speed category of 6 (between 21 and 30 mph) where car travel is restricted to one-way traffic. For all of the above, autos and pedestrians must be permitted on the link. For all of the above, controlled access highways, tollways, highway ramps, ferries, parking lot roads, tunnels, and facilities having four or more lanes of travel in a single direction (implied eight lanes bi-directional) are excluded.”
4 EPA SLD documentation defines pedestrian-oriented facilities as: Any link having a speed category of 6 (between 21 and 30 mph) where car travel is permitted in both directions; any link having a speed category of 7 or higher (less than 21mph); any link having a speed category of 6 (between 21 and 30mph); or any pathway or trail (pending data availability) on which automobile travel is not permitted (speed category 8). For all of the above, pedestrians must be permitted on the link. For all of the above, controlled access highways, tollways, highway ramps, ferries, parking lot roads, tunnels, and facilities having four or more lanes of travel in a single direction (implied eight lanes bi-directional) are excluded.
Findings
Bivariate Data Exploration
We conducted an exploratory analysis of the data to understand the degree to which the cases (locations with at least one fatal or severe pedestrian crash in darkness between 2015 and 2019) and controls (locations with no fatal or severe pedestrian crash in any lighting condition between 2015 and 2019) differed with regard to variables of interest such as roadway design and operational characteristics, nearby land uses, and the sociodemographic characteristics and travel behavior of the surrounding population. All p-values in this section reflect the distribution between the two variables, and thus the p-value is listed on the line of the variable name. For example, the posted speed limit distribution is significantly related to case-control status, with a p-value of 0.10. Relationships between case-control status and each value of the variable are further explored in the conditional logistic regression section.
Roadway Design and Operations
Table 16 shows significant bivariate relationships between contextual and design variables and the cases and controls. Immediately, we see that cases are significantly more likely to have occurred on a roadway with two or more through lanes, a posted speed limit of 35 mph, at least one turn lane, and that operate bidirectionally. These findings are likely influenced by pedestrian exposure to some degree, whether through pedestrian route choice or the location of pedestrian activity generators (explored further below). Additionally, despite selecting controls via random selection from within a control population matched to the functional class and location type of the case population, cases were significantly more likely to be located along primary roads (i.e., principal arterials) compared to secondary roads (minor arterials or major collectors).
Table 16. Roadway Design and Operations Variables by Case-Control Status
| Variables | Case N | % Within Cases | Control N | % Within Controls | Total N | % Within Total | P-value |
|---|---|---|---|---|---|---|---|
| Posted Speed Limit | 0.010** | ||||||
| 20 | 8 | 1.5% | 11 | 1.8% | 19 | 1.7% | |
| 25 | 37 | 6.9% | 66 | 11.1% | 103 | 9.1% | |
| 30 | 105 | 19.5% | 133 | 22.4% | 238 | 21.0% | |
| 35 | 249 | 46.2% | 216 | 36.3% | 465 | 41.0% | |
| 40 | 49 | 9.1% | 70 | 11.8% | 119 | 10.5% | |
| 45 | 56 | 10.4% | 70 | 11.8% | 126 | 11.1% | |
| 50+ | 11 | 2.0% | 13 | 2.2% | 24 | 2.1% | |
| Unconfirmed | 24 | 4.5% | 16 | 2.7% | 40 | 3.5% | |
| Total | 539 | 100.0% | 595 | 100.0% | 1134 | 100.0% | |
| Maximum Number of Through Lanes in One Direction | 0.000*** | ||||||
| 1 | 77 | 14.3% | 159 | 26.7% | 236 | 20.8% | |
| 2 | 343 | 63.6% | 323 | 54.3% | 666 | 58.7% | |
| 3 | 99 | 18.4% | 95 | 16.0% | 194 | 17.1% | |
| 4+ | 20 | 3.7% | 18 | 3.0% | 38 | 3.4% | |
| Total | 539 | 100.0% | 595 | 100.0% | 1134 | 100.0% | |
| Maximum Number of Turn Lanes in One Direction | 0.034* | ||||||
| 0 | 257 | 47.7% | 333 | 56.0% | 590 | 52.0% | |
| 1 | 232 | 43.0% | 223 | 37.5% | 455 | 40.1% | |
| 2 | 41 | 7.6% | 31 | 5.2% | 72 | 6.3% | |
| 3 | 9 | 1.7% | 8 | 1.3% | 17 | 1.5% | |
| Total | 539 | 100.0% | 595 | 100.0% | 1134 | 100.0% | |
| Direction of Travel | 0.009** | ||||||
| One-way | 41 | 7.6% | 73 | 12.3% | 114 | 10.1% | |
| Two-way | 498 | 92.4% | 522 | 87.7% | 1020 | 89.9% | |
| Total | 539 | 100.0% | 595 | 100.0% | 1134 | 100.0% | |
| Location Type - Matching (Stratum) Variable | 0.009** | ||||||
| Midblock | 316 | 58.6% | 303 | 50.9% | 619 | 54.6% | |
| Intersection | 223 | 41.4% | 292 | 49.1% | 515 | 45.4% | |
| Total | 539 | 100.0% | 595 | 100.0% | 1134 | 100.0% | |
| Functional Class - Matching (Stratum) Variable | 0.000*** | ||||||
| Primary | 268 | 49.7% | 202 | 33.9% | 470 | 41.4% | |
| Secondary | 271 | 50.3% | 392 | 65.9% | 663 | 58.5% | |
| NA (tertiary) | 0 | 0.0% | 1 | 0.2% | 1 | 0.1% | |
| Total | 539 | 100.0% | 595 | 100.0% | 1134 | 100.0% | |
Significance indicated by bolding and the following: *** p ≤ 0.001, ** p ≤ 0.01, * p ≤ 0.05, #p ≤ 0.10
Countermeasures
Pedestrian countermeasures aim to improve pedestrian safety by influencing driver and pedestrian behavior, separating pedestrian and driver movements, and/or increasing pedestrian visibility. While countermeasures should not be needed to help pedestrians safely cross, given that all cities in this study are governed by laws or vehicle codes stating that drivers must yield to pedestrians trying to cross, countermeasures are often critical to encouraging that yielding. Yet less than 10 percent of the case and control locations had some type of crossing countermeasure, as shown in Table 17. Where countermeasures were present, their prevalence varied between the two groups. Control locations were significantly (p ≤ 0.05) more likely to have advanced stop lines, while case locations were marginally significantly (p ≤ 0.10) more likely to have high-visibility crosswalk markings. However, there was no significant difference between case and control locations with regard to the presence of any type of crosswalk, the quality of crosswalk markings, or the presence of at least one countermeasure of any type.
In contrast, the majority of locations had complete sidewalks on both sides and street lighting on at least one side, although these two countermeasures were significantly more likely to be at case locations. This association almost assuredly reflects that cases were also significantly more likely to occur near pedestrian attractors like stores and along larger roadways, rather than any risk from the countermeasure itself.
Table 17. Countermeasure Presence and Type by Case-Control Status
| Countermeasure | Case N | % Within Cases | Control N | % Within Controls | Total N | % Within Total | P-value |
|---|---|---|---|---|---|---|---|
| Advanced Stop Line Midblock or at One or Both Sides of Intersection | 0.042* | ||||||
| Not present | 535 | 99.3% | 580 | 97.5% | 1115 | 98.3% | |
| Midblock or one side | 4 | 0.7% | 12 | 2.0% | 16 | 1.4% | |
| Both sides of intersection | 0 | 0.0% | 3 | 0.5% | 3 | 0.3% | |
| Total | 539 | 100.0% | 595 | 100.0% | 1134 | 100.0% | |
| Advanced Yield Markings (Shark Teeth) Midblock or at One or Both Sides of Intersection | 0.134 | ||||||
| Not present | 530 | 98.3% | 592 | 99.5% | 1122 | 98.9% | |
| Midblock or one side | 5 | 0.9% | 1 | 0.2% | 6 | 0.5% | |
| Both sides of intersection | 4 | 0.7% | 2 | 0.3% | 6 | 0.5% | |
| Total | 539 | 100.0% | 595 | 100.0% | 1134 | 100.0% | |
| High-visibility Crosswalk Midblock or at One or Both Sides of Intersection | 0.056# | ||||||
| Not present | 501 | 92.9% | 569 | 95.6% | 1070 | 94.4% | |
| Midblock or one side | 32 | 5.9% | 18 | 3.0% | 50 | 4.4% | |
| Both sides of intersection | 6 | 1.1% | 8 | 1.3% | 14 | 1.2% | |
| Total | 539 | 100.0% | 595 | 100.0% | 1134 | 100.0% | |
| Countermeasure | Case N | % Within Cases | Control N | % Within Controls | Total N | % Within Total | P-value |
|---|---|---|---|---|---|---|---|
| Standard Crosswalk Midblock or at One or Both Sides of Intersection | 0.174 | ||||||
| Not present | 529 | 98.1% | 575 | 96.6% | 1104 | 97.4% | |
| Midblock or one side | 6 | 1.1% | 16 | 2.7% | 22 | 1.9% | |
| Both sides of intersection | 4 | 0.7% | 4 | 0.7% | 8 | 0.7% | |
| Total | 539 | 100.0% | 595 | 100.0% | 1134 | 100.0% | |
| Any Type of CM Midblock or at One or Both Sides of Intersection | 0.721 | ||||||
| Not present | 487 | 90.4% | 542 | 91.1% | 1029 | 90.7% | |
| Midblock or one side | 32 | 5.9% | 36 | 6.1% | 68 | 6.0% | |
| Both sides of intersection | 20 | 3.7% | 17 | 2.9% | 37 | 3.3% | |
| Total | 539 | 100.0% | 595 | 100.0% | 1134 | 100.0% | |
| Pedestrian Signage Midblock or at One or Both Sides of Intersection | 0.417 | ||||||
| Not present | 514 | 95.4% | 576 | 96.8% | 1090 | 96.1% | |
| Midblock or one side | 17 | 3.2% | 14 | 2.4% | 31 | 2.7% | |
| Both sides of intersection | 8 | 1.5% | 5 | 0.8% | 13 | 1.1% | |
| Total | 539 | 100.0% | 595 | 100.0% | 1134 | 100.0% | |
| Countermeasure | Case N | % Within Cases | Control N | % Within Controls | Total N | % Within Total | P-value |
|---|---|---|---|---|---|---|---|
| Street Lighting Midblock | 0.351 | ||||||
| Not present | 56 | 15.7% | 41 | 13.5% | 97 | 15.7% | |
| One side midblock or at intersection | 103 | 33.8% | 106 | 35.0% | 209 | 33.8% | |
| Both sides midblock or at intersection | 157 | 50.6% | 156 | 51.5% | 313 | 50.6% | |
| Total | 316 | 100.0% | 303 | 100.0% | 619 | 100.0% | |
| Street Lighting at the Intersection | 0.002** | ||||||
| Not present | 9 | 4.0% | 31 | 10.6% | 40 | 7.8% | |
| One corner | 42 | 18.8% | 83 | 28.4% | 125 | 24.3% | |
| Two corners | 83 | 37.2% | 107 | 36.6% | 190 | 36.9% | |
| Three or four corners | 89 | 39.9% | 71 | 24.3% | 160 | 31.1% | |
| Total | 223 | 100.0% | 292 | 100.0% | 515 | 100.0% | |
| Street Lighting Type | 0.965 | ||||||
| Pedestrian-scale lighting only | 4 | 2.3% | 4 | 2.4% | 8 | 2.4% | |
| Vehicle-scale lighting only | 161 | 94.2% | 158 | 94.6% | 319 | 94.4% | |
| Vehicle- and pedestrian-scale lighting | 6 | 3.5% | 5 | 3.0% | 11 | 3.3% | |
| Total | 171 | 100.0% | 167 | 100.0% | 338 | 100.0% | |
| Countermeasure | Case N | % Within Cases | Control N | % Within Controls | Total N | % Within Total | P-value |
|---|---|---|---|---|---|---|---|
| Sidewalk Presence Midblock or at Intersection | 0.032* | ||||||
| Not present either side | 29 | 5.4% | 43 | 7.2% | 72 | 6.3% | |
| One side missing, one side partial or complete | 34 | 6.3% | 54 | 9.1% | 88 | 7.8% | |
| Both sides partial or one side complete and one side partial | 30 | 5.6% | 36 | 6.1% | 66 | 5.8% | |
| Both sides complete | 446 | 82.7% | 462 | 77.6% | 908 | 80.1% | |
| Total | 539 | 100.0% | 595 | 100.0% | 1134 | 100.0% | |
| Bike Facility Presence Midblock or at Intersection | 0.835 | ||||||
| Not present either side | 434 | 80.5% | 482 | 81.0% | 916 | 80.8% | |
| Bike facility on at least one side | 105 | 19.5% | 113 | 19.0% | 218 | 19.2% | |
| Total | 539 | 100.0% | 595 | 100.0% | 1134 | 100.0% | |
| Presence of Street Buffer (Parking or Shoulder) | 0.381 | ||||||
| No buffer on either side | 305 | 56.6% | 352 | 59.2% | 657 | 57.9% | |
| Buffer on at least one side | 234 | 43.4% | 243 | 40.8% | 477 | 42.1% | |
| Total | 539 | 100.0% | 595 | 100.0% | 1134 | 100.0% |
Significance indicated by bolding and the following: *** p ≤ 0.001, ** p ≤ 0.01, * p ≤ 0.05, #p ≤ 0.10
Land Use
Several land uses were highly significantly associated with case-control status (see Table 18). In particular, cases were significantly more likely to be co-located with a liquor store, convenience store, grocery store, or any type of commercial center, although only marginally more likely to have a drug or marijuana store on the segment or at the intersection. Cases were also significantly more likely to be co-located with high-density housing, while being significantly less likely than controls to be co-located with low-density housing. While the commercial and housing variables are significantly correlated with case-control status, high-density housing is not significantly correlated with either low- or high-density commercial, suggesting that they are not operating as proxies for one another.
Table 18. Land Use Presence and Type by Case-Control Status
| Land Use | Case N | % Within Cases | Control N | % Within Controls | Total N | % Within Total | P-value |
|---|---|---|---|---|---|---|---|
| Liquor Store Present on Segment or at Intersection | 0.000*** | ||||||
| No | 419 | 77.7% | 532 | 89.4% | 951 | 83.9% | |
| Yes | 120 | 22.3% | 63 | 10.6% | 183 | 16.1% | |
| Total | 539 | 100.0% | 595 | 100.0% | 1134 | 100.0% | |
| Marijuana or Drug Store Present on Segment or at Intersection | 0.075# | ||||||
| No | 515 | 95.5% | 580 | 97.5% | 1095 | 96.6% | |
| Yes | 24 | 4.5% | 15 | 2.5% | 39 | 3.4% | |
| Total | 539 | 100.0% | 595 | 100.0% | 1134 | 100.0% | |
| Convenience Store Present on Segment or at Intersection | 0.000*** | ||||||
| No | 330 | 61.2% | 470 | 79.0% | 800 | 70.5% | |
| Yes | 209 | 38.8% | 125 | 21.0% | 334 | 29.5% | |
| Total | 539 | 100.0% | 595 | 100.0% | 1134 | 100.0% | |
| Grocery Store Present on Segment or at Intersection | 0.000*** | ||||||
| No | 409 | 75.9% | 536 | 90.1% | 945 | 83.3% | |
| Yes | 130 | 24.1% | 59 | 9.9% | 189 | 16.7% | |
| Total | 539 | 100.0% | 595 | 100.0% | 1134 | 100.0% | |
| School Present on Segment or at Intersection | 0.996 | ||||||
| No | 471 | 87.4% | 520 | 87.4% | 991 | 87.4% | |
| Yes | 68 | 12.6% | 75 | 12.6% | 143 | 12.6% | |
| Total | 539 | 100.0% | 595 | 100.0% | 1134 | 100.0% | |
| Land Use | Case N | % Within Cases | Control N | % Within Controls | Total N | % Within Total | P-value |
|---|---|---|---|---|---|---|---|
| Low-Density Commercial (Occasional Stores or Small Strip Mall) Present on Segment or at Intersection | 0.000*** | ||||||
| No | 234 | 43.4% | 356 | 59.8% | 590 | 52.0% | |
| Yes | 305 | 56.6% | 239 | 40.2% | 544 | 48.0% | |
| Total | 539 | 100.0% | 595 | 100.0% | 1134 | 100.0% | |
| High-Density Commercial (Major Strip Mall or Regional Shopping) Present on Segment or at Intersection | 0.006** | ||||||
| No | 437 | 81.1% | 518 | 87.1% | 955 | 84.2% | |
| Yes | 102 | 18.9% | 77 | 12.9% | 179 | 15.8% | |
| Total | 539 | 100.0% | 595 | 100.0% | 1134 | 100.0% | |
| Low-Density Housing (Single-family or Duplexes) Present on Segment or at Intersection | 0.000*** | ||||||
| No | 321 | 59.6% | 273 | 45.9% | 594 | 52.4% | |
| Yes | 218 | 40.4% | 322 | 54.1% | 540 | 47.6% | |
| Total | 539 | 100.0% | 595 | 100.0% | 1134 | 100.0% | |
| High-Density Housing (Apartments or Condos) Present on Segment or at Intersection | 0.010** | ||||||
| No | 435 | 80.7% | 514 | 86.4% | 949 | 83.7% | |
| Yes | 104 | 19.3% | 81 | 13.6% | 185 | 16.3% | |
| Total | 539 | 100.0% | 595 | 100.0% | 1134 | 100.0% | |
Significance indicated by bolding and the following: *** p ≤ 0.001, ** p ≤ 0.01, * p ≤ 0.05, #p ≤ 0.10
Transit
Finally, there were also highly significant associations between case-control status and the presence of a transit stop, both within 200 feet and within one-quarter of a mile (see Table 19). This finding likely reflects pedestrian exposure, underscoring the importance of providing safe pedestrian crossings and facilities at transit stops.
Table 19. Binary Transit Variables by Case-Control Status
| Variable | Case N | % Within Cases | Control N | % Within Controls | Total N | % Within Total | P-value |
|---|---|---|---|---|---|---|---|
| Presence of Transit Within 200 Feet | 0.024* | ||||||
| No | 286 | 53.1% | 353 | 59.3% | 639 | 56.3% | |
| Yes | 247 | 45.8% | 232 | 39.0% | 479 | 42.2% | |
| NA | 6 | 1.1% | 10 | 1.9% | 16 | 1.4% | |
| Total | 539 | 100.0% | 595 | 100.2% | 1,134 | 100.0% | |
| Presence of Transit Within 1320 Feet (One-Quarter Mile) | 0.000*** | ||||||
| No | 38 | 7.1% | 97 | 16.3% | 135 | 11.9% | |
| Yes | 495 | 91.8% | 488 | 82.0% | 983 | 86.7% | |
| NA | 6 | 1.1% | 10 | 1.9% | 16 | 1.4% | |
| Total | 539 | 100.0% | 595 | 100.2% | 1134 | 100.0% | |
Significance indicated by bolding and the following: *** p ≤ 0.001, ** p ≤ 0.01, * p ≤ 0.05, #p ≤ 0.10
Multivariate Analysis
The next step in the analysis were multivariate analyses that explored the many significant bivariate relationships to home in on the most significant factors associated with case versus control locations. Because of the large number of variables in the dataset, we used random forest analysis to help reduce the data under consideration for the subsequent regression modeling. After reviewing the results of the random forest analysis, we used conditional logistic regression to further explore the influence of various factors on the likelihood of being a case or control observation.
Random Forest
Random forest is a data reduction technique that can make subsequent modeling more efficient. Because of the high number of variables in our dataset and the likelihood of correlation between, particularly, some of the census and EPA SLD variables, using tools to help with data reduction is particularly important. The results of the random forest analysis, displayed in Figure 6, include two different measures – Mean Decrease in Accuracy and Mean Decrease in the Gini Coefficient – to depict the relative importance of each variable. The accuracy plot shows the negative impact of leaving out any one variable; the Gini model reflects the purity of the nodes at the end of the tree. The plots are not expected to match exactly. For both plots, a higher score reflects relative greater importance in predicting case-control status.
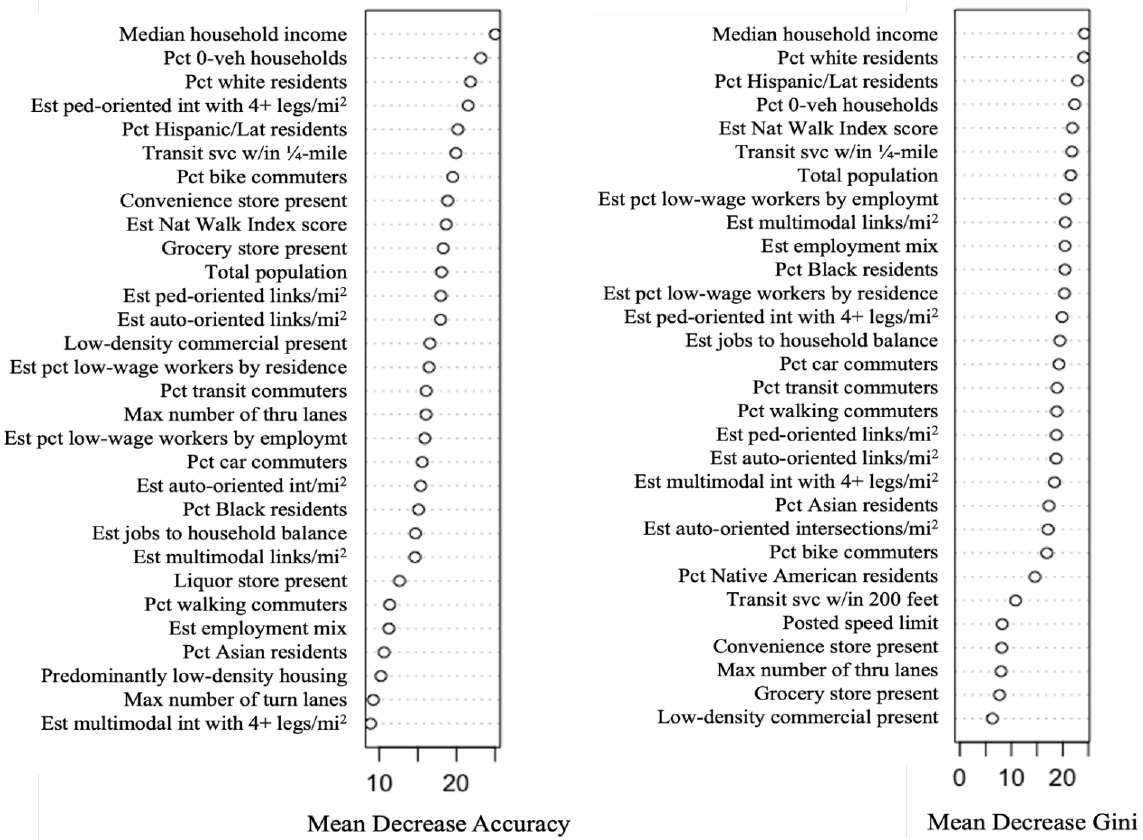
Conditional Logistic Regression
Based on the results of the bivariate significance testing, random forest analysis, and our understanding of past research and transportation and public health theory, we began to test varying combinations of variables with a significant bivariate relationship to the case-control status in a multivariate conditional logistic regression model. We used conditional logistic regression to control for the matching variable used in the design of the case-control sample. While we did not test every possible combination of these variables, we iterated on this model dozens of times, using a combination of both forward and backward stepwise regression and guided by theory, the random forest results, and each subsequent regression model’s results. No model included predictor variables that were correlated with one another above a Pearson’s score of 0.6, a generally accepted cut-off. Our preferred final model homes in on several land use and population characteristics of the half mile surrounding each case and control location that are significantly associated with case-control status, as shown in Table 20. Among the land use variables, we see a significant and positive association with cases and the presence of (separately) a convenience store (p ≤ 0.01), grocery store (p ≤ 0.001), liquor store (p ≤ 0.05), and other low-density commercial (p ≤ 0.05). We see a significant and negative association between cases and the presence of low-density housing (p ≤ 0.05).
Table 20. Conditional Logistic Regression Model Predicting Case-Control Status
| Variable | Coeff | OR | S.E. | Pr(>|z|) | 2.5% | 97.5% |
|---|---|---|---|---|---|---|
| Convenience store present | 0.459 | 1.58 | 0.16 | 0.004** | 1.16 | 2.16 |
| Grocery store present | 0.647 | 1.91 | 0.19 | 0.001*** | 1.32 | 2.75 |
| Liquor store present | 0.394 | 1.48 | 0.19 | 0.041* | 1.02 | 2.17 |
| Primarily low-density housing | -0.343 | 0.71 | 0.14 | 0.014* | 0.54 | 0.93 |
| Maximum # thru lanes in one direction (baseline =1) | ||||||
| Maximum # thru lanes = 2 | 0.398 | 1.49 | 0.19 | 0.032* | 1.04 | 2.14 |
| Maximum # thru lanes = 3 | 0.108 | 1.11 | 0.24 | 0.649 | 0.70 | 1.77 |
| Maximum # thru lanes ≥ 4 | 0.345 | 1.41 | 0.39 | 0.375 | 0.66 | 3.02 |
| Low-density commercial | 0.332 | 1.39 | 0.14 | 0.015* | 1.07 | 1.82 |
| Percent Black residents | 0.626 | 1.87 | 0.25 | 0.013* | 1.14 | 3.07 |
| Percent Hispanic/Latino residents | 0.884 | 2.42 | 0.28 | 0.002** | 1.40 | 4.20 |
| Estimated National Walk Index | 0.101 | 1.11 | 0.03 | 0.001*** | 1.04 | 1.18 |
| Estimated multimodal links per square mile | -0.062 | 0.94 | 0.03 | 0.034* | 0.89 | 1.00 |
Few additional roadway variables appeared to be significant in the model, likely because we controlled for the functional classification through our case and control selection. The one significant variable was the maximum number of through lanes in one direction, which indicated that, compared to roadways with only one through lane in each direction, those with two through lanes for at least one direction were significantly more likely to be cases than controls (p ≤ 0.05). We also found two network variables from EPA’s Smart Location Database to be significant. The National Walkability Index score, a measure of walkability for an area, was positively associated with case status (p ≤ 0.01), likely because it is influenced by land use mix and is thus likely a major predictor of pedestrian activity. Another variable, the estimated density of multimodal links, was negatively associated (p ≤ 0.05) with being a case in our model. This variable reflects the density of multimodal links per square mile – an attempt to represent roadways where pedestrians and automobiles are both allowed and reasonably accommodated, in contrast to auto-oriented links like freeways or pedestrian-oriented links like slower neighborhood streets (see the full definition under Table 15).
In terms of population characteristics, we found that the percentages of residents who identified as Black or Hispanic/Latino were positively associated [(p ≤ 0.05) and (p ≤ 0.01), respectively] with case status. Other variables related to race/ethnicity, and commuting behavior were insignificant in the final model.
Discussion
The findings in this analysis both confirm prior research and provide additional clarity about significant correlates of pedestrian fatalities and severe injuries at night and actions to improve pedestrian safety in dark conditions. These findings may also provide insights into why pedestrian fatalities in darkness have been increasing over time.
Findings Related to Roadway Design and Operational Factors
In our initial bivariate results, we found significant and positive associations between case-control status and the posted speed limit (cases more likely to occur at a posted speed of 35 mph), maximum number of
through lanes in one direction (cases less likely to have only one lane in each direction), maximum number of turn lanes in one direction (cases more likely to have at least one turn lane), and the direction of travel (cases more likely to have two-way travel). Although we controlled for functional classification through our matching to the degree possible within the data, we also found that cases were more likely to occur on primary arterials than secondary arterials. When these variables were included in a multivariate model that also controlled for land use, broader network measures, commute behavior, and neighborhood sociodemographics, only the maximum number of through lanes remained significant, corroborating the findings of past research (e.g., Sanders et al. 2022) and our macro-level analysis, and underscoring the importance of providing safe crossings along multilane roadways.
We also gathered data on and examined multiple types of pedestrian countermeasures, including advanced stop lines, advanced yield lanes, the presence of pedestrian crossing signage, high-visibility and standard crosswalk markings, street lighting presence and type, sidewalk presence and completeness, and bike facility presence and type. To our knowledge, no other studies have attempted to gather this type of manual data for a similar case-control analysis. The prevalence of pedestrian-specific countermeasures was very low within our sample, such that less than 10 percent of sites had any countermeasure other than sidewalks. This low countermeasure prevalence reflects a general lack of attention to pedestrian crossing needs on even the highest-risk streets in our case cities. Street lighting was more prevalent but had no association with case-control status for midblock locations and was positively associated with being a case at intersections – a likely reflection of the fact that cases were also more likely to occur near commercial land uses and along larger roadways, where intersection lighting may be more common. The presence of a complete sidewalk on both sides was also positively associated with case status, again likely reflecting the broader land use and roadway conditions than any association with the sidewalk itself. When we examined these variables in our random forest model, none of them were close to being the most important variables in the model, and they were therefore not tested in the conditional logit regression. That said, the multimodal network density variable from the EPA’s Smart Location Database was negatively associated with being a case in our model, which may better capture some aspect of overall neighborhood multimodality than we were able to accomplish through our manual data collection at the specific locations.
Findings Related to Land Use
Our findings related to land use offer important insights into why some places along arterial roadways – which often vary little in terms of roadway design – are more likely to be the site of a severe or fatal pedestrian injury in darkness. While this research was not able to incorporate specific estimates of pedestrian volumes, proxies for pedestrian activity were consistently significantly associated with case status. Cases were highly significantly associated with certain land uses, particularly convenience stores and grocery stores, and significantly associated with the presence of a liquor store and general low-density commercial design. These findings corroborate research on similar land use associations (Long and Ferenchak 2021; Dumbaugh et al. 2023). These factors were all significant in bivariate modeling and remained significant in the multivariate model, indicating their importance even when controlling for other factors. The significance of the National Walkability Index score in the model likely also reflects the importance of land use to case-control status.
People need to access these land uses in all conditions, including in darkness and throughout the year. Dark conditions appear to particularly influence pedestrian safety in the late fall, winter, and early spring months, when the sun sets earlier and yet people still need to live their lives. Yet there is often no safe pedestrian crossing near these known attractors. Our data show that the vast majority of case locations had sidewalks and street lighting of some type, and the crash types reflect that these sidewalks are effective at protecting pedestrians as they walk along the roadway. However, there is a gap in protection for pedestrians crossing the street in these location types. Guidance on creating safe crossings near known attractors, as well as the appropriate spacing for those crossings, could be among the first steps in any plan to improve pedestrian safety in darkness.
In the bivariate analysis, the presence of high-density housing was significantly positively associated with being a case location, while the presence of low-density housing was significantly negatively associated with being a case. For the final model, the low-density housing variable performed best, essentially reflecting that low-density residential areas remained significantly less likely to be case locations even when controlling for the other land use factors (which are less likely in low-density areas). This result likely reflects elements of roadway design, lower pedestrian demand, and different driver behavior in these areas.
Findings Related to Sociodemographic Factors
We found that the percentages of residents who identified as Black or Hispanic/Latino were positively associated with case status, even after controlling for land use and roadway design characteristics. This finding corroborates recent related research (e.g., Long and Ferenchak 2021; Sanders and Schneider 2022; Dumbaugh et al. 2023), which includes research showing that pedestrian fatality hotspots occur predominantly in majority Black and Hispanic/Latino neighborhoods (Schneider et al. 2021).
Conclusion
This study used a case-control analysis to investigate how various roadway design and operations, land use, neighborhood sociodemographic, and travel behavior factors differ between locations (segments and unsignalized intersections) where a pedestrian was killed or severely injured in dark conditions between 2015-2019 (cases) from sites along similar roadways where no pedestrian had been killed or seriously injured in the same time period (controls). While pedestrian fatalities in darkness occurred predominantly along urban arterials during this time period, we found that, along those roadways, cases were significantly more likely to be co-located with convenience stores, grocery stores, liquor stores, and generally low-density commercial. Case locations were also significantly more likely than control locations to have two lanes of traffic (compared to only one) in at least one direction. Very few cases and controls (10%) had any type of pedestrian countermeasure. Cases were also significantly associated with a higher percentage of Black and Hispanic/Latino residents.
These findings can inform research into the longitudinal increase in pedestrian fatalities at night. For example, given that certain land uses are highly significantly associated with fatal and severe pedestrian injuries in darkness on known high-risk roadways like urban arterials, we need to understand if pedestrians are increasingly likely on these roadways and/or if these land uses are increasingly likely along these roadways – and if so, why and what should be done to protect these pedestrians. Are these roadways more likely to be zoned for high-density housing, thereby increasing pedestrian activity – and demand for corresponding attractors like convenience stores – at all times of day? Do more households with no or limited car access locate in that high-density housing, thereby increasing walking and bus use at all times of day, and perhaps particularly in darker hours, but without corresponding pedestrian countermeasures? Questions like these are complex, and this research can help inform both research design and theory.
2.3 Driving Simulator Study
Research Design and Methods
This section contains the experimental design methods and protocols, as well as data collection and reduction in detail. First, all equipment used to design and build the virtual environments and run the experimental testing are outlined. Next, the experimental design introduces the independent and dependent variables as well as the factorial design. The virtual environment development process is then summarized, followed by the order of protocols for conducting experimental testing. Lastly, the data collection and reduction are explained.
Equipment
This section discusses the software, technology, and equipment used during the design, development, and experimental testing of this study.
Blender
Blender 2.78 is an open-source computer graphics software used for developing and rendering virtual environments. This software is used in the first phase of design and development, where individual polygons and surfaces are modeled to create 3D assets.
Desktop Driving Simulator
As pictured in Figure 7, this simulator equipment is composed of three desktop monitors, angled as a trifold, a desk-mounted steering wheel and corresponding acceleration and deceleration pedals located on the floor. The desktop driving simulator serves to (1) be the host computer where the Blender files are further developed into a fully constructed virtual world using Intersection Scene Assembler (ISA) Version 2.0, and (2) function as a small-scale version of the passenger car simulator for preliminary testing and troubleshooting.
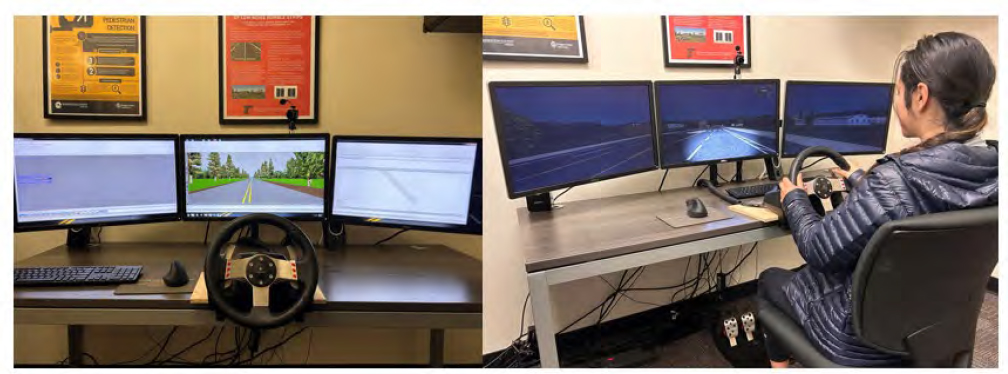
Full-Scale Passenger Car Driving Simulator
The OSU Passenger Car Driving Simulator consists of a 2009 Ford Fusion with modifications to the internal components that allowed the driver to navigate through the simulated environment. This medium-fidelity simulator is mounted on a 3 degree-of-freedom motion base permitting rotation of ±4 degrees. The simulator is located in an isolated room designed to mitigate distractions (sound, light) and conflicting activities during testing. In Figure 8, the passenger car driving simulator is shown.
Mounting of the vehicle cab atop the pitch motion system situates the driver’s eye at the desired height for optimal viewing of the front-facing projected screens while allowing for authentic inertial experiences that simulate acceleration and deceleration. The visual field observed through the front windshield of the cab provides a 180 degree by 40 degree field-of-view produced by three individual projectors (resolution = 1400 by 1050 pixels) with each projector spanning across screens sized at 11 feet by 7.5 feet. A fourth digital light-processing projector displayed visuals of the simulated environment behind the vehicle which could be viewed through the rear windshield of the cab. This system is designed such that the rearview mirror reflects the view as it would in a real-world vehicle, while the left and right side-view mirrors have embedded LCD displays. Graphics updated at 60 Hz, the regular refresh rate for a high-quality computer monitor. Speakers capable of producing high-quality auditory representations of ambient sounds were used external to the vehicle and inside the cab to present the different audible queues one might experience. The system runs Realtime Technologies SimCreator Software Version 3.2 on a quad-core host computer to produce the simulated environment.
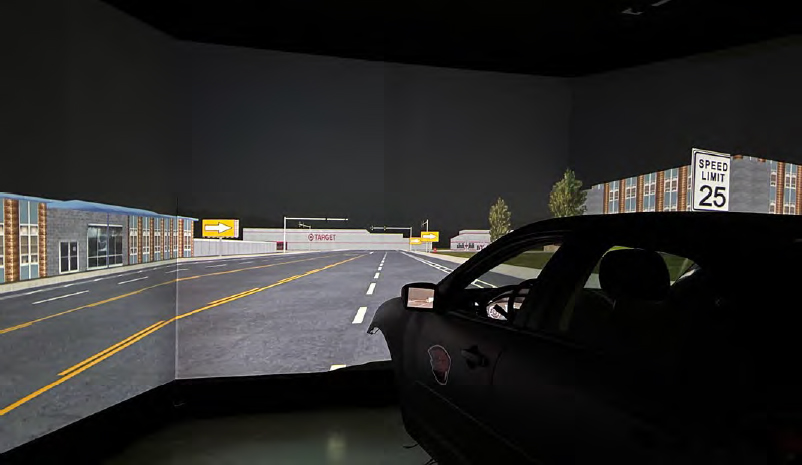
SimObserver Data Acquisition System
To provide insight into driver behavior and corresponding performance, real-time kinematic (velocity) and trajectory (position) vehicle data were captured using the SimObserver data acquisition system that is integrated into the passenger car simulator. The system also captures multiple camera images of the participant while driving and was synchronized with the other data feeds to sample at 60 Hz, recording approximately every 0.017 seconds.
Head Mounted Eye-Tracker
To collect visual attention data, Tobii Pro Glasses 3 were fitted to all participants (Figure 9). These glasses can operate at up to a 100Hz sampling rate and produce visual attention accuracy of 0.6. Use of the center of the pupil and reflections of light off the cornea of the wearers eye allowed for gaze position to be calculated internally within the Tobii software. The glasses contain eight light sources per lens to illuminate the eye for reflections, and the reflections were captured by the mounted camera for further calculations (Tobii 2024). The Tobii Pro Glasses 3 uses a wide-angle scene camera that provides a wider view and slippage compensation technology with persistent calibration, which allow unconstrained eye and head movements for the user throughout the recording (Tobii 2024).
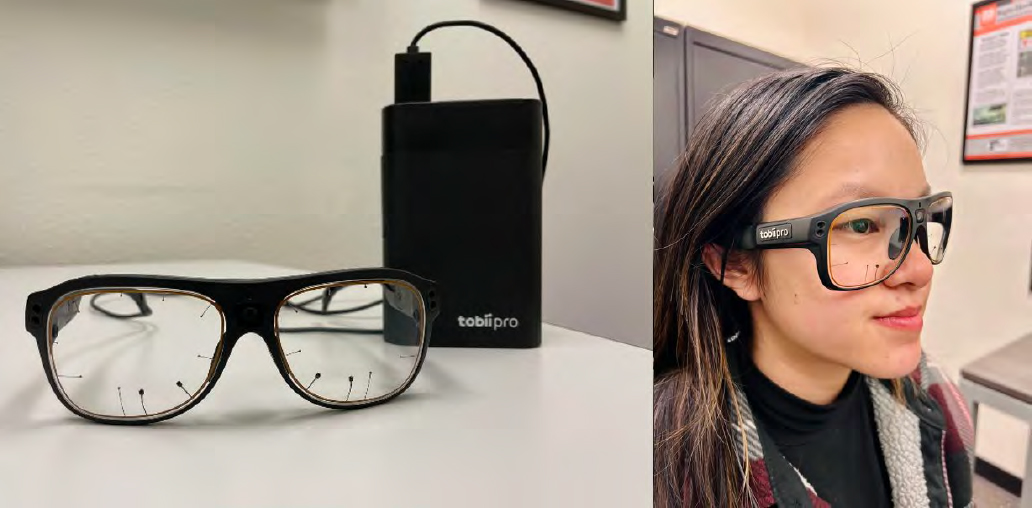
Via live integration, the recorded data was transferred into the iMotions biometric data processing software for reduction and analysis.
Galvanic Skin Response (GSR) Sensor
The Shimmer 3 GSR+ was leveraged as a wearable piece of equipment that allowed photoplethysmogram (PPG) and GSR to be measured as indicators of a participant’s levels of stress. Securement of the electrode sensors to separate fingers of the participant allowed for GSR data to be collected (Figure 10). These electrodes detect stimuli in the form of changes in moisture, which increase skin conductance and change the electric flow between the two electrodes (Shimmer, 2018). Therefore, GSR data is dependent on sweat gland activity, which is correlated to participant level of stress (Bakker, Pechenizkiy, & Sidorova, 2011). PPG signals are collected through photodetectors on skin surfaces (usually a finger or earlobe) which measure volumetric variations in blood circulation, giving an accurate and non-intrusive method to monitor participant heart rates (Castaneda, Aibhlin, Ghamari, Soltanpur, & Nazeran, 2018). Use of GSR and PPG data together provide accurate measurements of participant stress and give certainty that any observed differences are representative to the authentic physiological response of the wearer. The sensors attach to the Shimmer3 device shown in Figure 10 which is then kept beside the wearer throughout the duration of the study.
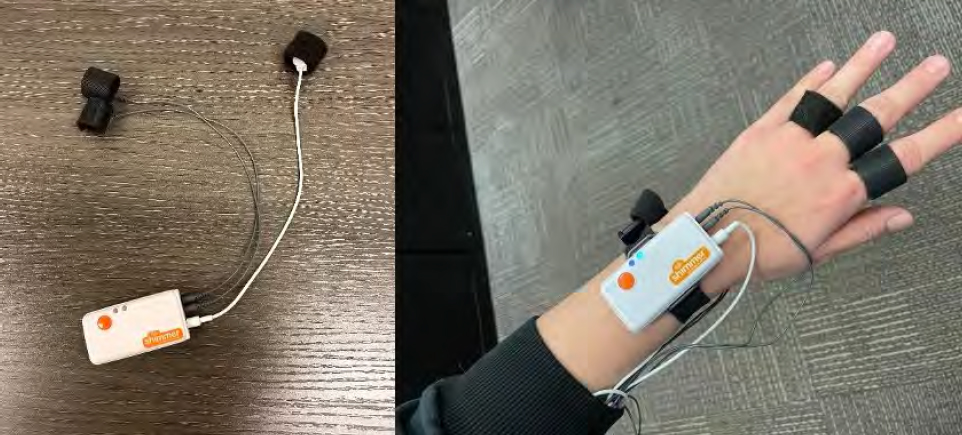
Qualtrics
The pre-drive and post-drive surveys were designed and administered through Qualtrics. The initial stages of data cleaning were executed using their internal post-processing functions. The data was then exported to Excel and RStudio Version 3.2 for further cleaning, reduction, and analysis.
Experimental Design
Independent Variables
The experiment was factorially designed, comprising four independent variables: posted speed limit, pedestrian skin pigmentation, roadway lighting conditions, and mid-block crossing treatment. Table 21 describes each variable and their corresponding levels. Following, each variable and level is explicitly defined.
Table 21: Independent Variables and Levels
| Variable | Level | Description |
|---|---|---|
| Posted speed limit | 1 | 25 mph |
| 2 | 40 mph | |
| Pedestrian skin pigmentation | 1 | Fitzpatrick Skin Type II |
| 2 | Fitzpatrick Skin Type VI | |
| Lighting conditions | 1 | Darker |
| 2 | Brighter | |
| Mid-block crossing treatment | 1 | Unmarked Crosswalk |
| 2 | High-Visibility Crosswalk with Crossing Island | |
| 3 | High-Visibility Crosswalk with Crossing Island + Rectangular Rapid Flashing Beacon + Stop Line |
The posted speed limit indicates the velocity for each rendered built environment, which varied between 25mph and 40mph. Each pedestrian crossing the mid-block crosswalk had a pedestrian skin pigmentation of either Fitzpatrick Skin Type II or VI. Fitzpatrick scale and corresponding pedestrian models from the driving simulator can be seen in Table 22. The nighttime lighting conditions varied by test environment which had no lighting present or an illuminated environment. The mid-block crossing treatment included three types: unmarked crosswalk, high-visibility crosswalk + crossing island, and high-visibility crosswalk + crossing island + stop line + Rectangular Rapid Flashing Beacon (RRFB). The cross-section diagram for the mid-block crossing treatments can be seen in Figure 11.
Table 22: Fitzpatrick Skin Classification
| Skin Type | Skin Color | Reaction to Sun Exposure | Example Pedestrian Models |
|---|---|---|---|
| I | Pale white | Always burns – never tans |  |
| II | White to light beige | Burns easily – tans minimally | |
| III | Beige | Burns moderately – tans gradually to light brown |  |
| IV | Light brown | Burns minimally- tans well to moderately brown | |
| V | Moderate brown | Rarely burns – tans profusely to dark brown |  |
| VI | Dark brown or black | Never burns – tans profusely |  |
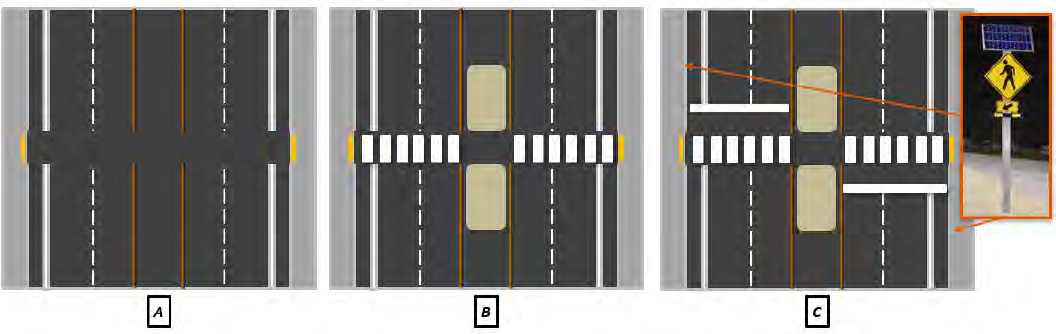
Virtual Environment
Intersection and road geometries were consistent throughout the virtual world. This includes a 5-foot pedestrian sidewalk, 6-foot bicycle lane, 1.6-foot bicycle barrier, and two 11-foot vehicular lanes. High-visibility and RRFB mid-block crossings include a crosswalk width of 7-foot and a crossing island. RRFB mid-block crossings had a stop line in replace of a yielding marking 22 feet away from the closer edge of the crosswalk. Figure 11 shows the newly developed RRFB and Figure 12 shows the dimensions of the street segment.
Included in the segment geometry was a 12-foot two-way left-turn lane that separated the two directions of travel. Pavement markings, geometric configurations, and signage were designed with standards from the 2009 Manual on Uniform Traffic (MUTCD) with the associated 2022 revisions (FHWA, 2022). Although not an experimental variable of interest, low volume ambient traffic was present outside of the scenarios of interest to provide a more authentic driving experience. Structural elements within the SimCreator software (i.e., buildings and trees) were used and carefully oriented to resemble an urban setting, with adjacent land use being kept consistent across all scenarios.
Sensors to start data collection and initiate pedestrian walking were placed 311.7 feet upstream of the crosswalk. This location was chosen because it is the stopping sight distance of a zero grade, tangent segment with a posted speed limit of 40 mph (AASHTO, 2018). The pedestrian was placed 16.4 feet before the crosswalk to start walking toward and then crossing the crosswalk at a walking velocity of 7.9 ft/s (Zeeger, 1998).
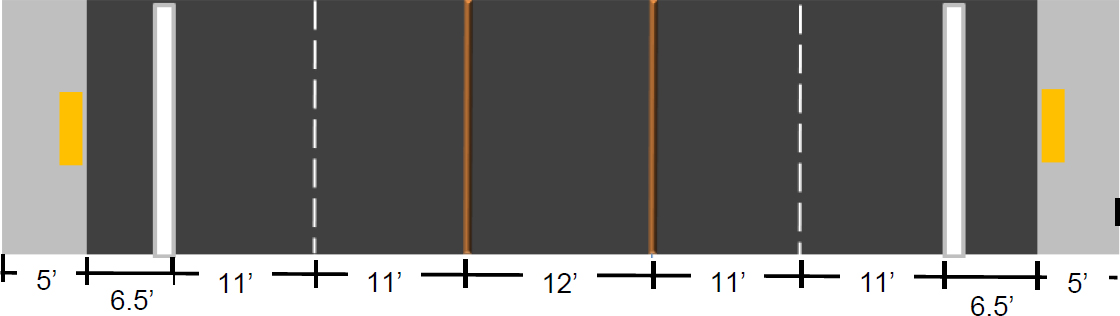
Factorial Design
The four independent variables made up a 2x2x2x3 factorial design, resulting in 24 unique crossing scenarios that were traversed by each participant. Four separate virtual worlds (grids) were created, with each grid featuring six experimental mid-block crossing scenarios. Separating these scenarios into grids allowed for them to be partially randomized, reducing the chance of carryover effects (i.e., learning) while also minimizing participant’s fatigue as they could take brief breaks between grids. Each scenario was randomly assigned a grid and placement in the respective experimental route. Moreover, the order in which the grids were presented was randomized for each participant. To further add buffer between exposures, an intersection was placed in between the mid-block crossing. The four grids, their randomly selected scenarios and corresponding variable levels, and the order of presentation are shown in Table 23.
Table 23: Grid and Scenario Design
| Int # | Pedestrian Skin Type | Treatment | Speed Limit | Lighting Condition |
|---|---|---|---|---|
| Grid 1 | ||||
| 1 | II | Unmarked | 25 | Brighter |
| 2 | VI | RRFB + crossing island + stop line | ||
| 3 | VI | High Visibility + crossing island | ||
| 4 | II | RRFB + crossing island + stop line | ||
| 5 | VI | Unmarked | ||
| 6 | II | High Visibility + crossing island | ||
| Grid 2 | ||||
| 1 | VI | RRFB+ crossing island + stop line | 40 | Darker |
| 2 | II | High Visibility + crossing island | ||
| 3 | II | RRFB + crossing island + stop line | ||
| 4 | VI | Unmarked | ||
| 5 | VI | High Visibility + crossing island | ||
| 6 | II | Unmarked | ||
| Grid 3 | ||||
| 1 | II | High Visibility + crossing island | 40 | Brighter |
| 2 | VI | Unmarked | ||
| 3 | II | RRFB + crossing island + stop line | ||
| 4 | II | Unmarked | ||
| 5 | VI | RRFB + crossing island + stop line | ||
| 6 | VI | High Visibility + crossing island | ||
| Grid 4 | ||||
| 1 | VI | RRFB + crossing island + stop line | 25 | Darker |
| 2 | II | Unmarked | ||
| 3 | VI | High Visibility + crossing island | ||
| 4 | VI | Unmarked | ||
| 5 | II | RRFB + crossing island + stop line | ||
| 6 | II | High Visibility + crossing island | ||
Each crossing in one grid had the same posted speed limit and lighting conditions. This decision was made because of the length of the grid. Participants would not have enough time to adjust their eyes to different lighting conditions within the simulator. An example of grid 4 is shown in Figure 13, which had a 25-mph posted speed limit and darker lighting conditions.
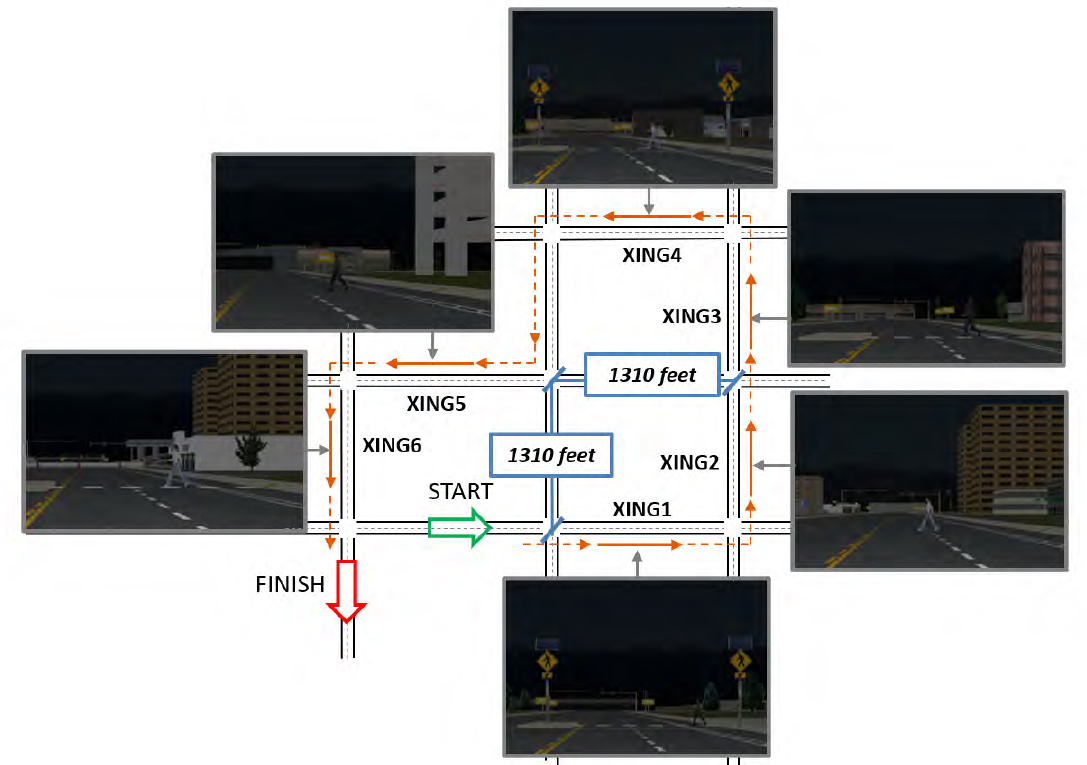
Dependent Variables
Overall, there are three dependent variables that were obtained from the driver via biometric and simulator equipment: visual attention, speed, and galvanic skin response.
- Visual Attention: defined as the total fixation duration (TFD), i.e., the cumulative time a driver spent looking at a specific area of interest (AOI). There were four AOIs selected, hence, four separate TFDs were measured. These were computed on a zone-level basis; however, their summation was used for data analysis.
- Speed: defined as the vehicle speed profile measured from the starting to ending point of each zone. For data analysis, the average incremental speeds were calculated per zone.
- Driver Stress Levels: defined as peaks per minute in galvanic skin response (GSR). These were recorded and analyzed on per-zone basis.
Experimental Protocol
Participant Recruitment
Fifty-five individuals chose to participate in this study who were recruited from Corvallis, Oregon and neighboring cities. Recruitment efforts consisted of advertising through various email listservs, social media posts, and flyers distributed throughout the community. Criteria for participation required participants to possess a driver’s license, be at least 18 years of age, not have a vision prescription higher than five (i.e., “moderate” visual impairment, treatable with glasses), and be capable of operating a vehicle physically, mentally, and legally. Upon starting the study, all participants were assigned a unique number to reduce the risk of identifiable information being available to those not involved in the conducting of study procedures. Additionally, security protocols were in place to prevent a breach of confidentiality in accordance with the OSU Institutional Review Board (IRB) approval (Study Number IRB-2021-1298).
Informed Consent and Compensation
Following protocols approved by the OSU IRB, all participants signed a written consent document upon arriving to the OSU Driving Simulator Lab and before beginning study procedures. The consent document outlined the risks and benefits associated with participation in the study, and OSU researchers obtained verbal and written consent regarding the participants’ willingness to participate. Additionally, study objectives and a brief description of the required tasks were included, but no indication of the experimental variables of interest. Compensation for participant’s time, energy, and commitment to helping advance transportation knowledge included $20 in cash. Occasionally, participants experienced simulator sickness forcing them to end the study early, in these scenarios participants still received the $20 compensation.
Pre-Drive Survey
After a participant’s consent was obtained, the pre-drive survey was administered on a computer. The pre-drive survey prompted demographic related questions to collect more information about the participants (e.g., age, gender, education). Also included were questions regarding prior experience with driving simulators to allow for assessment of their risk of feeling simulator sickness. Additionally, this survey includes questions from the following areas:
- Vision: Participants were required to report if they wear corrective lenses (glasses) while driving. The Tobii Pro Glasses allow for the use of adjustable lenses to correct for vision impairments of -5.00 to +5.00. This is especially important given the necessity to clearly observe potential hazards and read visual instructions within the simulated environment.
- Simulator Sickness: Those that have previously experienced simulator sickness were encouraged not to participate as this creates more risk for participants. Survey questionnaires asked participants about their previous driving simulation experience to ensure they did not have a high risk of experiencing these symptoms.
- Motion Sickness: The potential for experiencing motion sickness was surveyed for each participant by presenting questions about any prior instances. Individuals who responded that they had a strong tendency for motion sickness were made aware of the associated risks and encouraged not to participate.
Eye-tracker and GSR Sensor Configuration
Participants were first equipped with the Tobii Pro Glasses 3 eye-tracker. Prior to calibrating the eye-tracking glasses, participants were informed that once calibrated, the glasses cannot be adjusted any time after, including during the experimental drives. Participants were then allowed to make any last-minute adjustments to the placement of the glasses. Next, participants began the eye-tracking calibration, where they were tasked with looking directly at a target card located 1-2 feet away from their face. This typically took 3-5 seconds.
After the participant was outfitted with the eye-tracking glasses, they were equipped with the Shimmer3 GSR sensors. The auxiliary input was placed on the participant’s wrist of choice. If needed, any potentially conflicting garments on their wrists, such as smart watches, were removed. The three sensors were each placed at the base of the pointer, middle, and index finger. These sensors were wrapped around the participant’s fingers and wrist to ensure secure attachments while optimizing comfort and mitigating any constricting forces on the wrist and fingers.
Calibration Drive
Participants were instructed to perform any necessary vehicular adjustments (i.e., seat position, rearview mirror, steering wheel) to increase comfort and provide the most authentic driving experience upon entering the OSU Passenger Car Driving Simulator. Additionally, a calibration drive was provided. The calibration drive was always the first exposure to operating the simulated vehicle and allowed the participant to familiarize themselves with aspects such as the acceleration and steering of the vehicle while also assessing the risk of simulator sickness; this drive took between three to five minutes. Participants were instructed to operate the vehicle as they normally would on the roadway, and that they should obey all traffic laws regardless of the fact that they were in a simulated environment. Provided the purpose of the calibration drive is to allow the participant to get familiar with the equipment, the track featured lighting conditions similar to grid one, but no other independent variables (i.e., treatments or pedestrians) were included. This design helped minimize the risk that participants would formulate inferences about the study motivations.
No data collection occurred during the calibration drive. Feelings of simulator sickness or discomfort felt by participants during this drive resulted in all experimental trials being terminated for that participant. Figure 14 provides a view of one intersection in the calibration drive that featured ambient traffic but no pedestrians or treatment variables.

Experimental Drives
Participants that successfully completed the calibration grid without experiencing simulator sickness were then exposed to the experimental drive, which is when eye-tracking, GSR, and SimObserver data collection began. Participants were only provided information on when and where to turn in order to stay on the experimental track, and were not provided with any information about the experimental scenarios with the exception of being instructed to drive as they normally would. Grid order was randomized for each participant based on lighting conditions. If the participant first grid had a brighter lighting condition, their second grid would be rendered with the same lighting condition. Then the third grid would be presented with the alternate lighting condition (darker). This was purposely chosen, so drivers did not need to adjust their eyes between each grid. Half of the participants drove the darker lighting conditions first, and the other
half drove the brighter lighting conditions first (i.e., a classic crossover experimental design). Additionally, a brief break was situated between each grid to limit fatigue risk and assess for simulator sickness. Completion of all four grids took 20 to 30 minutes for each participant.
Post-Drive Survey
Following the removal of the biometric equipment, participants were informed of the next and last task, the post-drive survey. The survey was administered on a desktop computer through Qualtrics. The purpose of the post-drive survey was to better understand participants’ self-reported perceived level of comfort and decision-making at mid-block crossings. A Likert response scale was used to understand the degree of pedestrian visibility as perceived by the participants. After completing the survey, participants were compensated and informed of the study purpose.
From start to finish, the experiment lasted between 50-60 minutes. In summary, the order of tasks completed was as follows: consent process, pre-drive survey, outfitting of the eye-tracker and GSR sensor equipment, calibration of the eye-tracker glasses, calibration drive, experimental drives, post-drive survey, and compensation.
Data Processing
For this study, data was collected for three performance measures: the driver’s performance (speed and position), visual attention, and stress levels. These were individually reduced and collectively analyzed to describe driver behavior. Vehicle position and speed data were recorded in real time via SimObserver, a component of the passenger car driving simulator that extracts and reports vehicle kinematic data. Additionally, two types of biometric data were collected in real time. Visual attention was captured using Tobii Pro (eye-tracking) Glasses 3. Shimmer 3 GSR sensors were equipped to participants to capture their stress levels across each scenario. All three types of data are collectively used to assess driver behavior (e.g., velocity, yield decision, stress) when they are navigating the mid-block crossing treatments and interacting with crossing pedestrians.
Simulator Data
Via SimObserver, instantaneous speed and positioning data were recorded (at 60 Hz) for the subject and the crossing pedestrian. The parameters and their purpose in data analysis are listed below.
- Time – used for the mapping of speed and acceleration changes in regard to the position of the simulated vehicle.
- Instantaneous velocity of subject vehicle – used to assess driver behavior when approaching a midblock crossing.
- Instantaneous acceleration/deceleration of subject vehicle – used for evaluating driver response to intersection treatments by identifying sudden acceleration or deceleration approaching the intersection.
Eye-Tracking data
The visual attention data was wirelessly transmitted to iMotions data reduction software on the host computer. This data was collected and reduced on a per-zone basis across all scenarios. Each scenario data collection began 312 feet upstream of the mid-block crossing and the evaluation terminated when participants cleared the crossing, and the pedestrian was no longer visible. This resulted in multiple 10-60 second duration exposures, with the total observation window varying in response to the participants’ velocity and associated stopping requirement of the scenario being evaluated. Assessment of eye-tracking fixations consisted of the incremental coding of polygons around specific AOIs which were adjusted and anchored every 100 ms. Three AOIs were defined as important: (1) pedestrian, (2) crosswalk, and (3)
RRFB. Figure 15 contains a screenshot from the iMotions software of the polygons drawn in the visual field over corresponding AOIs.
GSR Data Reduction
GSR and PPG signal data was collected and wirelessly communicated to the external computer running iMotions EDA/GSR Module software. Included in the iMotions software package is a data analytics tool which allowed for automated peak detection and time synchronization to be executed within the boundaries of the scenarios of interest. GSR peaks per minute (PPM) were evaluated as the primary indicator of stress as this unit of measurement controls the natural variation across peak stress responses regardless of the length of observation window. The PPM was reported on a per-zone basis. These values were analyzed at the zone-level and at the scenario-level, as the maximum PPM measured across the scenario.
Statistical Analysis
A Linear Mixed Model (LMM) was performed to understand variations in the dependent measurements and participant response to the independent variables of interest. LMM was used to analyze the data because of (1) its ability to manage errors generated from repeated participant variables as participants were exposed to all scenarios, (2) its ability to manage fixed or random effects, (3) its consideration of categorical and continuous variables, and (4) its low probability of Type I error occurrence (Jashami et al., 2019). After exclusions for simulator sickness, data cleaning, and validation, the sample size was 42 participants, exceeding the LMM’s minimum sample size requirement of 20 (Barlow et al., 2019). Thus, LMM was selected as the preferred method to model and analyze the data, and made use of the following formula to do so:
yij = β0 + β1Xij + bi0 + εij,
bi0 ~ iidN(0, ),
εij ~ iidN(0, ).
β0 is the population level intercept while β1 is the slope when considering variable level X1. The random intercept (bi0) considers the ith participant with variance and following a mean normal distribution. εij is the error term. Therefore, there is an assumption that bi0 and εij are independent.
Analytical techniques were designed using R software to develop three models for each dependent measurement (driver’s velocity, visual attention, and GSR). The independent variables of roadway treatment, lighting, pedestrian skin pigmentation, and posted speed limit were all considered within the models. Provided these variables were carefully designed to have slight incremental adjustments and were kept the same across all participants, they were included as fixed effects alongside participant demographics (i.e., age, gender, etc.) in the LMM model. LMM could be used to estimate how the experimental variables affect drivers’ velocity approaching a mid-block crossing, TFD, and level of stress, which is appropriate given the repeated measures of the experimental design (Jashami et al., 2019). Researchers used Pearson’s correlation coefficient to determine if any variables correlate to each other (Jashami et al., 2019). Additionally, custom post hoc contrasts were performed using Fisher’s Least Significant Difference (LSD) to do multiple comparisons (Jashami et al., 2019). All statistical analyses were conducted at a 95% confident level and the Restricted Maximum Likelihood estimates was used to develop this model (Jashami et al., 2019).
Data Analysis and Results
In the following section, a comprehensive summary of results is provided. The in-experiment design measures are reported individually (velocity, visual attention, GSR). The presentation of these results provides context and reason for the post-experiment survey results to follow.
Participant Sample
Sample Size
Fifty-five participants were recruited from Corvallis and the surrounding region. The participant ages ranged from 18-78 years old, with a mean (M) age of 34.9 and a standard deviation (SD) of 17.2 years. Nine out of fifty-five participants experienced simulator sickness and were not able to complete the experiment, while four participants data were removed due to technical issues. This reduced the total sample size to 42 (M = 31.4, SD age = 14.6). The final sample size that was analyzed for the three data sources were different due to data lost during the experiment. The final analyzed sample was 41 for the eye-tracking data, 40 for the GSR data, and 42 for the SimObserver (speed) data, as shown in Table 24.
Table 24: Final Sample Size
| Data Source | Data Lost | Final Analyzed Sample | Male | Female | Nonbinary |
|---|---|---|---|---|---|
| SimObserver (i.e., speed) | 13 | 42 | 20 | 19 | 3 |
| Eye-Tracker | 14 | 41 | 21 | 18 | 2 |
| GSR | 15 | 40 | 19 | 18 | 3 |
Pre-Drive Survey
The purpose of the pre-drive questionnaire was to gather basic demographic information. In the following section, these results are presented.
Demographics
The demographic information about the participants was gathered from the pre-drive survey (shown in Table 25). A higher percentage of participants was 18-24 years old (42.9%), White or Caucasian (54.8%), and made less than $25,000 annually (35.7%) compared to other categories.
Table 25: Pre-Drive Questionnaire Demographic Response (adapted from Hurwitz et al., 2023)
| Category | Demographic Variable | Count | Percentage |
|---|---|---|---|
| Age | 18-24 | 18 | 42.9 |
| 25-34 | 12 | 28.6 | |
| 35-44 | 6 | 14.3 | |
| 45-54 | 2 | 4.8 | |
| 55-64 | 1 | 2.4 | |
| 65+ | 3 | 7.1 | |
| Race/Ethnicity | American Indian or Alaska Native | 1 | 2.4 |
| Asian | 14 | 33.3 | |
| Black or African American | 0 | 0.0 | |
| Hispanic or Latino/a | 3 | 7.1 | |
| White or Caucasian | 23 | 54.8 | |
| Other | 0 | 0.0 | |
| Prefer Not to Answer | 1 | 2.4 | |
| Income | Less than $25,000 | 15 | 35.7 |
| $25,000 to less than $50,000 | 4 | 9.5 | |
| $50,000 to less than $75,000 | 7 | 16.7 | |
| $75,000 to less than $100,000 | 3 | 7.1 | |
| $100,000 to less than $200,000 | 6 | 14.3 | |
| $200,000 or more | 2 | 4.8 | |
| Prefer Not to Answer | 4 | 9.5 | |
| Education | Some High School or Less | 0 | 0.0 |
| High School Diploma or GED | 1 | 2.4 | |
| Some College | 11 | 26.2 | |
| Trade/Vocational School | 0 | 0.0 | |
| Two-Year Degree | 2 | 4.8 | |
| Four-Year Degree | 13 | 31.0 | |
| Master’s Degree | 11 | 26.2 | |
| Doctorate Degree | 3 | 7.1 | |
| Prefer Not to Answer | 1 | 2.4 | |
| What, if any, corrective eye-wear do you wear while driving? | Glasses | 9 | 21.4 |
| Contacts | 5 | 11.9 | |
| None | 23 | 54.8 | |
| Glasses & Contacts | 4 | 9.5 | |
| No answer | 1 | 2.4 | |
| Are you color blind? | Yes | 5 | 11.9 |
| No | 36 | 85.7 | |
| Prefer not to answer/do not know | 1 | 2.4 |
Additionally, participants were asked about their driving behavior and results are shown in Table 26. Most participants reported driving 2-10 times per week, and 1-2 hours per week. This sample drives less than the average person in the United States (Gross, 2019).
Table 26: Pre-Driving Questionnaire Driving Behavior Response (adapted from Hurwitz et al., 2023)
| Category | Demographic Variable | Count | Percentage |
|---|---|---|---|
| How often do you drive in a week? | 1 time per week | 4 | 9.5 |
| 2 to 4 times per week | 14 | 33.3 | |
| 5 to 10 times per week | 14 | 33.3 | |
| more than 10 times per week | 8 | 19.0 | |
| No answer | 2 | 2.4 | |
| About how long do you drive per week? | 0 to 1 hour | 7 | 16.7 |
| 1 to 2 hours | 16 | 38.1 | |
| 2 to 3 hours | 6 | 14.3 | |
| 3 to 4 hours | 6 | 14.3 | |
| More than 5 hours | 6 | 14.3 | |
| No answer | 1 | 2.4 |
Velocity
Yielding Behavior
The vehicle’s velocity data was measured and collected by SimObserver. The simulator velocity data was disaggregated into 16.5-foot increments to better understand if the independent variable influenced yielding behavior. The incremental vehicle velocity will be presented for general observations and comparisons. Figure 16 displays a comparison between velocity data in lighter and darker scenarios where the posted speed limit is 25 mph. Participants’ initial velocity is faster under darker roadway lighting and is slower 115.5 feet upstream from the crossing (the vertical red line) compared to the lighter roadway lighting condition. Figure 17 demonstrates a comparison of velocity data between pedestrian skin tones in areas with a 25-mph posted speed limit. Similar to the comparison of roadway lighting, drivers approach a mid-block crossing with pedestrian skin pigmentation VI faster initially and slow 165 feet upstream of the crossing (vertical red line) compared to the pedestrian skin pigmentation II. Figure 18 and Figure 19 show a comparison of crosswalk treatment velocity data at a speed limit of 25 and 40 mph, respectively. The average lowest velocity of drivers at a 25-mph posted speed limit is 55 feet upstream of an unmarked crossing, 66 feet upstream of a high-visibility crosswalk, and 82.5 feet upstream of an RRFB crossing (these values marked by colored circles corresponding to the treatment in each figure). The average lowest velocity of drivers at a 40-mph posted speed limit is 33 feet upstream of an unmarked crossing, 49.5 feet upstream of a high-visibility crosswalk, and 82.5 feet upstream of an RRFB crossing.
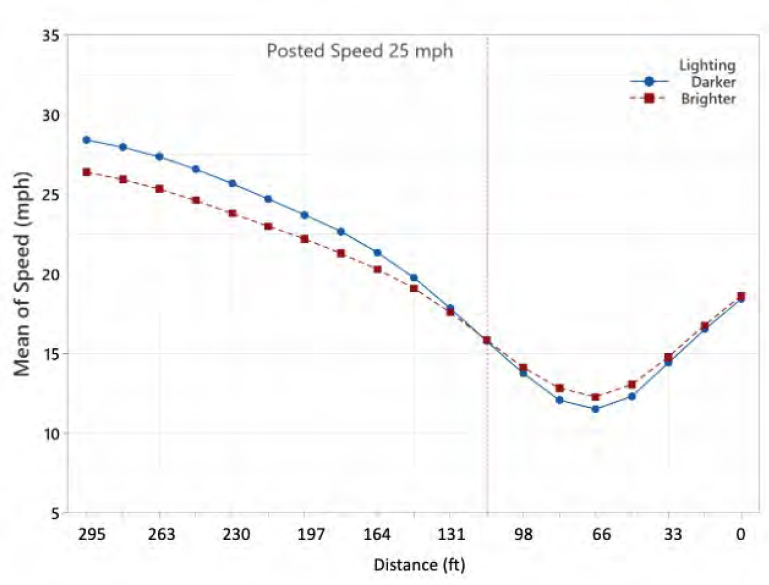
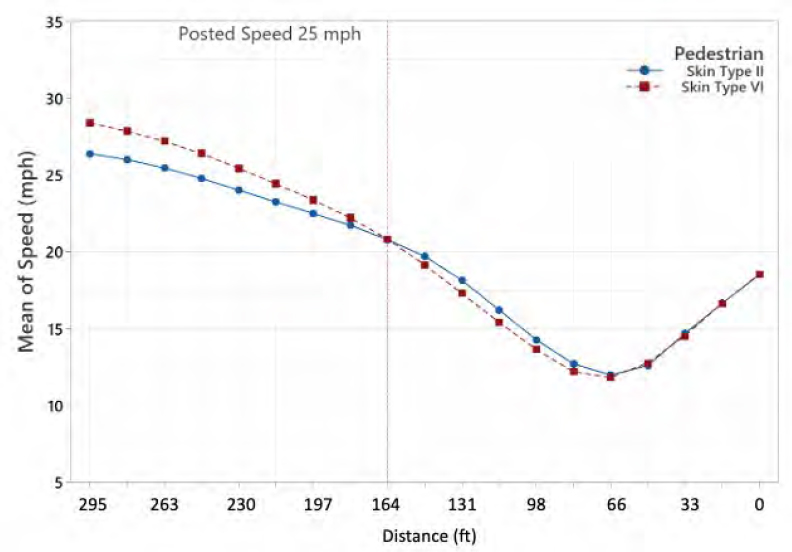
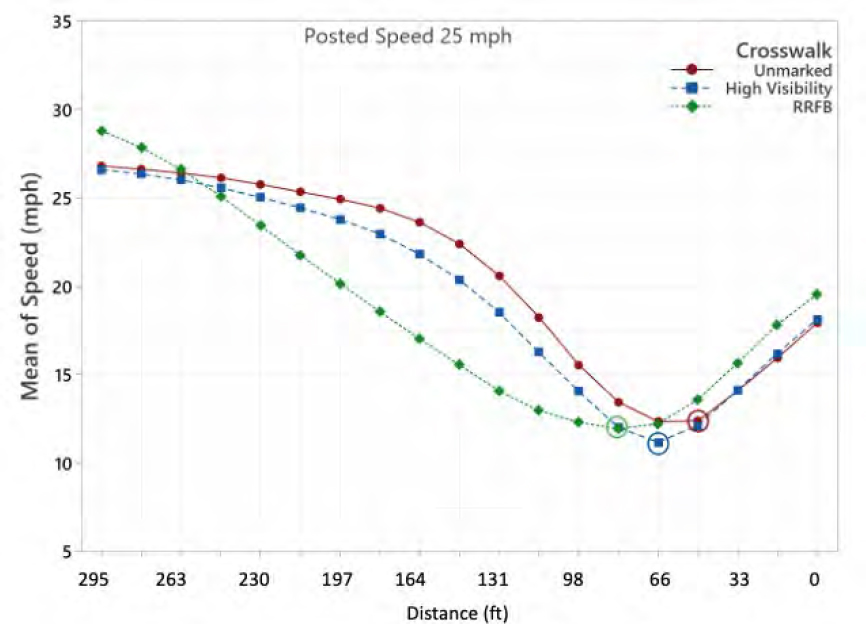
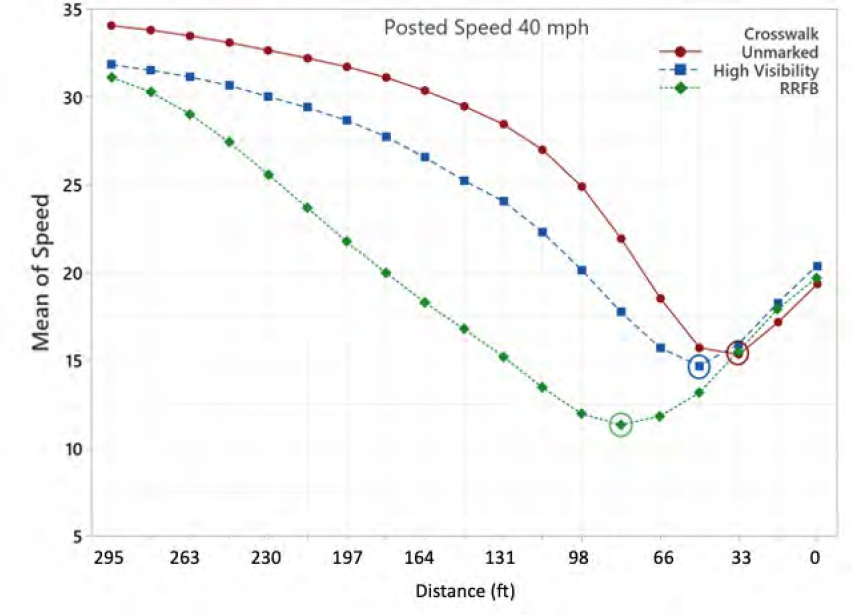
Crashes
While not a primary outcome of interest, crashes occasionally occur in simulators. In this case, ten participants were observed to have a crash or conflict with a pedestrian during the simulation experiment, a relatively common event in simulation research that does not necessarily reflect crash risk in real life. Figure 20 shows a comparison between non-crash and crash events. In the non-crash event, participants’ time-space diagram indicates that they started to decelerate 295 feet before the crossing. In contrast, participants abruptly decelerated 82 feet before the crossing during crash events. Table 27 shows the frequency of each variable category in the crash scenarios. Crashes mostly occurred when the speed limit was indicated as 40mph and at unmarked mid-block crossings.
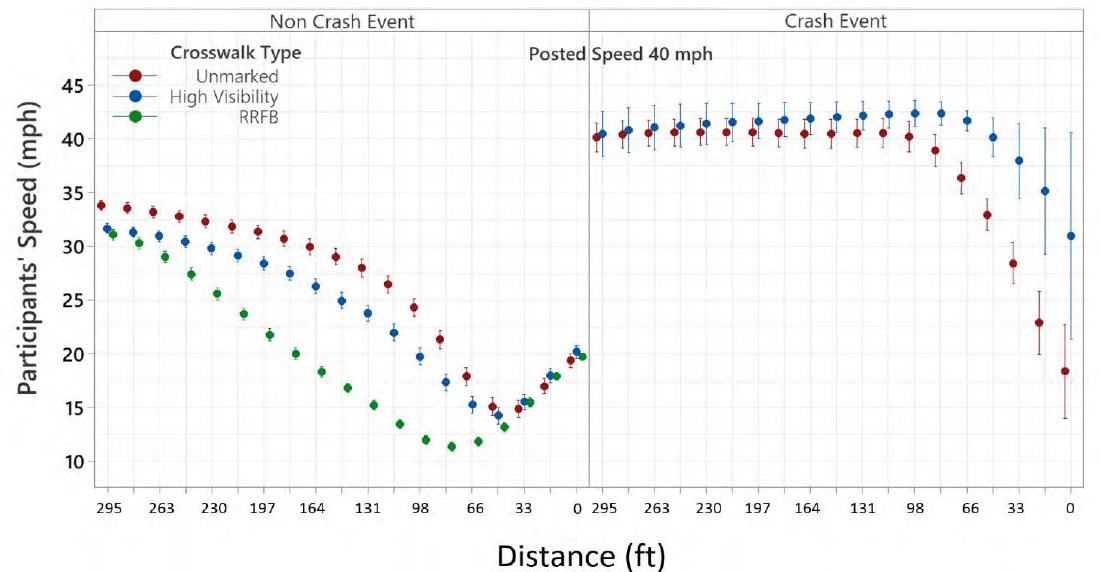
Table 27: Crash Variables
| Variable | Level | Count | Percentage |
|---|---|---|---|
| Speed Limit | 25mph | 1 | 10 |
| 40mph | 9 | 90 | |
| Lighting | Darker | 6 | 60 |
| Brighter | 4 | 40 | |
| Pedestrian Appearance | Skin Pigmentation II | 5 | 50 |
| Skin Pigmentation VI | 5 | 50 | |
| Crosswalk Treatment | Unmarked | 7 | 70 |
| High Visibility | 3 | 30 | |
| RRFB | 0 | 0 |
Velocity Statistical Modeling
Two statistical analyses (one for each posted speed limit) were conducted to better understand the participants’ velocity and to account for confounding variables generated from other factors. Both statistical analyses are LMM. This is due to the velocity being heavily correlated to the posted speed limit. Both statistical analyses findings can be seen in Table 28. For the 25 mph scenarios, the random effect (p < 0.001), distance from crosswalk starting at 247.5 feet (p < 0.013), lighting (p < 0.001), pedestrian appearance (p < 0.001), and all crosswalk treatments (p < 0.001) were determined to be statistically significant. For the 40 mph scenarios, the random effect (p < 0.001), distance from crosswalk starting at 165 feet (p < 0.013), pedestrian appearance (p < 0.001), and all crosswalk treatments (p < 0.001) were determined to be statistically significant.
Table 28: Summary of Estimated Model for Mean Velocity for Posted Speed Limit 25 mph and 40 mph
| Variable | 25 mph Posted Speed Limit | 40 mph Posted Speed Limit | ||||
|---|---|---|---|---|---|---|
| Estimate | Std. Error | P-Value | Estimate | Std. Error | P-Value | |
| Participant random effect (Var) | 9.34 | 0.568 | 0.000* | 27.08 | 1.576 | 0.000* |
| Constant | 28.45 | 0.523 | 0.000* | 36.09 | 0.868 | 0.000* |
| Distance from Crosswalk (ft) | ||||||
295 | Baseline | |||||
279 | -0.46 | 0.0729 | 0.525 | -0.47 | 1.214 | 0.700 |
262 | -1.07 | 0.0729 | 0.144 | -1.12 | 1.214 | 0.356 |
246 | -1.81 | 0.0729 | 0.013* | -1.95 | 1.214 | 0.109 |
230 | -2.67 | 0.0729 | 0.000* | -2.92 | 1.214 | 0.016* |
213 | -3.55 | 0.0729 | 0.000* | -3.91 | 1.214 | 0.001* |
197 | -4.44 | 0.0729 | 0.000* | -4.96 | 1.214 | 0.000* |
180 | -5.41 | 0.0729 | 0.000* | -6.06 | 1.214 | 0.000* |
164 | -6.58 | 0.0729 | 0.000* | -7.28 | 1.214 | 0.000* |
148 | -7.96 | 0.0729 | 0.000* | -8.52 | 1.214 | 0.000* |
131 | -9.67 | 0.0729 | 0.000* | -9.78 | 1.214 | 0.000* |
115 | -11.57 | 0.0729 | 0.000* | -11.44 | 1.214 | 0.000* |
98 | -13.41 | 0.0729 | 0.000* | -13.35 | 1.214 | 0.000* |
82 | -14.93 | 0.0729 | 0.000* | -15.33 | 1.214 | 0.000* |
67 | -15.48 | 0.0729 | 0.000* | -16.99 | 1.214 | 0.000* |
49 | -14.68 | 0.0729 | 0.000* | -17.83 | 1.214 | 0.000* |
33 | -12.76 | 0.0729 | 0.000* | -16.75 | 1.214 | 0.000* |
17 | -10.71 | 0.0729 | 0.000* | -14.54 | 1.214 | 0.000* |
0 | -9.95 | 0.0729 | 0.000* | -12.53 | 1.214 | 0.000* |
| Pedestrian Appearance | ||||||
Skin Pigmentation II | Baseline | |||||
Skin Pigmentation VI | 0.42 | 0.090 | 0.000* | -1.49 | 0.130 | 0.000* |
| Lighting | ||||||
Darker | Baseline | |||||
Brighter | -0.63 | 0.090 | 0.000* | 0.12 | 0.130 | 0.351 |
| Crosswalk Treatment | ||||||
Unmarked | Baseline | |||||
High Visibility | -0.82 | 0.110 | 0.000* | -2.43 | 0.159 | 0.000* |
RRFB | -2.14 | 0.110 | 0.000* | -6.90 | 0.159 | 0.000* |
| Summary Statistics | ||||||
| R2 | 67.07% | 65.77% | ||||
| -Log likelihood | 57724.00 | 65070.76 | ||||
* Statistically significant at 0.05 level
Visual Attention
Visual attention data was recorded using the iMotions Tobii Glasses 3 and reduced through the iMotions software (Jashami et al., 2024). As mentioned in the methods, the AOI polygons were drawn for each participant and when their gaze entered the polygon and fixated within the polygon for more than 10 milliseconds, that segment of time was marked as the participant fixating on that specific AOI. The performance measure representing participants’ visual attention on a specific AOI is called the Total Fixation Duration (TFD) in seconds, which is calculated as the cumulative time elapsed during every fixation across all three zones (approaching, transition, and turning).
AOI: Pedestrian
The total fixation duration on the pedestrian area of interest was evaluated to better understand how the independent variables affected the time spent viewing the conflict. The descriptive statistics shown in Table 29 and Figure 21 illustrate the TFD in seconds spent fixating on the pedestrian AOI. From this table, participants tended to fixate more on the pedestrian when going through the unmarked crosswalk than on the RRFB signals. The mean TFD on the pedestrian is consistently lower at 40 mph than 25 mph. Additionally, participants noticed the pedestrian 337.5 feet before the crossing approximately 33.3% of the time.
Table 29: Descriptive Statistics for Total Fixation Duration on Pedestrian Area of Interest
| Countermeasure | Stats | Skin Pigmentation II | Skin Pigmentation VI | ||||||
|---|---|---|---|---|---|---|---|---|---|
| 25 mph | 40 mph | 25 mph | 40 mph | ||||||
| Brighter | Darker | Brighter | Darker | Brighter | Darker | Brighter | Darker | ||
| Unmarked | μ | 3.53 | 3.70 | 3.08 | 3.07 | 3.12 | 3.98 | 3.36 | 3.23 |
| SD | 2.16 | 2.40 | 2.11 | 2.18 | 2.02 | 2.48 | 2.40 | 2.41 | |
| High Visibility | μ | 3.71 | 3.22 | 2.51 | 2.63 | 3.42 | 3.28 | 3.28 | 2.86 |
| SD | 2.33 | 2.30 | 2.01 | 2.03 | 2.17 | 2.17 | 2.14 | 1.97 | |
| RRFB | μ | 2.86 | 2.50 | 2.18 | 2.02 | 2.78 | 2.86 | 2.54 | 2.34 |
| SD | 2.18 | 1.95 | 1.99 | 1.53 | 2.12 | 2.40 | 2.04 | 1.94 | |
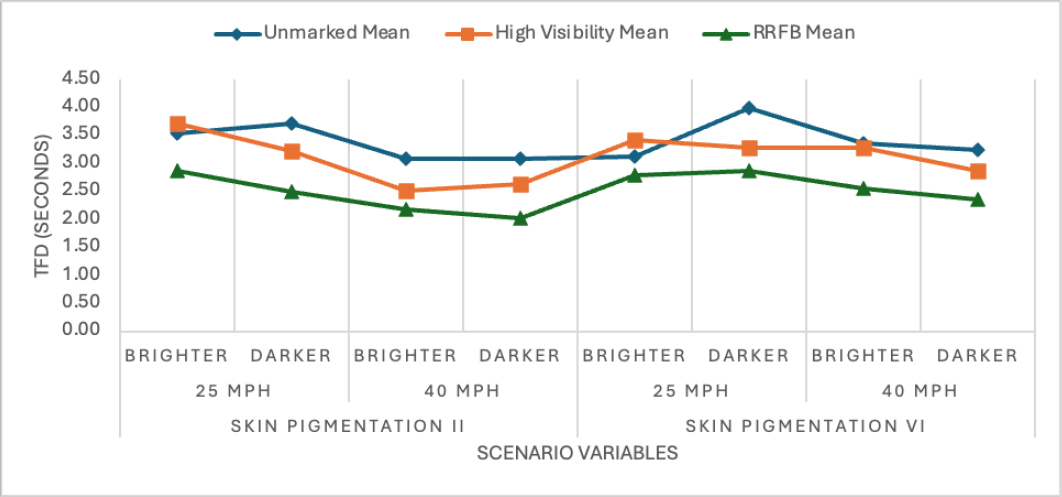
Pedestrian TFD Statistical Modeling
An analysis similar to the one performed for velocity was also conducted on the total fixation duration variable. The LMM model outputs are shown in Table 30. The random effects (p < 0.001), posted speed limit (p < 0.001), pedestrian appearance (p = 0.002), and all crosswalk treatments (p = 0.035 for high visibility and p < 0.001 for RRFB) are statistically significant. Additionally, a primary effects plot for different factors can be found in Figure 22. The primary effects plot demonstrates that drivers have a lower TFD on pedestrian when there is an unmarked crossing and if they are involved in a crash.
Table 30: Summary of Estimated Model for Mean Total Fixation Duration (Area of Interest: Pedestrian)
| Variable | Estimate | Std. Error | P-Value |
|---|---|---|---|
| Participant random effect (Var) | 2.74 | 0.588 | 0.000* |
| Constant | 3.38 | 0.277 | 0.000* |
| Posted Speed Limit | |||
25 mph | Baseline | ||
40 mph | -0.08 | 0.053 | 0.000* |
| Pedestrian Appearance | |||
Skin Pigmentation II | Baseline | ||
Skin Pigmentation VI | 0.26 | 0.084 | 0.002* |
| Lighting | |||
Darker | Baseline | ||
Brighter | 0.04 | 0.084 | 0.617 |
| Crosswalk Treatment | |||
Unmarked | Baseline | ||
High Visibility | -0.22 | 0.103 | 0.035* |
RRFB | -0.82 | 0.103 | 0.000* |
| Crosswalk Treatment | |||
No Crash | Baseline | ||
Crash | -1.93 | 0.744 | 0.011* |
| Summary Statistics | |||
| R2 | 65.13% | ||
| -Log likelihood | 3569.60 | ||
* Statistically significant at 0.05 level
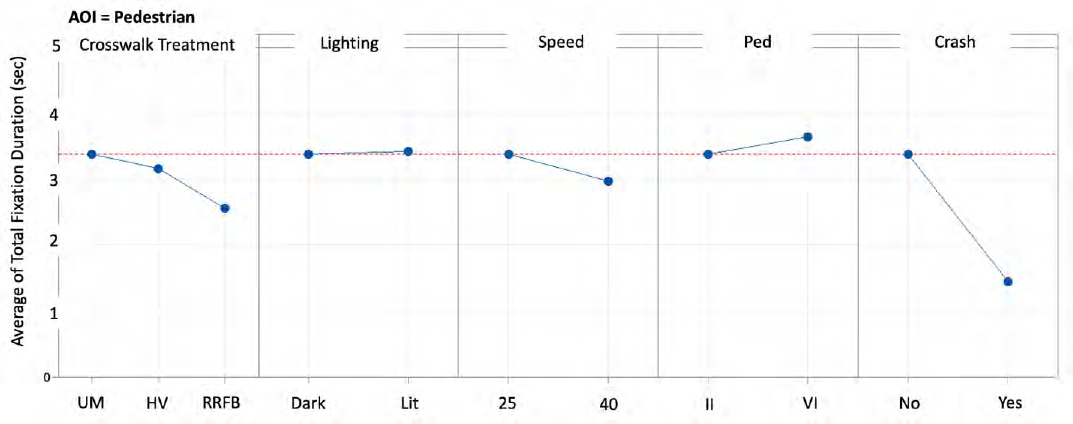
AOI: Crosswalk
TFD on the crosswalk AOI was also evaluated to determine whether the independent variables influenced the driver’s allocation of visual attention on the crosswalk treatments. The descriptive statistics in Table 31 and Figure 23 illustrate the TFD (seconds) spent on the crosswalk AOI. This evidence suggests that participants tended to fixate more on the crosswalk when the RRFB treatments were present.
Table 31: Descriptive Statistics on Total Fixation Duration for Crosswalk Area of Interest
| Countermeasure | Stats | Skin Pigmentation II | Skin Pigmentation VI | ||||||
|---|---|---|---|---|---|---|---|---|---|
| 25 mph | 40 mph | 25 mph | 40 mph | ||||||
| Brighter | Darker | Brighter | Darker | Brighter | Darker | Brighter | Darker | ||
| Unmarked | μ | 0.22 | 0.23 | 0.23 | 0.12 | 0.21 | 0.15 | 0.14 | 0.08 |
| SD | 0.63 | 0.59 | 0.57 | 0.32 | 0.56 | 0.37 | 0.32 | 0.25 | |
| High Visibility | μ | 1.00 | 1.05 | 1.09 | 0.89 | 0.98 | 0.98 | 0.85 | 0.92 |
| SD | 1.18 | 1.48 | 1.29 | 1.07 | 1.16 | 0.97 | 1.08 | 0.95 | |
| RRFB | μ | 1.21 | 1.05 | 1.14 | 1.02 | 1.08 | 0.71 | 0.85 | 0.77 |
| SD | 1.40 | 1.17 | 1.56 | 1.30 | 1.19 | 1.09 | 1.08 | 1.01 | |
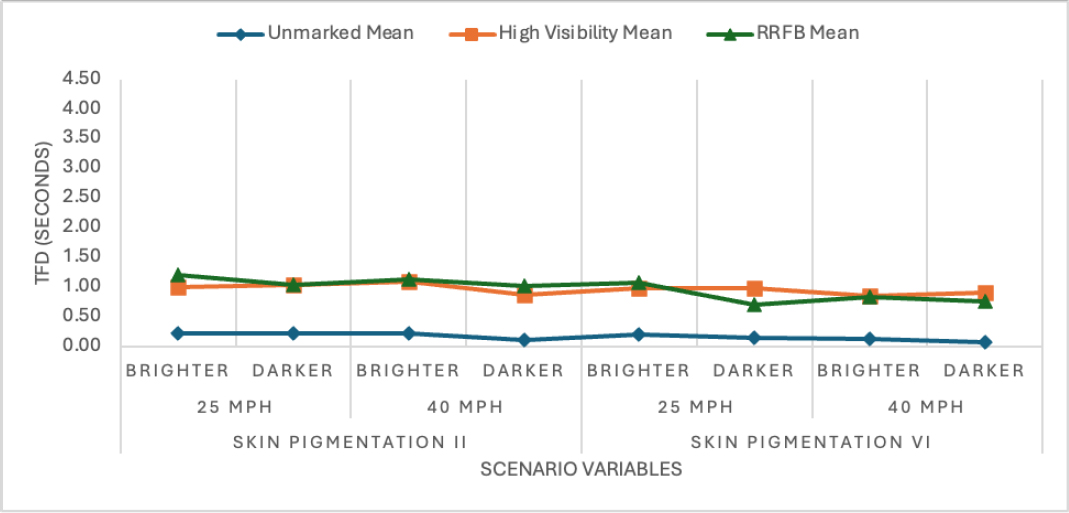
Crosswalk TFD Statistical Modeling
An LMM model was developed to better understand the participants TFD on crosswalk AOI and to account for any confounding variables. The results can be found in Table 32. The random effect (p < 0.001), pedestrian appearance (p = 0.004), and all crosswalk treatments (p < 0.001 for high visibility and RRFB) were statistically significant.
Table 32: Summary of Estimated Model for Mean Total Fixation Duration (Area of Interest: Crosswalk)
| Variable | Estimate | Std. Error | P-Value |
|---|---|---|---|
| Participant random effect (Var) | 0.33 | 0.081 | 0.000* |
| Constant | 0.23 | 0.111 | 0.042* |
| Posted Speed Limit | |||
25 mph | Baseline | ||
40 mph | -0.06 | 0.053 | 0.245 |
| Pedestrian Appearance | |||
Skin Pigmentation II | Baseline | ||
Skin Pigmentation VI | -0.15 | 0.053 | 0.004* |
| Lighting | |||
Darker | Baseline | ||
Brighter | 0.089 | 0.053 | 0.089** |
| Crosswalk Treatment | |||
Unmarked | Baseline | ||
High Visibility | 0.79 | 0.064 | 0.000* |
RRFB | 0.82 | 0.064 | 0.000* |
| Summary Statistics | |||
| R2 | 43.11% | ||
| -Log likelihood | 2600.17 | ||
* Statistically significant at 0.05 level; **statistically significant at 0.10 level
AOI: RRFB
TFD on the RRFB AOI was also evaluated to determine whether the independent variables influenced the driver’s allocation of visual attention on the RRFB experimental factor. The descriptive statistics in Table 33 and Figure 24 illustrate the TFD (seconds) spent on the RRFB AOI. Participants tended to fixate more seconds on the RRFB when the pedestrian skin pigmentation was VI rather than II. Additionally, participants noticed the RRFB 337.5 ft before the crossing approximately 73.3% of the time.
Table 33: Descriptive Statistics of Rectangular Rapid Flashing Beacon Total Fixation Duration
| Countermeasure | Stats | Skin Pigmentation II | Skin Pigmentation VI | ||||||
|---|---|---|---|---|---|---|---|---|---|
| 25 mph | 40 mph | 25 mph | 40 mph | ||||||
| Brighter | Darker | Brighter | Darker | Brighter | Darker | Brighter | Darker | ||
| RRFB | μ | 0.53 | 0.58 | 0.52 | 0.44 | 0.63 | 0.76 | 0.46 | 0.61 |
| SD | 0.92 | 0.86 | 0.78 | 0.66 | 0.99 | 0.94 | 0.79 | 0.93 | |
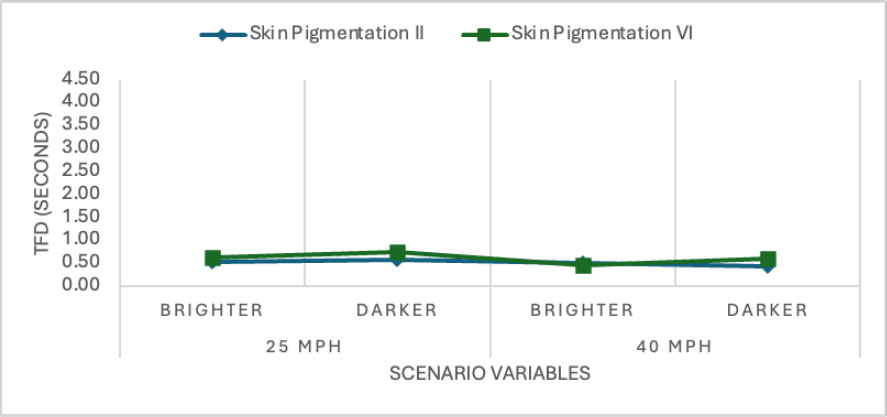
RRFB TFD Statistical Modeling
Similar to other dependent variables, an LMM was also developed to estimate the RRFB total fixation duration variable. The results can be found in Table 34. The random effect (p < 0.001), posted speed limit (p = 0.036), and the side of the RRFB (p = 0.017) were statistically significant.
Table 34: Summary of Estimated Model for Mean Total Fixation Duration (Area of Interest: Rectangular Rapid Flashing Beacon)
| Variable | Estimate | Std. Error | P-Value |
|---|---|---|---|
| Participant random effect (Var) | 0.25 | 0.048 | 0.000* |
| Constant | 0.46 | 0.098 | 0.000* |
| Posted Speed Limit | |||
25 mph | Baseline | ||
40 mph | -0.11 | 0.054 | 0.036* |
| Pedestrian Appearance | |||
Skin Pigmentation II | Baseline | ||
Skin Pigmentation VI | 0.01 | 0.054 | 0.069* |
| Lighting | |||
Darker | Baseline | ||
Brighter | -0.06 | 0.054 | 0.256 |
| RRFB Side | |||
Left | Baseline | ||
Right | 0.30 | 0.122 | 0.017* |
| Summary Statistics | |||
| R2 | 42.05% | ||
| -Log likelihood | 1533.46 | ||
Statistically significant at *0.05 level; **0.10 level
Level of Stress
The GSR data were measured and recorded using the Shimmer3 GSR+, which was paired with the iMotions software for reduction (Cobb et al., 2021). The GSR data is presented as average peaks per minute to control the natural variation between participants’ peak measures (Cobb et al., 2021). A peak is defined as a positive deviation from a calculated baseline (Cobb et al., 2021). The magnitude represents participants’ reactions, in terms of level of stress, to the scenarios.
GSR Results
GSR results were used to evaluate whether independent variables impacted the participants’ stress when responding to the presence of pedestrians. The descriptive statistics in Table 35 and Figure 25 are calculated to describe peaks per minute in GSR readings. Participants had a greater frequency of peaks/minute when driving through the unmarked crossings as compared to the other crosswalk treatments, higher peaks/minute when driving in brighter lighting than darker lighting conditions, and higher peaks/minute when driving a 40-mph speed limit than 25 mph speed limit grid.
Table 35: Descriptive Statistics on Galvanic Skin Response
| Countermeasure | Stats | Skin Pigmentation II | Skin Pigmentation VI | ||||||
|---|---|---|---|---|---|---|---|---|---|
| 25 mph | 40 mph | 25 mph | 40 mph | ||||||
| Brighter | Darker | Brighter | Darker | Brighter | Darker | Brighter | Darker | ||
| Unmarked | μ | 3.98 | 3.30 | 3.52 | 4.22 | 3.45 | 3.53 | 4.49 | 3.75 |
| SD | 4.69 | 4.40 | 4.36 | 4.54 | 4.43 | 5.00 | 5.14 | 4.71 | |
| High Visibility | μ | 2.88 | 2.30 | 3.01 | 3.29 | 3.08 | 2.75 | 1.38 | 3.21 |
| SD | 4.18 | 3.04 | 4.91 | 4.54 | 4.04 | 4.51 | 2.62 | 4.65 | |
| RRFB | μ | 2.96 | 2.69 | 3.37 | 3.13 | 2.79 | 3.21 | 2.42 | 2.27 |
| SD | 4.69 | 3.87 | 4.50 | 4.77 | 4.54 | 3.54 | 3.16 | 3.07 | |
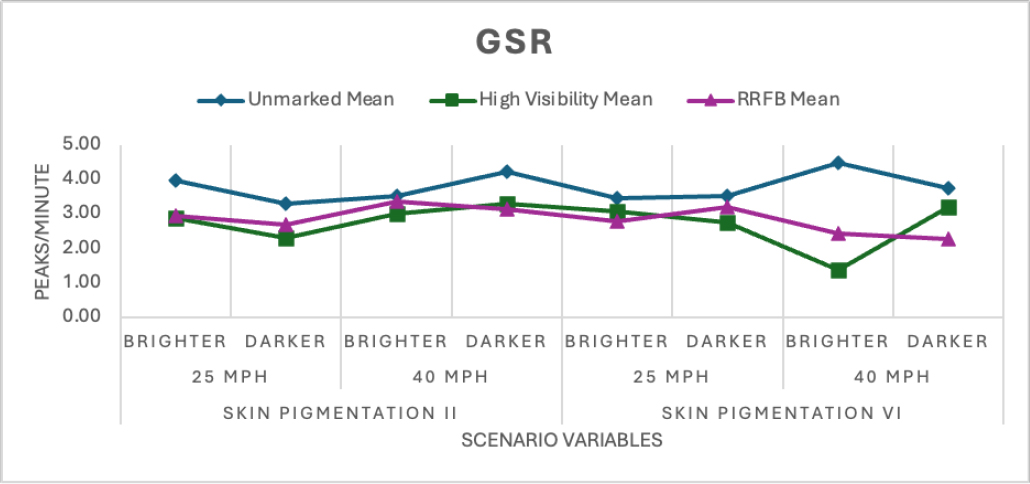
GSR Statistical Analysis
An analysis similar to the ones performed for velocity and TFD was also conducted on the GSR variable. The LMM model’s outputs are shown in Table 36. The random effect (p < 0.001) was substantial, which suggests that treating the participant as a random variable was necessary. Results also indicate that all crosswalk treatments were statistically significant.
Table 36: Summary of Estimated Model for Mean Galvanic Skin Response
| Variable | Estimate | Std. Error | P-Value |
|---|---|---|---|
| Participant random effect (Var) | 6.79 | 1.650 | 0.000* |
| Constant | 3.83 | 0.493 | 0.000* |
| Posted Speed Limit | |||
25 mph | Baseline | ||
40 mph | 0.13 | 0.222 | 0.563 |
| Pedestrian Appearance | |||
Skin Pigmentation II | Baseline | ||
Skin Pigmentation VI | -0.20 | 0.221 | 0.373 |
| Lighting | |||
Darker | Baseline | ||
Brighter | -0.06 | 0.222 | 0.772 |
| Crosswalk Treatment | |||
Unmarked | Baseline | ||
High Visibility | -1.05 | 0.271 | 0.000* |
RRFB | -0.92 | 0.271 | 0.001* |
| Summary Statistics | |||
| R2 | 39.52% | ||
| -Log likelihood | 5153.26 | ||
*Statistically significant at 0.05 level
Discussion
In the following section, the most insightful findings, and observations with potential implications on driver and pedestrian safety are discussed.
Speed Limit
Speed limit plays a significant role in drivers’ velocity and yielding behavior. According to the study’s survey, 65.1% of participants indicated that they typically drive above the speed limit in real life. This is reflected in the simulation’s baseline scenario where the speed limit was 25mph, and the average velocity of participants was approximately 29 mph. When the speed limit is higher, the average total fixation duration (TFD) on a pedestrian and on an RRFB is lower. This may be because the participants are approaching the mid-block crossing faster and have less time to fixate on the pedestrians and other design treatments as was reported by human factors expert, Mark Green (Green, 2022). The lower speed limit allows a greater mean TFD at unmarked locations in dark conditions. Additionally, the average participant’s level of stress is higher when the speed limit is higher. This may be attributed to the shorter amount of time available to react when traveling at a higher speed, producing greater stress when encountering a crossing pedestrian. Nine of the ten observed crashes – where the participant was involved in a conflict with the crossing pedestrian – occurred when the speed limit was posted at 40 mph. This correlates with most participants (79.1%) indicating that they found it more difficult to recognize a pedestrian when the speed
limit was 40 mph. The results correlate with previous studies where higher speed limits are often attributed to more frequent pedestrian conflicts (Tefft 2013; Oxley et al. 2020; Ferenchak and Abadi 2021).
Lighting Conditions
Lighting conditions have been observed to reduce pedestrian crashes at midblock crossings (Siddiqui et al. 2006). Based on the post-driving survey, 86% of participants indicated that additional roadway lighting helped with visibility. This is reflected in the simulator velocity data, where participants slowed down closer to the crosswalk in darker scenarios compared to brighter scenarios. Additionally, participant’s level of stress was higher in the darker roadway lighting condition. This may be due to the uncertainty of the driver in darker conditions. Based on the linear mixed model, pedestrian and crossing TFD was 0.04 and 0.089 seconds more when brighter, respectively. RRFB TFD was 0.05 seconds less when brighter. Evidence suggests that lighting helped participants detect the presence of the pedestrian and crosswalk more (Rea et al. 2009; Siddiqui et al. 2006; Sanders et al. 2020). Additionally, the RRFB captured participant’s visual attention more in darker roadway lighting conditions. This may be because the RRFB is more apparent in the darker roadway lighting conditions, consistent with previous research that found RRFBs to be more effective at night than in daytime conditions (Fitzpatrick & Park 2021; Goswamy et al. 2023).
Pedestrian Appearance
Pedestrian appearance differences were not mentioned during the advertisement of this study to minimize bias. During the post-survey, participants were asked if they noticed any differences between the pedestrians. Ninety-five percent of participants said they noticed something different with the pedestrians. In response to a follow-on open-ended survey item, 84% of all participants mentioned that they noticed that the simulated pedestrians’ appearances had different skin pigmentation and clothing. Additionally, participants seemed to have a longer total fixation duration on pedestrians with skin pigmentation VI as compared to skin pigmentation II by 0.26 seconds. This may be because the participants are trying to search for the pedestrian since they are harder to identify, especially in nighttime conditions as supported by findings of previous research where pedestrians wearing darker colors are harder to identify than a pedestrian wearing lighter color clothing (Babić et al. 2021; Wood et al. 2005; Tyrrell et al. 2016).
Mid-Block Crossing Treatment
Mid-block crossing treatments have been suggested to improve pedestrian safety (Chen et al. 2013; Fitzpatrick et al. 2016; Sanders et al. 2020). Most participants reported that high-visibility striping (72.1%) and RRFB (95.3%) helped them detect the pedestrian crossing. This survey finding correlated well with observations from the driving simulator scenarios where participants yielded earlier for mid-block crossings with high-visibility markings and a RRFB than unmarked crossings for both posted speed limits (25 mph and 40 mph). Unmarked crosswalks had a higher average velocity, and RRFB crossings had a lower average velocity. This was also the case with the level of stress, where participants tended to have a higher level of stress at unmarked crosswalks compared to the other two design treatments. Participants experienced an average GSR reading of 1.05 peaks/minute at high-visibility crosswalks, and 0.92 peaks/minute less at RRFB crossings. Additionally, participants had a higher TFD for pedestrians at unmarked crossings than high-visibility crosswalks and RRFB crossings. They also had a higher TFD for the high-visibility crossings. Lastly, 70% of crashes occurred at unmarked crossings and 30% of crashes occurred at high-visibility crosswalks; there were no crashes on segments with RRFBs. The evidence produced in this driving simulator study suggests that high-visibility and RRFB crossings influence driver’s visual attention at night. Specifically, the greater TFD and yielding behavior for RRFB crossings indicate that pedestrians were detected sooner when those treatments were present than at the other crossing treatments. Overall, drivers tended to yield more to the pedestrian, fixate on the infrastructure more, and experience less stress when traversing mid-block crossings with design treatments.
Limitations
There are limitations to this driving simulator study, as with all studies. It would have been desirable to include glare as an independent variable, but glare is difficult to replicate in a robust way in a driving simulator environment. While we had a robust sample size for this driving simulation experiment, we had a large proportion of younger drivers whose driving experience will differ from the older population of drivers. Our sample also did not include any Black or African American participants. While driver behavior is not known to differ according to race/ethnicity, as compared to age and sex, it is possible that a different driver sample would have behaved differently. Although the within-subject experiment design of this study provides higher statistical power without requiring significantly large sample sizes, participants may still experience fatigue over the scenarios due to their repeated measures. As stated earlier, several steps were taken to reduce the potential effects of fatigue and learning. For example, the order of the scenarios was partially randomized, experimental driving time was minimized, and breaks were offered during the experiment. While the designed scenarios in the driving simulator were based on real-world conditions, participants’ behavior may differ from real-life responses. Even with this potential source of limitation, the relative validity of scenarios provides a robust way to differentiate the experimental factors (Chai et al., 2024).
Conclusion
This driving simulation experiment assessed factors that might affect and improve pedestrian safety during nighttime conditions. We captured usable data from 42 participants, who drove through several scenarios with different combinations of experimental factors (i.e., posted speed limit, roadway lighting, pedestrian appearance, and mid-block crossing treatment). The data collected were used to explore how the treatment factors affected drivers’ yielding behavior, velocity, visual attention (TFD), and level of stress (GSR). We controlled for learned behaviors through randomization of the scenarios and the overall length of the experiment. The results of this study provide valuable findings for transportation professionals to consider both for pedestrian safety overall and specifically when implementing or redesigning mid-block crossings for nighttime conditions.
Time-space measurements were utilized to study participants’ yielding behavior and velocity. Researchers initially believed that participants would have an improved reaction time if the speed limit was lower and in the presence of a design treatment with a high-visibility crosswalk. This hypothesis was supported by the simulator study, which found that both a lower posted speed limit and the presence of high-visibility markings or Rectangular Rapid Flashing Beacon (RRFB) crossing increased the distance drivers yielded from the crosswalk.
Eye movement data were used to assess participants’ visual attention on the pedestrian and crossing treatment. Initially, researchers predicted that Skin Type II pedestrians would be more visible than Skin Type VI pedestrians; However, the data indicated that participants allocated more time looking at pedestrians with Skin Type VI. Researchers also hypothesized that a lower speed limit, the presence of roadway lighting, and mid-block crossing treatments with high-visibility markings would increase drivers’ attention to pedestrians. Our results supported this hypothesis, indicating that the lower speed limit provided participants more time to look at the pedestrians, brighter lighting conditions increased attention toward the crosswalk, and mid-block crossing treatments with high-visibility markings increased drivers’ visual attention.
Galvanic Skin Response (GSR) of participants revealed their level of stress throughout the experiment. It was initially thought that a higher speed limit, darker lighting, and mid-block crossings without high-visibility markings would decrease participants’ attention and/or, at least for darker lighting, create a higher-
stress driving environment, thus increasing the level of stress in those scenarios. This prediction was supported by the research findings, as stress was higher when participants drove through segments with unmarked crossings, higher speed limits, and in darker lighting conditions.
Overall, this research suggests that slower speeds are important for drivers to be able to detect and react to pedestrians. The implementation of high-visibility markings enhances driver detection at lower speeds and is even more critical – and can be paired with an RRFB or similar high-visibility countermeasure – at higher posted speed limits. Our data show that these changes improve drivers’ visual attention and yielding rates in response to pedestrians during nighttime conditions.
Lastly, a limited number of independent variables and variable levels, along with constant roadway geometry, were used due to time and resource constraints. Future research can study different lighting levels and their impact on driver behavior. Additionally, future experiments could incorporate new variables or employ varying roadway designs that might impact the results, specifically, related to pedestrian crossing during nighttime conditions.
2.4 Focus Groups
The next phase of the research was a series of focus groups to investigate driver and pedestrian behaviors in darkness. The goals of the focus groups were to validate and supplement findings from the crash analysis, driver simulation, and literature review, as well as to better understand how people qualitatively assess their risks as a pedestrian and a driver, and to see how their behaviors may (or may not) change because of those risks.
Methodology
Focus Group Scripts
The project team created two scripts for the focus groups - one that focused on pedestrian behavior in the dark and the other that focused more heavily on driver behavior in the dark. These scripts included a series of questions that surfaced areas of uncertainty from the crash analysis as well as behaviors that transportation professionals often assume (or hope for) when planning and designing places for pedestrians to walk at night. The script used intentionally broad questions to allow the participants to discuss their natural behaviors or the points they believed to be most important; additional questions in the script were added as prompts for the facilitator to initiate or focus responses.
Both the pedestrian and driver focus group scripts began with questions about where participants lived in their respective cities, how often they walked or drove at night, and the major reasons for taking those trips at night. The pedestrian focus group script then directed participants to talk about how safe they felt during the day versus in the dark with respect to transportation (e.g., crashes) and overall (e.g., personal safety, crime, etc.). Next, the script included questions about crossing behaviors and how participants are (or are not) affected by the presence of crossing infrastructure (e.g., signals, crosswalks), street type (e.g., arterials, residential), or area of the roadway (e.g., midblock vs. intersection). The script then focused on visibility, both to understand how visible to drivers the participant thinks they are while walking at night and whether they do anything to make themselves more visible at night when walking (e.g., wear reflective gear, carry a flashlight, etc.). Lastly, the script asked participants for recommendations to improve safety for people walking in the dark in their city.
The driver focus group script also included initial questions about frequency and trip type, and then moved to questions about how the participants’ driving behaviors differ during the day versus in the dark,
how they do (or do not) look for pedestrians when driving, and their driving behaviors in areas where pedestrians are expected (e.g., downtown, school zones, etc.). Next, the script included questions about visibility, focusing on what might be especially challenging to see at night and how internal vehicle lights (e.g., screens, phones) may impact nighttime visibility. The script then pivoted to asking about speed and what would make them drive more slowly in the dark. To wrap up, participants were asked for recommendations to improve safety for people walking and driving at night and to reduce the number and severity of crashes in their city. The full scripts can be found in Appendix D.
Each focus group included a project team facilitator and a notetaker. After the focus groups, the notetaker reviewed and cleaned the initial notes and sent them to the facilitator, who reviewed and revised the notes to add any missed points. The project team then categorized and coded the focus group data based on the question to which it referred, the information it conveyed, and key themes. This coding approach allowed the project team to synthesize the findings from the interviews and ensure that all relevant data points were included.
Focus Group Locations
The research team held a total of ten focus groups - five in Atlanta, GA, in October 2023 and five in Los Angeles, CA, in November 2023. The cities of Atlanta and Los Angeles were selected because both have significant rates of pedestrian crashes at night and a broad array of land uses spanning from dense urban to residential suburban within their city boundaries, making results fairly representative of other places throughout the country.
In addition, both Atlanta and Los Angeles are cities where a majority of residents – 71% and 60%, respectively – are People of Color. Given that pedestrian fatalities disproportionately involve People of Color (Smart Growth America 2024; Sanders and Schneider, 2022), the research team believed that the focus groups should reflect perspectives from these groups.
In Atlanta, four of the focus groups were held virtually and one was held in person at the Kirkwood Branch Library. There was another focus group scheduled at another library, but it was canceled due to low attendance. In Los Angeles, there were five focus groups - two virtual and three in person. Two of the in-person focus groups were held at a community-centric coffee shop in South Los Angeles, while the third in-person focus group was held at the Woodland Hills Branch Library in the north of the city.
The locations in both cities were selected with assistance from local project team staff and city staff using their knowledge of where there are high rates of pedestrian traffic at night, diverse demographic populations, and corridors on the cities’ High Injury Networks.
Focus Group Recruitment and Participants
The project team aimed for focus group participants to be lay residents of the city who regularly walk and/or drive at night but who did not have transportation knowledge or advocacy backgrounds. As a result, the project team attempted to recruit through neighborhood networks and word-of-mouth. The team created a flyer that was posted at libraries, community centers, coffee shops, grocery stores, and other community gathering spaces. In addition, a social media post and graphic was produced and sent out via neighborhood associations, community groups, and personal networks.
The flyer and social media post directed interested participants to a short online survey where they answered questions about their nighttime walking and driving habits, demographics, and availability. The project team used this information to distribute respondents into groups that worked best for their schedules
and ensured that the discussion was applicable to their walking or driving habits. As an incentive, participants were given $40 Visa gift card for their time. For those respondents that attended in-person meetings, refreshments were also provided.
There were 16 participants in the Atlanta focus groups and 13 participants in Los Angeles. Participants were asked to fill out a short demographic survey at the beginning of the discussion. Not all did, but of those who completed the survey, most were People of Color, women, and between the ages of 35 and 44. That said, the demographics differed from one city to another. In Los Angeles, participants skewed older and there was one male participant, in comparison to a broader range of ages and genders in Atlanta.
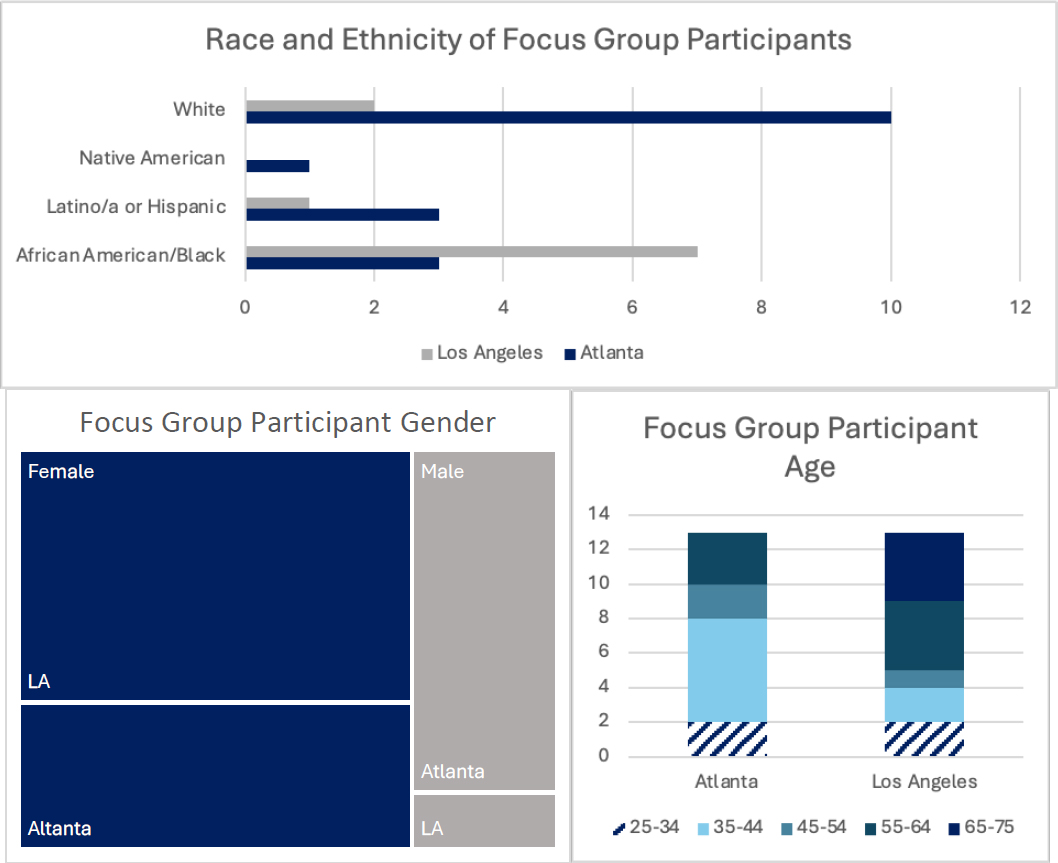
Findings
Focus group facilitators asked participants to share their behaviors, assumptions, and thoughts about walking and driving in the dark. The participants had a wide variety of input - some opinions were shared by many respondents and others were in opposition to each other. That said, there was an overarching belief by the participants that nobody’s behavior except their own could be trusted - they did not trust people driving to see them walking, obey signals, or drive the posted speed.
In addition, when driving, respondents did not trust pedestrians to cross at intersections or crosswalks, look for vehicles before stepping onto the road, or be intentionally visible by using lights or reflective gear. Nearly all participants, whether talking about their behaviors while walking or driving, emphasized that their behaviors were primarily informed by their belief that they knew the safest thing for them to do, regardless of infrastructure (e.g., signalized crossings) or speed limit, because nobody can be trusted to "follow the rules."
The remainder of this chapter summarizes the discussions of the focus groups. For most of the topics, similar responses were heard in Atlanta and Los Angeles; differences are noted when applicable. This chapter concludes with several discussion themes that we identified through the conversations.
Transportation Safety
Overall, the majority of participants noted that walking at night felt less safe than walking during the day. This was due to a variety of factors, with visibility and reckless driving being the most frequently cited responses. People felt less visible walking at night because of the lack of sunlight in addition to the irregular presence or brightness of streetlights. One respondent noted that they are often walking on a well-lit street and then they "turn the corner and it’s pitch dark," so they have little predictability of whether a walk at night will be fully lit by streetlights or not. Participants felt that this lack of lighting made them less visible to drivers and, as such, more susceptible to being involved in a crash. One participant from Atlanta added that when it is dark and raining, both their visibility and their feeling of safety decreases.
In addition to visibility, respondents believed that driver behaviors that might contribute to crashes with pedestrians, such as speeding, driving under the influence, being on their phone, etc., were more likely to happen at night. Many respondents said that they also expect these driving behaviors to happen during the day (although they believed driving under the influence was much more likely at night), but that the combination of these factors, darkness, and the related reduced visibility can make dramatic differences in pedestrian safety. When one participant said, "The freaks come out at night," others in the group enthusiastically nodded in agreement.
Participants also linked transportation safety to the amount of vehicle traffic on the roadways, although there were different perspectives on whether more traffic made it safer. Some participants said that having more vehicles on the road slows all vehicles down, which makes walking feel safer because speeding is reduced. Others said that fewer vehicles mean less need to be aware of drivers, which makes them feel safer while walking. This discrepancy also differed by neighborhood - one participant who lived in a more residential neighborhood (and also worked from home) said that traffic was often heavier at night near her home. However, most participants stated that there were more vehicles traveling on streets near them during the day.
Personal Safety
Safety from transportation-related crashes is only one component of the feeling of safety for pedestrians. Participants, especially women, and, even more so, women of color, noted how they felt less safe as a pedestrian at night because of the risk of crime or assault. One woman pointed out how her feeling of safety increases the more people are out walking but when a specific walk goes from a busier street to a street where she is the only person walking, her anxiety increases. Another woman mentioned how she, brings her dog, if possible, when she needs to walk at night – not necessarily because the dog would actually protect her, but because it signalizes to others that she would not be an easy target.
One woman of color also talked about how she specifically does not jog at night (thinking that there is a higher chance of injury while jogging than while walking) and does not go too far from her home or destination because she is not confident that somebody would see or help her at night (she self-described as having a "very dark" complexion). A few women also said that they often bring pepper spray with them on nighttime walks. Nearly all of the men said that they felt nearly as safe during the night as during the day with respect to personal safety.
Overall, the risks of personal safety seemed to impact people’s decisions regarding where and if to walk much more than transportation safety factors, especially for women.
Crossing the Street at Night
Participants were asked about their behaviors crossing the street at night and what factors affected their decisions regarding how or where to cross a street. Most participants said that they use the same general process to cross the street during the day and night, often looking for traffic in both directions and crossing when there was a gap in vehicle traffic. One participant said they look for a "larger gap in traffic" when crossing at night; other participants said that they automatically made assumptions about people driving at night. For example, one participant said she assumed all drivers were "on their phone, driving faster, and had a glass of wine" at night.
Because of these assumptions, participants said they behave as if drivers do not see them at all at night. Usually, people let the driver pass first, even if they have the right-of-way as the pedestrian. One participant noted how they cross more cautiously if they are in a location with businesses that might result in driving under the influence, such as liquor stores, bars, or clubs, and that they try to avoid crossing near moving vehicles. Other participants said they often try to cross at signals or crosswalks in these "risky" areas to protect themselves from being legally "at fault" if a crash were to happen.
Impact of Signals on Crossing Behaviors
Most participants said they were as likely to use a signal or other crossing infrastructure (e.g., crosswalk, RRFB, etc.) at night as during the day. There was a general lack of trust that drivers would obey signals (especially those specifically for pedestrians, like RRFBs), so participants did not believe there was a real safety benefit in using pedestrian-specific crossing infrastructure. Instead, participants said they mostly used crossing infrastructure – and were willing to walk slightly out of their way to access it – only when they would not otherwise see a gap in vehicular traffic flow. Otherwise, participants were primarily interested in using the shortest route possible to get to their destination.
One participant mentioned that she was much more likely to use a signal or other crossing infrastructure with her children to "set a good example," but she was more focused on finding the most direct route when they were not with her. Another participant who emphasized that she nearly always used marked crossings said that she used a wheelchair so was forced to use these locations because of curb cuts. That said, she said that she still often felt "invisible" at signals because of a lack of lighting or the placement of poles, bushes, or other items that might block a driver’s view of her. She noted that she does not "assume anyone sees me unless I make actual eye contact. I am of shorter stature; some cars are at my height or much higher."
The focus groups also covered pedestrian hybrid beacons (PHBs), which require drivers to stop. In Los Angeles, there was great dissatisfaction with PHBs and driver compliance, with many participants citing past experiences of crossing at one and having a driver either not stop or swerve around a stopped car. In addition, it seems that some PHBs in Los Angeles either did not work when they were first installed or worked erratically, further degrading the experience for all users. Lastly, one participant mentioned that many PHBs are for crossing four-lane streets but because of her walking speed, she feels unsafe being out
in the street so long with a type of signal that doesn’t feel truly "protected.” She also said that pedestrian countdowns at full signals are generally too fast for her typical crossing speed, which makes crossing a wide road uncomfortable and stressful.
One participant in Los Angeles was quick to say that the "pedestrian scramble" was her preferred crossing location, although there are not many of them throughout the city. She appreciated that she could feel confident that no vehicles would try to go through the intersection at these locations and was especially grateful that turning is prohibited during the pedestrian phase.
Overall, while participants did not totally trust drivers’ compliance with any type of signal, they preferred a traditional traffic signal for crossing. Participants repeatedly said that "everybody knows what to do" at traffic signals and that red/green lights are clear signals for behavior. There were still safety issues noted at these locations, e.g., people running red lights, turning in front of pedestrians, etc., but there was a belief that people knew what to do and were most likely to behave correctly at a traffic signal compared to other types of crossing infrastructure.
Visibility
Visibility from the Pedestrian’s Perspective
Streetlights were frequently mentioned throughout the discussions, regardless of the question. Participants’ feeling of safety related to transportation and personal safety in the dark was closely tied to streetlights and how well they illuminated the streets and, in turn, them. Generally, people said that they were more cautious in areas with less street lighting, but that it did not impact their actual behavior much.
When asked about whether they purposefully wore light-colored or reflective gear to be more visible to drivers, many participants expressed that they knew it would be safer, but that it was not practical to expect them to wear reflective gear while walking with a friend to dinner, coming home from work, etc. Of the participants who occasionally wore reflective or brightly colored gear (no participant said they always wore it), most did so while out on recreational walks for exercise or while walking dogs. In fact, many cited that their dogs had and wore more reflective and lighted gear than they did. Others said that they have reflective clothes on or lights when biking, but rarely, if ever, use these accessories when walking.
One participant noted that they sometimes use a flashlight when walking at night and a few others said that they often use their phone’s light as a flashlight or as a "signal" to drivers when they are preparing to cross a street. One participant said he regularly wore something - a white hat - for visibility at night. He identified himself as "dark skinned" and said that most of his clothes were dark colored, so he depended on the hat for visibility. Yet even those who wear or bring items to enhance visibility while they walk still assume that drivers will not see or pay attention to them, so they act accordingly.
Visibility from the Driver’s Perspective
The project team also asked participants about visibility from the perspective of a person driving and what they might "look for more" when driving at night. Many participants said that, overall, it is harder to see at night; one participant said she actively avoided driving at night due to concerns about her night vision. Three other participants said that they had recently gotten glasses for night driving for the same reason.
Participants discussed that while they make efforts to look for pedestrians when driving at night, they often have other priorities for their focus. Participants in both Atlanta and Los Angeles mentioned the need to look for potholes, which are harder to see at night, to avoid vehicle damage. Others mentioned focusing on lane lines and markings at night to ensure that they are driving in the right place on the roadway. Finally, a few participants who drove smaller vehicles mentioned that everything can be challenging to see in the
dark if a larger vehicle is approaching, because the larger vehicle’s headlights shine directly into their line of vision. In response, one participant mentioned that he recently bought a larger vehicle to "shield him from oncoming headlights."
Participants in Los Angeles also mentioned a few visibility issues that were not discussed in Atlanta. The first was the maintenance of streetlights - often the streetlights were present, but non-functional – either the bulb was out or the copper wiring had been stolen. Additionally, the light from functioning streetlights is often blocked by unmaintained trees. One participant said that when she called the city to request tree trimming to increase the streetlight’s effectiveness, she was told that she could trim the tree but that she would need a permit; ultimately, she did not trim the tree. Lastly, a few of the Los Angeles participants mentioned homeless encampments alongside streets or on sidewalks, which are both challenging to see and can block other items (signals, sidewalks, etc.) needed for visibility.
Overall, though, the presence or absence of working streetlights was the most common theme when talking about visibility for people walking or driving. Streetlights increase the visibility of and for people walking, as well as the visibility of other roadway elements - lane markings, potholes, etc. - that people look for while driving at night.
Driving in Pedestrian-Heavy Areas
Participants were quick to name areas in their communities where they expect pedestrians, for example, schools (especially around Friday night football games in Atlanta), areas with restaurants or bars, college campuses, and transit stops. Participants said that when they drive through these areas in the dark and predict that pedestrians will be present, they try to be more cautious and aware, as well as to slow down. Participants also discussed assumptions of pedestrian behavior in these areas. Around schools (especially college campuses), participants assumed everyone would be listening to headphones while walking. Around bars or clubs and after large sporting events on college campuses, participants assumed that pedestrians would be drunk and may behave erratically. These assumptions increase the caution that drivers use while driving through these respective areas.
One participant mentioned (and others agreed) that in areas with high levels of pedestrian traffic or when pedestrians were in a group (e.g., after a release from a show), they did not expect pedestrians to necessarily follow traffic signals or cross at marked crossings because of the "group safety" mentality – i.e., an assumption that a person would not drive toward or threaten a group of pedestrians as much as they might a solo person walking. Because of this, a few other participants said they actively avoided driving in areas, if possible, during times when they expected a lot of pedestrians to be present so that they would not have to worry about crossing behaviors and would not be forced to slow down. One participant said that she knew of an "alley network" around her neighborhood near the University of Southern California that she routinely used to avoid pedestrian traffic.
Distracted Driving
Nearly all of the focus group participants said they drove with their phone in the vehicle; often, their vehicle also had a display screen for music, maps, and general vehicle functions. The light from the screens on the phone or vehicle may impact one’s ability to see at night, but none of the participants believed that their ability was affected.
However, participants did describe being distracted by interactions with the screen(s), including texting in the car, changing music, or entering a new destination into the map, and they agreed that these interactions impacted their ability to see and focus on the roadway much more than the light associated with
them. One participant mentioned that he had a dashboard holder for his phone for directions and that the phone often fell off of it, leading to a major distraction of trying to find the phone on the floor of his vehicle while driving.
Speed Limit Reductions
Participants were told that decreased vehicle speeds are associated with fewer and less severe traffic crashes between drivers and pedestrians, and then asked if they would drive more slowly if speed limits were reduced to improve safety for pedestrians. Overwhelmingly, participants said that speed limits have little to do with how fast they actually drive and that more would have to happen in tandem with the speed limit reduction to have any impact. Many participants said that they usually drive 5-10 mph over the speed limit. One participant said that he now views the speed limit as the actual "limit" and usually drives under the speed limit. He also said that his "19-year-old self" sped frequently; he has started driving more slowly as he has aged and better understands the safety implications of speed.
When asked what would make participants drive more slowly, the most frequent answer centered around roadway design. One participant in Atlanta mentioned that her street layout was recently modified to allow parking on both sides of her street, and she now drives slower because she feels "squished" while driving down her street. In Los Angeles, participants discussed how the City has installed "small bumps" in the road, flexible posts creating chicane patterns, and mini-traffic circles throughout neighborhoods, measures which participants said have slowed them down. They also mentioned that Los Angeles has a culture of street racing and that streets with these sorts of countermeasures have become less attractive for racing.
Two participants from the Atlanta groups specifically mentioned that they believe they are highly qualified drivers at higher speeds – one was a retired truck driver and the other was a firefighter. They talked about how their on-the-job training around driving techniques has given them extra confidence in their skills as drivers and how that sometimes makes them feel more comfortable driving vehicles at higher speeds. The retired truck driver said, "I am confident in driving large vehicles at speed. I know how to drive well." He said his skill set often made him drive at whatever speed he thought was reasonable for the situation, which may (or may not) be the actual speed limit. He said a school zone near him is the one place he always makes sure to drive the speed limit because he received two speeding tickets in one day in the area from speed cameras that he was not aware of.
Respondents’ Suggested Safety Improvements
At the end of the conversation, participants were asked what they would do to make their city’s streets safer. Their ideas fell into the following categories: visibility, modal separation, sidewalks, and speed-reducing infrastructure.
Visibility
In the more pedestrian-focused discussions, participants mentioned various strategies to increase visibility, including increasing the number of streetlights and ensuring they were maintained. Multiple participants also talked about needing to remove trees or shrubs that may limit visibility along streets - both for horizontal reasons (i.e., seeing around a corner) and vertical reasons (i.e., allowing streetlight light to reach the sidewalk). Another participant emphasized the importance of increased visibility at crossings, either through raised crossings or embedded crosswalk lighting.
Modal Separation
Many participants emphasized the desire to increase the separation between people walking and driving with physical barriers. One participant mentioned appreciating specific "pedestrian lanes" and stairwells to pedestrian crossings he had experienced while traveling in Asia. He also said that this method "may be less convenient but totally safe," so the walking journey might be longer than without that infrastructure. Another participant suggested a scenario where bollards would pop out of the street around crosswalks while somebody was crossing to ensure that a vehicle could not cross their path.
Sidewalks
Participants also mentioned the desire to increase both the availability and continuity of sidewalks. Multiple participants, mostly in Atlanta, described seeing families walking in the grass along busy roads because no sidewalks were present. In addition, a few participants mentioned that large streets with sidewalks only on one side might increase the need for people to cross at locations without formal crossing infrastructure to get to their destinations, which is more dangerous at night. Participants also emphasized that the availability of sidewalks needed to be complemented by the quality of sidewalks. For example, tree roots often lead to uneven or cracked sidewalks, and trash or debris can make sidewalks hazardous, especially in the dark.
Speed-Reducing Infrastructure
Participants were quick to suggest ideas to slow drivers and make streets safer for pedestrians. Speed bumps were the most frequently cited, followed by roundabouts and "road diet" techniques such as lane reductions, lane narrowing, and adding infrastructure to the existing right-of-way (bike lanes, parking, medians, etc.). Participants also mentioned increased speed enforcement (potentially using cameras to limit staffing needs) and digital feedback signs to alert people of their driving speeds. Lastly, one participant mentioned the idea of a "nighttime speed limit," especially in areas with high pedestrian traffic.
Social Change
Finally, many participants referenced that our cities and streets are "built for drivers," often leaving people walking feeling like they are intruding and/or do not belong on or near roadways, especially at night. The participants also discussed that this mentality would remain as long as driving is the primary mode of transportation and streets remain designed as they are. Participants believed that a broader political and societal shift that values pedestrians more, e.g., by decreasing the amount of space and access given to vehicles and increasing the amount of pedestrian and transit infrastructure, is needed to truly see safety improvements for pedestrians walking at night.
Conclusion
The focus groups conducted for this study revealed consistent findings between groups and locations. Though the sample size was small, the findings help to inform our understanding of a shared pedestrian experience in darkness. Substantively, the discussions revealed important insights into factors that affect pedestrian and driver behavior at night and pedestrians’ and drivers’ desires for increased safety and predictability. Many of these findings directly relate to design guidance (e.g., that pedestrians do not trust and therefore do not use certain countermeasures and that drivers routinely drive 5-10 mph over the posted speed limit) and provide important insights and considerations for design guidance that aims to fill gaps and specifically address pedestrian safety at night. Many of the focus groups’ insights relate to the challenge of an overbuilt environment and how a Safe System Approach would fill in holes where infrastructure change will not be possible in the short-term. The next chapter triangulates the findings from the various
research methodologies presented in this report and discusses potential incorporation into and influence on the Phase III guidance.
2.5 Practitioner Interviews
Introduction
The research team conducted eight interviews with practitioners to help validate the findings of our analyses and begin to position the work to develop guidance. The practitioners were selected from among the participants of the Phase I survey conducted for this project. All survey participants were asked if they were interested in further involvement in this research. We filtered for those that responded affirmatively and also for those that had identified pedestrian safety in darkness as a problem. From this subset, we identified a group of practitioners based on geographic diversity and type of agency (state DOT, city, MPO) and invited them to interview. If the solicited practitioner could not participate in the interviews, we substituted another from the subset. Table 37 below lists the interview participants.
Table 37: Summary of Interview Participants by Position and Agency Type
| Position | Agency |
|---|---|
| Senior Transportation Engineer | Los Angeles Department of Transportation (LADOT) |
| Transportation Engineer | City of Ann Arbor, MI |
| Statewide Bicycle and Pedestrian Planner | Texas Department of Transportation (TxDOT) |
| City Transportation Engineer | City of Lakewood, CO |
| Traffic Engineering, Operations and Safety Manager | City of Lakewood, CO |
| Transportation Safety Engineer | Maricopa Association of Governments (MAG) |
| State Safety Engineer | Georgia Department of Transportation (GDOT) |
| Programs Unit Supervisor | New Mexico Department of Transportation (NMDOT) |
| Bicycle, Pedestrian and ADA Policy Engineer | Illinois Department of Transportation (IDOT) |
Methods
The research team developed a protocol to guide the interview process. It contained scripts for introducing the project, inviting participants, and conducting the interview, including the thirteen interview questions. The questions (available in Appendix E) focused on pedestrian crashes in darkness and asked about the agency’s safety analysis and findings, specific countermeasures used for pedestrian safety in dark conditions, decision-making process, and implementation. The interviewer spent 30 to 60 minutes with each participant and used notes from the conversation and the interview transcript to document the responses.
Each question was initially assigned a category, which served as the first round of coding. During the review of the responses, major themes were identified and the codes were refined. The remainder of this chapter will discuss these themes and summarize the insights obtained from the interviews.
Themes
The research team defined areas of interest to explore via interviews: analysis and findings on pedestrian crashes in darkness, application and effectiveness of countermeasures identified through our research, partners and collaboration, barriers to implementation, and desired support. The responses revealed themes aligned with the following areas:
Safety Analysis and Findings
The participants were selected because they identified pedestrian safety in darkness as a problem. It followed that they all reported higher crash rates and severity of crashes at night, with the exception of Ann Arbor, MI, which saw a fairly even split between day and night crashes. Ann Arbor attributed this to their systemic and aggressive approach to pedestrian safety interventions.
Most agencies identified the problem of pedestrian crashes in darkness through crash analysis, both systemic and hot spot. In most cases, however, the analysis of crashes in darkness was distinct from other safety analyses. For example, TxDOT noted that their systemic analysis focuses on roadway data but not conditions like lighting; they examine darkness as a factor separately. IDOT does not have a metric for pedestrian crashes in darkness, but they conduct distinct analyses to assess day and night crashes to inform project development. These examples reveal a practice of assessing the impact of dark conditions separately and outside of typical safety analysis procedures.
Most analyses relied on crash data to identify patterns and trends. Several participants noted data challenges from errors in the intake of data to limited types of information available. Participants noted the subjectivity of lighting conditions based on officer judgement and bias in recording who was at fault (e.g., crossing at unmarked crossings reported as a pedestrian error). NMDOT described their challenges with crash data from police reports, specifically the challenges of accurately determining the lighting condition, documenting the countermeasures proximate to the crash, maintaining consistency across reports and jurisdictions, and lacking post-crash follow-up. NMDOT led training on filling out crash reports to address these issues.
Datasets of pedestrian crashes are small and night crashes are even smaller, which makes it difficult to build predictive models. However, the smaller jurisdictions we interviewed used the challenge of a small sample size to their advantage and examined all pedestrian crash reports to collect detailed information on these crashes. Participants noted the potential for information contained in the crash report narrative to provide important insights, which could improve understanding of the circumstances surrounding a crash.
Interventions and Countermeasures
The participants were asked about two location types – arterials and midblock crossings – and the use of six safety countermeasures for the specific purpose of improving pedestrian safety in darkness. The countermeasures were:
- Upgraded or additional lighting
- Rectangular Rapid Flashing Beacons (RRFB)
- Pedestrian Hybrid Beacons (PHB)
- Speed management at night
- Crossing islands
- Upgraded pavement markings
Evaluation of interventions was not common, and few participants were able to speak to the effectiveness of countermeasures. In cases where there was an evaluation, it was not specific to dark conditions. The smaller jurisdictions we interviewed have been able to draw more direct links between crashes, interventions, and outcomes due in part to their detailed examination of crash reports.
Upgraded or Additional Lighting
Most agencies confirmed that arterials and midblock crossings were high-risk locations for pedestrians at night. Still, with the exception of lighting, most of the interventions discussed were not implemented specifically for darkness. Lighting was the primary intervention for safety in darkness discussed by participants, and it was mentioned in combination with PHBs, RRFBs, and other countermeasures like crosswalks, especially at midblock locations. For example, Ann Arbor has prioritized installation of positive contrast lighting. Lakewood and NMDOT have lighting programs to replace High Pressure Sodium (HPS) bulbs with Light Emitting Diode (LED) bulbs. (Research is inconclusive on the optimal lighting type for visibility. Shifts to LED lighting are often motivated by energy efficiency, costs, and environmental concerns. Additional research would help examine the safety effects of LED streetlights.) IDOT spoke to the challenge of addressing inconsistent lighting (HPS and LED) when local agencies maintain the lighting. Lakewood and LADOT, local agencies, also do not maintain lighting and noted similar challenges. Where agencies do not own or maintain lighting, they may support lighting programs through funding. GDOT has begun to fund lighting projects through safety funding.
MAG explained a specific challenge with tracking lighting: road safety assessments, a key safety analysis tool, may indicate that lighting is adequate although the experience on the road is not. This is an example of the difficulty in monitoring and reporting lighting conditions. Agencies also often mentioned a need for more information, instruction, and recommendations about lighting (e.g., optimal spacing, optimal type, luminosity, front lighting vs. silhouetting, and condition and quality metrics). Much of the lighting guidance focuses on vehicle lighting and may not address pedestrian needs or the needs of drivers to see pedestrians.
Rectangular Rapid Flashing Beacons (RRFB) and Pedestrian Hybrid Beacons (PHB)
All participants had installed or funded PHBs, RRFBs, or both, but their experiences varied in terms of challenges, successes, implementation approach, and installation experience. The participants shared the following practices and observations related to RRFB and PHB installation:
- Crash analysis is often used to identify locations for RRFBs and PHBs.
- Ann Arbor layers interventions combining RRFBs with advanced stop bars, STOP HERE FOR PED signs, oversized pavement markings, and pedestrian crossing islands. Ann Arbor also uses overhead RRFBs on wider roadways (5 lanes). LADOT and GDOT add pedestrian-scale lighting to RRFB devices (i.e., poles). TxDOT shared that many RRFBs in the state incorporate crossing islands, some with Z-crossings. Lakewood also includes crossing islands with their PHB designs.
- NMDOT has installed a few PHBs around the state and now uses the design for the first installation as a standard drawing. They have also included an initial round of installations in their pedestrian safety action plan.
- MAG previously supported a pilot program through their roadway safety program and is looking to revive it to fund more PHB and RRFBs.
- LADOT is not installing RRFBs at new crossings but uses them as an interim treatment for PHBs.
- Familiarity and consistency improve compliance and comfort with these countermeasures. TxDOT found that PHBs have a better compliance rate than RRFBs, in part because of driver confusion around the RRFB, especially in rural areas. In contrast, Ann Arbor has many RRFBs but observed confusion when they installed their first PHB; that PHB is now fully signalized.
- Although Ann Arbor has received positive feedback from the disability community for RRFBs, TxDOT has heard from their low vision community that they are difficult to navigate.
- The higher warrant for a PHB has been a barrier to use for TxDOT; they have tried to synchronize PHBs with the rest of the corridor to increase likelihood of approval.
- Lakewood will not install RRFBs on roadways with speeds over 43 MPH.
- Multiple participants use EDC guidance in their implementation of RRFBs and PHBs.
Speed Management at Night
Speed was mentioned by a number of participants as a major concern, specifically NMDOT, GDOT, and MAG. These Sunbelt agencies discussed challenges with speed increasing at night and speeding on more rural roadways. Some agencies were implementing (or planning) speed management efforts, although these efforts were not specifically for pedestrian or general roadway safety in darkness.
Other Countermeasures
There was less discussion about crossing islands and upgraded pavement markings, although most agencies stated that they employ these treatments. Similar to speed management countermeasures, crossing islands and pavement markings were not installed expressly for safety in dark conditions. Ann Arbor’s upgraded pavement markings include wider high-visibility crosswalks and advanced stop lines, which they install along with RRFBs. GDOT includes optical speed bars as a part of PHB installation. LADOT has used yield markings, reflective crosswalk markings, and double white no crossing striping at uncontrolled crossings. All three agencies (Ann Arbor, GDOT, and LADOT) also mentioned that their use of crossing islands is constrained by space and access needs. GDOT has experienced consistent damage to pedestrian push buttons on crossing islands, pointing to a safety risk; as a result, they are developing treatments to further protect the crossing islands.
Behavioral Aspects of Safety
Participants struggle to address behavioral aspects of pedestrian safety in darkness such as impairment and they expressed concerns that to continue to make progress, behavioral factors need to be addressed. Participants often work with partners (e.g., MPOs, local Vision Zero coalitions, and researchers at universities) on behavioral aspects. GDOT and TxDOT have employed educational efforts. Both mentioned conspicuity measures but noted that a focus on safer driving leads to safer pedestrians. MAG highlighted the challenges with victim blaming and shared their efforts to change the narrative their region. In Lakewood, approximately half of nighttime crashes involve impairment. They highlighted the relationship between substance abuse and land use factors (liquor stores and short stay motels) and are examining interventions such as special teams to address safety for people that are unhoused and conducting a blood draw of drivers involved in crashes to address this challenge. LADOT attempts to influence driver behavior through automated enforcement, but this was one of few driver-based behavioral interventions discussed among the participants.
Funding
Funding was generally mentioned as a concern, challenge, or barrier – particularly limited funding given the magnitude of need. Some participants spoke about systemically incorporating safety into all projects or, when they did not have safety set asides, working safety projects into other programs (e.g., sidewalk projects) or larger projects. Several participants mentioned using HSIP funding for capital improvements like RRFBs, although this funding source is reactive (i.e., crashes are used to allocate funds). TxDOT mentioned the value of data and analysis to push funding toward pedestrian safety in darkness and the need for funding that supports proactive interventions. HSIP funds will also not support ongoing maintenance of
treatments. One participant suggested that additional funding avenues may be identified by using the federal programming matrix to determine what funding is available and how it can be used.
The interviews also suggest that implementation of countermeasures tends to be opportunistic. Although several participants spoke to a data-driven or data-influenced prioritization process, most did not use a systematic approach to interventions, and none were prioritizing interventions based on safety at night.
Partners and Community Feedback
The interviews did not identify strong community engagement efforts or partnerships. Some engagement occurred through road safety audits and projects. GDOT noted that they conduct audits at night but do not involve the public in those efforts. Most state DOTs mentioned their partnerships with local agencies including MPOs and Vision Zero coordinators and committees. Local agencies mentioned partnerships with adjacent jurisdictions and regional entities as well as other local agencies such as police and public work departments. Some partnerships are facilitated through existing coordination channels. For example, GDOT has worked with EMS, police departments, transit agencies, trail organizations, and public health agencies through their Pedestrian and Bicycle Task Team meetings.
At each level of government, participants expressed challenges with working across scale. States and MPOs noted their implementation limitations and spoke about funding as an avenue to support local implementation. Cities noted state restrictions on desired interventions. At all levels, ownership of infrastructure was noted as a factor in the ability to implement interventions (e.g., lighting). Participants at each scale of government also expressed challenges with consistency across local jurisdictions. These challenges highlight how partnerships across agencies and states to implement interventions for pedestrian safety can be helpful.
Areas for Guidance and Additional Information
Participants shared the following areas where more guidance, information, and support would be helpful:
- Interventions for various contexts (i.e., rural/urban/suburban).
- Transit impacts and transit stop interventions.
- Available funding for pedestrian safety, especially in darkness.
- Inclusion of lighting condition in crash data/Accurate lighting condition in crash data.
- Addressing the perceived opposition of pedestrian and driver safety in design (e.g., lane width, median width, and crossing placement). Relatedly, addressing barriers to design and installation of pedestrian countermeasures presented in standard design guidance.
- Optimal lighting for pedestrian safety (e.g., spacing, location, type, luminosity, condition, and quality).
- Addressing behavioral components of safety without victim blaming.
- Analysis of effectiveness of countermeasures.
- Understanding how drivers observe the roadways and how pedestrians judge speeds and gaps.
- Understanding how aging impacts eyesight in low-light conditions.
- Avenues to influence post-crash care (e.g., following up on injury outcomes).
- Reliance of guidance on pedestrian volumes to warrant infrastructure although pedestrians will avoid uncomfortable facilities, which biases data and directs treatments away from locations that may be unsafe but infrequently traveled.
- Expanding the realm of potential safety interventions for elected officials and providing education that could influence policies and funding.
Validating Analysis Findings
The interview findings corroborate and inform the results of the research team’s analysis in the following ways:
- Despite challenges with data and crash analysis, agencies are identifying pedestrian safety in darkness as a critical problem and are directing attention and resources to addressing the problem.
- Agencies confirmed their high-risk locations (midblock crossings and arterials) and provided information on the types of countermeasures used at these locations. At the same time, the findings revealed that most of the treatments do not specifically aim to address pedestrian safety in darkness.
- Speed is a critical concern; however, specific nighttime speeding interventions have not been employed by the participants’ agencies.
- Impairment is a prevalent behavioral factor agencies are working to address. Related land uses such as liquor stores were identified as focus areas among some participants.
- Street lighting is the primary countermeasure used to improve safety in darkness, which aligns with the prevalence of street lighting found in the micro-level analysis and the feedback from driver simulator participants and focus groups.
- – The micro-level analysis found no relationship between street lighting and the likelihood of having been the site of a severe or fatal pedestrian crash at midblock crossings and a positive association between the same variables at intersections. In addition to land use and facility patterns that explain this phenomenon, participants discussed limitations of the lighting information in crash data, namely that lighting condition is often not adequately captured, which could impact the analysis.
- Agencies often combine countermeasures, especially at RRFBs and PHBs. The simulator results suggest that RRFBs combined with high-visibility markings improve attention toward pedestrians and crosswalks. RRFBs are particularly impactful in dark conditions, where they may be the only way to draw a driver’s attention to a crossing pedestrian.
- Few participants discussed high-visibility markings as countermeasures for safety in darkness, although most used them. The simulator results suggest these treatments improve pedestrian detection and yielding behavior.
- Crashes in darkness have been identified as a problem, but analysis cannot fully examine the problem given current data collection practices. Lighting condition could be a factor in systemic analysis, but this requires more consistent tracking of lighting condition (quality, not just a binary variable indicating presence) in crash reporting and better inventory of lighting infrastructure.
Design Guidance Takeaways
The interviews provided insights into how the research findings fit with practice and what practitioners are seeking in design guidance. While the guidance cannot completely address all practitioner needs (e.g., understanding eyesight limitations), it can provide research- and data-driven insights on proven countermeasures in line with the Safe System Approach, particularly for Safe Speeds and Safe Roads. Where appropriate for design guidance, we will also cover Safe Road Users, Safe Vehicles, and Post-Crash Care. Additionally, the guidance will heavily reference related guidance and support materials to help practitioners find the resources they need to support comprehensively address pedestrian safety in darkness.


