Improving Pedestrian Safety at Night (2025)
Chapter: Appendix A: Exposure Context for Pedestrian Fatalities
APPENDIX A.
Exposure Context for Pedestrian Fatalities
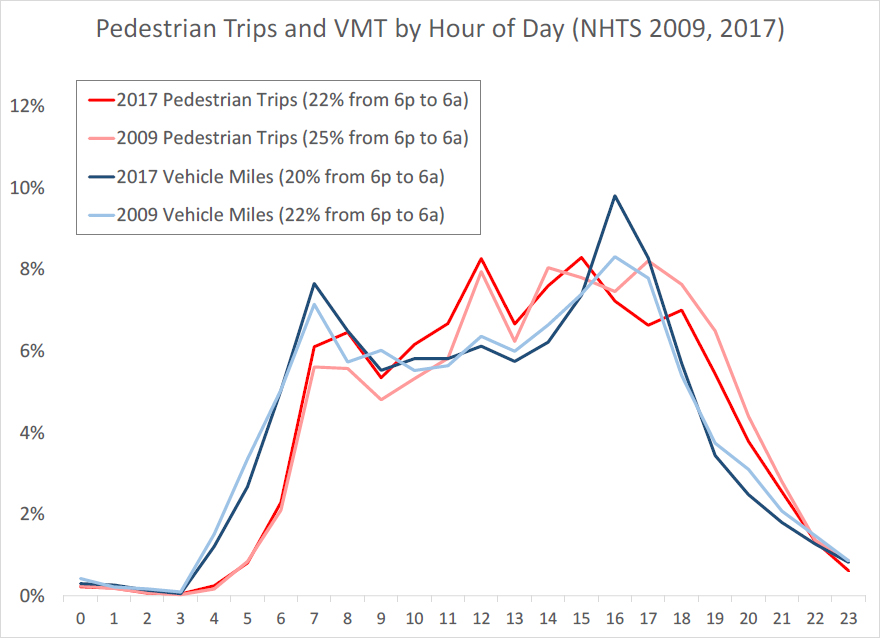
It is important to understand the underlying influence of exposure on pedestrian fatalities. Exposure can be represented in a variety of ways, but we gathered data on pedestrian and motor vehicle activity levels for this analysis. Currently, the best available national-level data on both pedestrian and motor vehicle travel at different times of day comes from the National Household Travel Survey (NHTS) (FHWA 2017). This survey provides the start times for trips made between pairs of origins and destinations by different types of transportation (it also includes trips made for exercise or recreational purposes). While these trips are not coded by daylight versus darkness, we analyzed the proportion of trips starting between 6:00 pm and 5:59 am as a rough approximation of nighttime trips.
While the NHTS is a large national survey, analyses of trips and miles traveled for specific modes by time of day are limited by a relatively small sample size. These data have even more variability when they are further divided by other travel or demographic characteristics. Despite these and other limitations, the NHTS can provide a high-level picture of pedestrian and vehicle activity levels by time of day. Figures A1-A3 summarize temporal patterns in pedestrian trips and vehicle miles traveled Note: We analyzed pedestrian trips rather than pedestrian miles traveled because the 2017 NHTS pedestrian miles traveled data includes some large outlier values. We think that the pedestrian trip data are more accurate.