Effects of Human-Caused Greenhouse Gas Emissions on U.S. Climate, Health, and Welfare (2025)
Chapter: 3 Observed Climate Changes from Human-Caused Greenhouse Gas Emissions
3
Observed Climate Changes from Human-Caused Greenhouse Gas Emissions
3.1 KEY MESSAGES
Improved observations confirm unequivocally that greenhouse gas emissions are warming Earth’s surface and changing Earth’s climate. Longer records, improved and more robust observational networks, and analytical and methodological advances have strengthened detection of observed changes and their attribution to elevated greenhouse gases (GHGs). EPA (2009a) provided evidence for a range of observed changes in Earth’s climate associated with elevated global concentrations of GHGs. Many of the global trends could also be observed in the United States.
Observations show continuing increases in hot extremes alongside declines in cold extremes, furthering the conclusion in EPA (2009a). Six decades of observations document a tripling of average annual heat-wave frequency since the 1960s. Heat metrics in many regions show heat-related changes. For example, occurrence of the hottest day, warmest night, warm spells, and other heat events have intensified in the southeast.
In the United States, regional shifts in annual precipitation and a higher number of extreme single-day precipitation events have been observed. The amount of land area experiencing greater than normal annual precipitation totals has increased since 1895, and the prevalence of extreme single-day precipitation events has risen substantially since the 1980s. Regionally, the Northeast has experienced about a 60% increase in the amount of precipitation falling on the heaviest 1% of days since 1958, with the Midwest up roughly 45% over similar periods.
Observations show continued warming of the Earth’s oceans. An increase in global sea surface temperature has been observed since 1900 and ocean heat content increases in the upper 2,000 meters are also evident since 1960 throughout the global oceans. Ocean warming has contributed to increases in rainfall intensity, rising sea levels due to thermal expansion, the destruction of coral reefs, declining ocean oxygen levels, and declines in ice sheets, glaciers, and ice caps in the polar regions.
Ocean pH has decreased, and along with ocean warming, poses risks to marine ecosystems and the benefits they provide. Ocean pH decreased from 8.2 in 1750 to 8.1 today, consistent with the finding in EPA (2009a), and represents about a 30% increase in the hydrogen ion concentration in ocean water (which equates to less alkaline and more acidic conditions). Changes in pH in U.S. offshore waters track with the global average trends, but changes in U.S. coastal waters vary due to local conditions. Decreasing ocean pH, along with warming, poses risks to species with shells and skeletons and coral reefs.
Global mean sea level has risen about 7 inches (approximately 18 centimeters) since 1900, and the rate of sea level rise is accelerating. Regional relative sea level rose on average by approximately 11 inches in the
last century along the continental United States, putting many coastal communities at risk of increased coastal flooding and vulnerability to coastal storms. Changes in average sea level have doubled the frequency of high tide flooding in the continental United States over the past few decades.
Evidence of increasing wildfire severity linked to climate change has grown since EPA (2009a). Changing climate conditions, including warmer springs, prolonged summer dry periods, and drier soils and fuel sources, have increased the likelihood for wildfire ignition and spread. The total area burned per annum by wildfires in the western United States has increased in recent decades, resulting in substantial increases in fine particulate matter and other air pollutants.
The following sections provide more detail on the observed changes of key Earth system components—temperature, precipitation and drought, oceans, cryosphere, and biosphere—since EPA (2009a), including attention to trends, extremes, and regional variation across the United States, as well as signals of human attribution to these observations.
3.2 TEMPERATURE
The Earth energy imbalance discussed in Chapter 2 leads to warming of the surface and lower atmosphere, which is clearly detected in temperature observations. Global mean surface temperatures have increased by 2.23°F (1.24°C; ranging1 2.00 to 2.43°F/1.11 to 1.35°C) for approximately the last decade (2015–2024) relative2 to average (Forster et al., 2025). This temperature increase is approximately 60% greater than the warming reported in EPA (2009a), reflecting the very rapid warming of the planet during the last two decades. The warming rate reached a value of 0.49°F (0.27°C; 0.36 to 0.72°F/0.2 to 0.4°C) per decade during 2015–2024, helping drive warming rates over the past 50 years and decadal average temperatures both to their highest values in at least the last 2,000 years (Forster et al., 2025; Gulev et al., 2021).
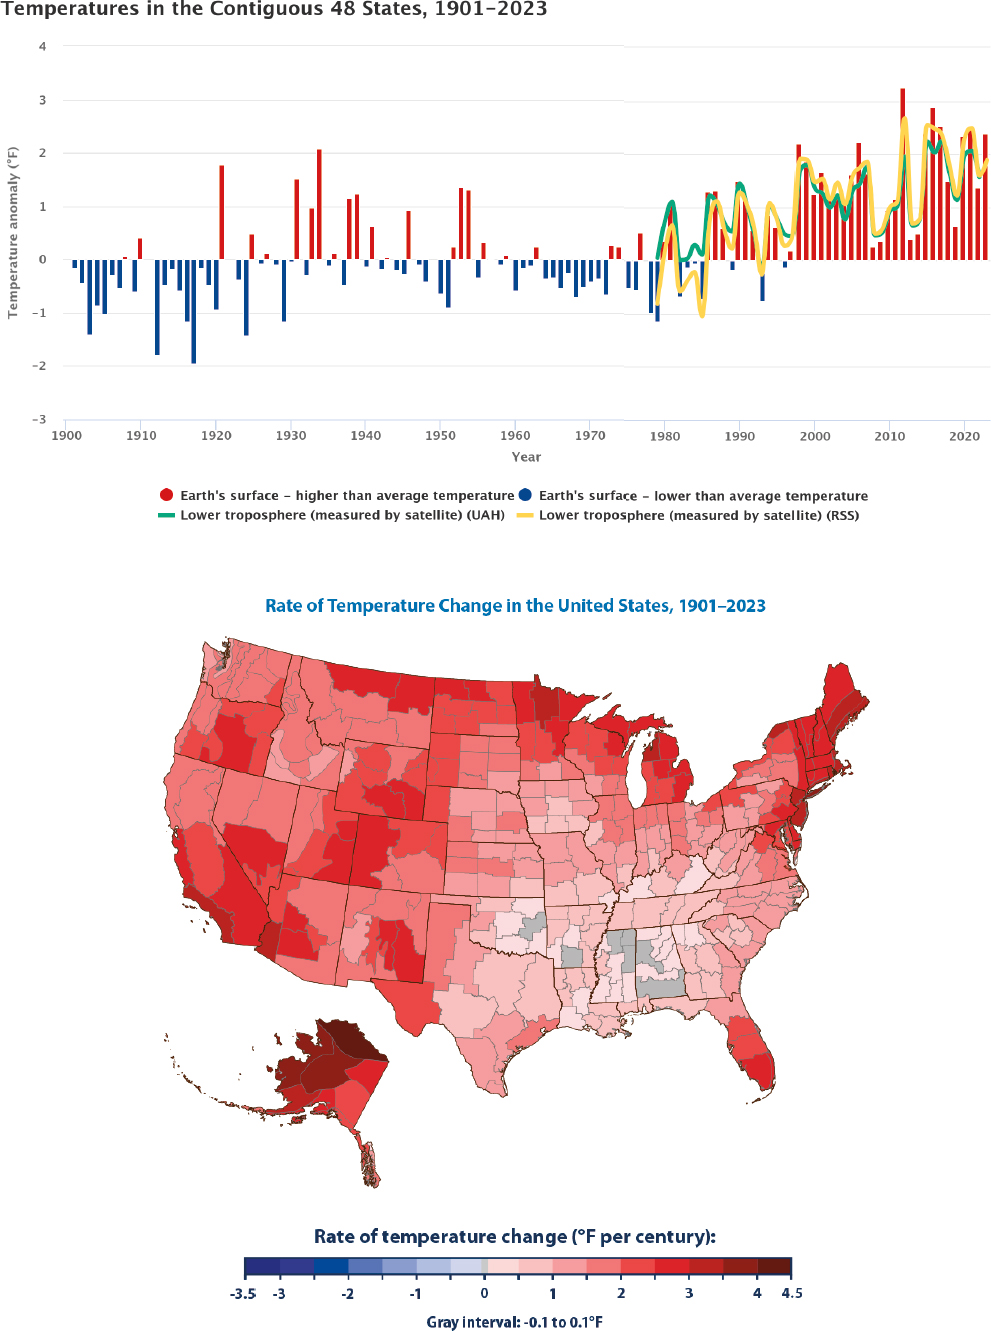
Consistent with global trends, temperatures in the United States have increased and at an increasing rate (Figure 3.1). Because the land warms more than the ocean, the U.S. annual mean has increased more than the global mean. Since 1970, annual mean temperatures in the contiguous United States have increased by 2.5°F (1.4°C) and by 4.2°F (2.3°C) in Alaska (Marvel et al., 2023) compared to the global mean of approximately 1.7°F (0.9°C). This is a marked increase from the 1.3°F (0.7°C) U.S. temperature increase reported in EPA (2009a) for the 20th century, continuing the trend of the rate of warming increasing, in addition to the actual temperature increase, over the past (now more than four) decades.
Warming has been observed nationwide but is the most pronounced in Alaska, the West, and the Northeast. The Southeast has historically experienced slower warming (called a “warming hole,” where long-term temperature trends are negative or non-significant compared to the rest of the country), but this trend has diminished in recent decades. The United States has also experienced longer summers and shorter winters, with winters warming nearly twice as fast as summer in many northern states. Night temperatures have also increased consistently in both summer and winter, which affects plants and ecosystems (see Chapter 6). Temperature trends are observed and supported by instrumental surface networks and homogenized datasets; homogenization3 has improved and high-resolution reanalyses have sharpened the detection of regional trends since 2009 (Eyring et al., 2021; Marvel et al., 2023).
Extreme Temperatures
Observations show continuing increases in hot extremes alongside declines in cold extremes since 2009, furthering the conclusion in EPA (2009a) that “widespread changes in extreme temperatures have been observed
___________________
1Temperature ranges provided in parentheses represent the “very likely” or 90% confidence interval.
2Many estimates in Chapter 2 used 1750 as a baseline; however, quantities provided in this chapter vary in baseline depending on what characteristic is being measured and the start of long-term observational records for that characteristic. These baselines are provided as appropriate for different observations.
3Homogenized datasets adjust for non-climatic influences; for example, station moves or instrument changes, to ensure observed trends reflect real changes rather than artifacts of data collection methods.
SOURCE: EPA, 2025f.
in the last 50 years across all world regions, including the United States” (p. ES-3). Multiple independent datasets concur that the frequency and intensity of record heat—hot days, hot nights, heat waves—have risen while record cold—cold days, cold nights, and frost—have diminished over most land areas across the globe, including the United States (Fischer et al., 2025). These findings have been documented and reconfirmed in national and international climate assessments since 2009 (Eyring et al., 2021; USGCRP, 2023), as well as by records compiled by EPA’s Climate Change Indicators (EPA, 2025f) for the United States.
EPA’s Heat Waves Indicator (EPA, 2025c), based on six decades of observations, documents a tripling of average annual heat-wave frequency since the 1960s, with earlier starts and later ends to the season; regional studies reinforce these patterns. Weather events are classified as “extreme” relative to local historical baselines, so regional variability in these observations and events is expected. The frequency of extreme heat events is significantly increasing in the western United States, while seasonally relative extreme heat events are increasing in parts of the South (Ibebuchi et al., 2025). The Southeast experienced intensification of extremes—annual occurrence of the hottest day, the warmest night, warm days, warm nights, summer days, tropical nights, and warm spells—over 1978–2017 (Fall et al., 2021). Florida’s observed heat-stress metrics (heat index, wet-bulb globe temperature) have risen markedly since 1950 (McAllister et al., 2022), while relative extreme cold events are decreasing the most in the Florida peninsula, as well as in southern California and Nevada (Ibebuchi et al., 2025). Analyses of cold air outbreaks and cold waves find broad declines in frequency, duration, and severity across the northern mid-latitudes, including in the United States (Smith and Sheridan, 2020; van Oldenborgh et al., 2019).
Extreme weather events most closely related to temperature have been found to be more frequent and intense due to human-caused climate change using extreme event attribution science (NASEM, 2016). Non-climate factors can also drive extreme temperature events and have done so in the past in the United States. The Dust Bowl is an example of a natural La Niña drought event and extreme temperature event that was exacerbated by human-caused land-use change and poor agricultural practices. These temperature extremes held records in the Great Plains that have only been surpassed in recent years (Meehl et al., 2022). Models using only sea-surface temperatures during the 1930s show that the natural drought would have occurred farther south without human-induced land-use change (Cook et al., 2009). More recent modeling studies show that the extreme drought of the Dust Bowl caused anomalous temperatures of +7.9°F (4.4°C) in the Great Plains and +0.56°F (0.31°C) over the North American landmass (Meehl et al., 2022). Meehl et al. (2022) shows that regional practices like extreme land-use misuse could have temperature extreme implications not only regionally but for the entire United States.
3.3 PRECIPITATION AND HYDROLOGICAL SYSTEMS
A warmer atmosphere increases the maximum amount of water vapor a volume of air can hold at a specific temperature, which can increase the potential for heavy precipitation even where annual total precipitation changes little (Eyring et al., 2021; USGCRP, 2023). Warming also increases evaporative demand (vapor pressure deficit) and shifts snow-to-rain ratios and snowmelt timing, changing soil moisture and streamflow seasonality. The balance of precipitation versus evapotranspiration4 determines drought type and severity.
Atmospheric Moisture
Observations indicate a global increase in surface specific humidity5 from 1973 to 2019 (Eyring et al., 2021; Gulev et al., 2021). This trend is also apparent for the United States (Marvel et al., 2023) and is consistent with the increased water holding capacity of a warmer atmosphere. Although the specific humidity is increasing, relative humidity is expected to remain approximately constant as the atmosphere warms. The increased specific humidity means the atmospheric water vapor content is also increasing systematically at a rate of approximately 7% for
___________________
4Evapotranspiration is the sum of all processes by which water moves from the land surface to the atmosphere via evaporation (e.g., into the atmosphere from the soil surface or bodies of water on land) and transpiration (water movement from the soil to the atmosphere via plants).
5Specific humidity measures the actual mass of water vapor in a unit mass of air. Relative humidity expresses how close the air is to saturation, as a percentage of the maximum water vapor it can hold at a given temperature; it therefore varies with temperature, since warmer air can hold more moisture than cooler air.
each degree Celsius of warming experienced. This increase is both well understood and well documented from global observations (e.g., Santer et al., 2007).
Water vapor accounts for half of the planet’s greenhouse effect and amplifies the effect of GHG-induced warming. Increased water vapor has a number of important consequences for the hydrological cycle, in addition to amplifying GHG-induced warming. Storms are producing more intense rains in part due to this increased water vapor (see following sections) (Marvel et al., 2023).
Patterns of Precipitation
Over the oceans, multi-decadal salinity analyses show that the spatial patterns of precipitation have not appreciably changed (e.g., Durack, 2015; Durack and Wijffels, 2010). However, the amplitudes of the patterns of precipitation and evaporation over oceans have increased, consistent with the “wet-get-wetter, dry-get-drier” paradigm6 of change. This is because as temperatures increase, the air holds more water vapor (up to 7% per degree Celsius of warming), a property known as the Clausius-Clapeyron relation. Therefore, warmer air increases evaporation over the ocean, holds more water, and increases heavy rainfall. The implication is that the global hydrological cycle is intensifying, at least over the global oceans.
Land-based hydrologic trends are complex and not as straightforward as those over the oceans. Between 1980 and 2015, water and climate data for the contiguous United States (from National Climate Assessment Land Data Assimilation System reanalysis), indicate coherent shifts in precipitation across the country (Jasinski et al., 2019). These shifts reinforce trends noted in previous studies, with mean precipitation increases of 0.12 to 0.35 inch (3 to 9 millimeters) per year in the upper Great Plains and Northeast and decreases from −0.04 to −0.35 inch (−1 to −9 millimeters) per year in the West and South. Patterns of change in terrestrial water storage, revealed by NASA’s GRACE and GRACE-FO satellites, mirror these precipitation trends. The GRACE data have shown that the areas experiencing drying globally have increased by twice the size of California annually, creating “mega-drying” regions across the Northern Hemisphere. While most of the world’s dry regions are becoming drier and wet regions wetter, the water storage data show that the rate of drying now exceeds the rate of wetting (Chandanpurkar et al., 2025). The observations of precipitation and water storage are consistent with the findings from EPA (2009a) that “changes are occurring in the amount, intensity, frequency and type of precipitation” (p. ES-2).
Extreme Precipitation
Long records of surface precipitation increasingly reveal a systematic shift in precipitation intensity. Fowler et al. (2021) offer an extensive review of surface rain gauge data analysis and present evidence from these observations supported with theoretical and modelling studies for the intensification of (1–3 hour) rainfall extremes. Both short-duration and long-duration (>1 day) rainfall extremes are intensifying with warming at a rate consistent with the increase in atmospheric moisture (~7% per degree Celsius), a finding supported by multiple decades of satellite observations. In some regions, short-duration extreme rainfall events exhibit much larger intensification than expected from moisture increases alone. These stronger local increases are related to feedbacks in convective clouds, though the strength and mechanisms of these cloud–radiation feedbacks remain uncertain (e.g., Stephens et al., 2018). Intensification of short-duration extremes confirmed in existing data records has likely increased the occurrence of flash flooding at local scales. EPA (2009a) projected the potential for increases in regional heavy downpours and occurrence of flooding that have now been confirmed by the observational record.
In the United States, the amount of land area experiencing greater than normal annual precipitation totals has increased since 1895, and the prevalence of extreme single-day precipitation events has risen substantially since the 1980s (Figure 3.2). These precipitation observations vary both year-to-year and across different regions of the United States (EPA, 2025d). Regionally, the Northeast has experienced about a 60% increase in the amount of
___________________
6The concept that dry regions dry out further, whereas wet regions become wetter as the climate warms has been proposed as a simplified summary of theoretically expected (e.g., Chou et al., 2009; Held and Soden, 2006) as well as observed changes over ocean (Durack et al., 2012), whereas land responses are more complicated (Greve et al., 2014).
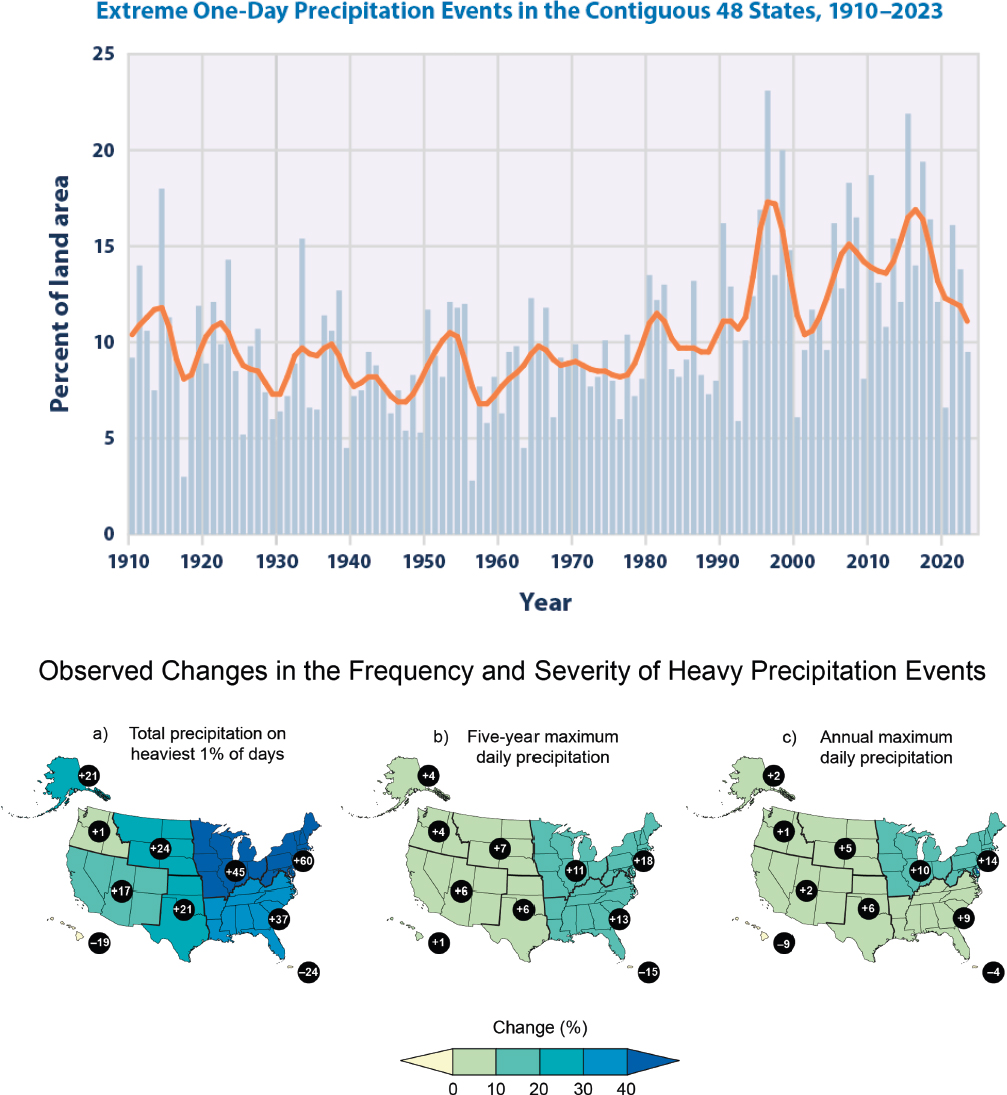
SOURCE: (Top) EPA, 2025d. (Bottom) Marvel et al., 2023.
precipitation falling on the heaviest 1% of days since 1958 (Whitehead et al., 2023), with the Midwest up roughly 45% over similar periods (USGCRP, 2023). Along the West Coast, landfalling atmospheric rivers7 have warmed in recent decades (Gonzales et al., 2019), favoring more rain over snow; multiple reanalysis-based studies detect strengthening characteristics of atmospheric rivers (Henny and Kim, 2025). Detection-and-attribution analyses using observed records also identify a human contribution to intensifying 1- and 5-day precipitation extremes (Sun et al., 2021).
Storms
Warmer water temperatures are expected to strengthen tropical cyclones globally (USGCRP, 2023). Although hurricane landfalls in the United States have not increased, hurricane activity in the North Atlantic has increased since the early 1970s (USGCRP, 2023). A trend has emerged of more rapid intensification of hurricanes since the early 1980s, as well as a slowdown in the rate of decay of hurricanes since the 1960s (Kossin et al., 2020; USGCRP, 2023).
Along the North American coast, observations have shown storms slowing down or stalling, bringing more heavy rainfall, wind damage, storm surge, and coastal flooding (Kossin, 2018; USGCRP, 2023). The destructive power of individual tropical cyclones through flooding is amplified by rising sea level, which very likely has a substantial contribution at the global scale from anthropogenic climate change (Knutson et al., 2021). The amount of tropical cyclone-related rainfall that any given local area will receive increases as the rain rates at the center of the cyclones increase.
Drought
Drought conditions have also varied over space and time in the United States. Meteorological droughts (i.e., periods of low precipitation) have increased in the southwestern United States and parts of the southeastern United States from 1915 to 2011. A mixture of positive and negative trends is observed elsewhere in the contiguous United States (Apurv and Cai, 2021). Analyses that incorporate evapotranspiration (i.e., evaporation from soils and open water plus plant transpiration) in addition to temperature to consider soil-moisture drought show a similar pattern with increasing trends in dry area coverage in the southwest and slight decreasing trends in the rest of the contiguous United States (Su et al., 2021).
Drought can also be characterized as a sustained imbalance between precipitation and evaporation. Rising temperatures associated with climate change have accelerated the hydrologic cycle by increasing evapotranspiration. While greater evapotranspiration places more moisture in the atmosphere and can enhance precipitation, it also promotes drying over land and reduces soil moisture in many areas. This pattern is consistent with observations in certain regions: an extended period of drought conditions in the southwestern United States has been observed from 2012 to 2023 (EPA, 2025j); drought in this region was also noted in EPA (2009a) from 1999 to 2008.
Since 2009, evidence of these changes has improved through expanded soil-moisture and snow remote sensing, improved reanalyses for drought process diagnostics, and clearer attribution of heat-driven aridity to anthropogenic warming in the western U.S. drought signal (USGCRP, 2023; Williams et al., 2022). Further, human-caused warming has changed the main driver of the soil moisture droughts over the western United States, from precipitation deficit to heat-driven high evaporative demand, since 2000 (Zhuang et al., 2024).
3.4 OCEAN HEAT AND CHEMISTRY
Ocean Heat Content
The evidence that the ocean has warmed as a result of excess GHGs has grown stronger since EPA (2009a). Because water has a much higher heat capacity than the atmosphere, the ocean is the main reservoir for heat in
___________________
7Atmospheric rivers are bands of condensed water vapor in the atmosphere that cause significant levels of precipitation.
the climate system. Ocean warming starts at the surface but is transferred to deeper layers by ocean circulation. An accurate estimate of ocean heat content is fundamental to understanding the evolving climate system and fundamental in the estimation of the Earth energy imbalance (Section 2.3). A robust increase in global sea surface temperature has been observed since 1900 (Garcia-Soto et al., 2021), and increases in summer upper-ocean stratification are apparent from 1970 to 2018 (Sallée et al., 2021). Increases in the heat content of the upper approximately 6,560 feet (2,000 meters) of the ocean are also evident since 1960 throughout the global oceans (Garcia-Soto et al., 2021), consistent with the Earth’s energy imbalance (see Figure 3.3).
The advent of the Argo float network in 2004 greatly improved the spatial and temporal coverage of in situ measurements of temperatures in the upper layer of the ocean, which previously had been measured by electronic instruments lowered from ships. Currently, more than 3,900 Argo floats provide about 140,000 temperature (and salinity) profiles per year from the sea surface to about 6,560 feet (2,000 meters) depth at places across the globe (NASEM, 2017b). The Deep Argo program, which began in 2014 and expanded in 2016, advanced sampling of temperatures down to about 19,685 feet (6,000 meters) depth and enabled estimation of ocean heat gain over the full water column.
Heat absorbed by surface ocean waters is transported laterally and vertically through the layers and basins of the ocean via mixing and currents. Regionally, subsurface ocean temperature can also vary substantially with climate patterns such as El Niño, the Pacific Decadal Oscillation, the North Atlantic Oscillation, and large variations in wind stress over the ocean. On a regional basis, closure of the heat budget requires observations of ocean heat content, air-sea heat exchange, heat transport by ocean currents, and mixing.
Ocean warming has contributed to increases in rainfall intensity, rising sea levels due to thermal expansion, the destruction of coral reefs, declining ocean oxygen levels, and declines in ice sheets, glaciers, and ice caps in
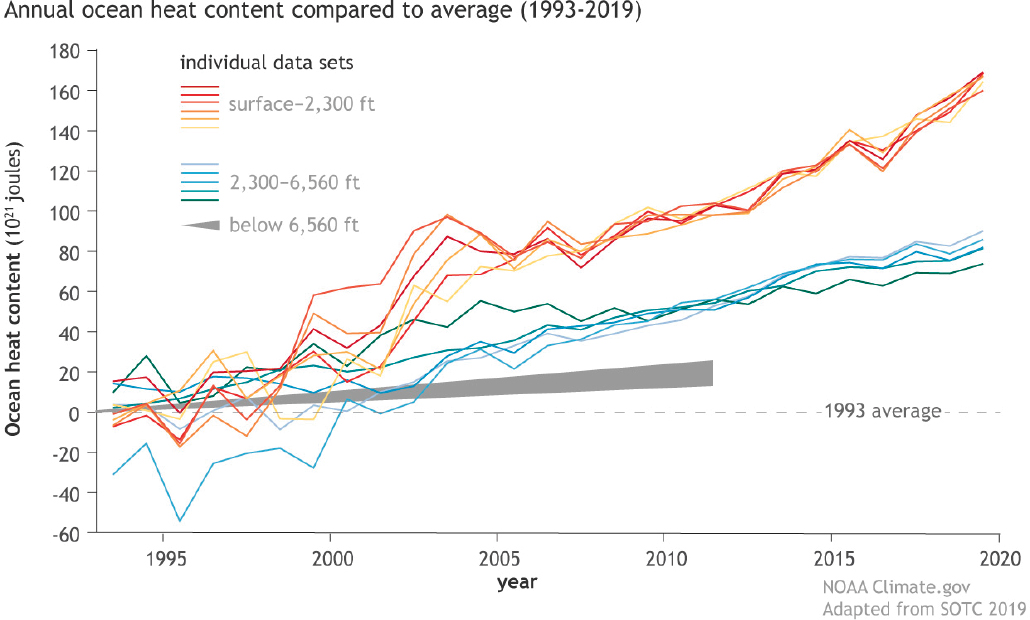
SOURCE: NOAA, 2025b.
the polar regions (Cheng et al., 2019; Hamlington et al., 2022). This warming is also one of many factors that has increased the number of low-oxygen dead zones in many places around the United States (USGCRP, 2023).
Marine Heat Waves
Marine heat waves are periods of anomalously high regional surface ocean temperatures. These events were not included in the evidence in EPA (2009a) but have become common in recent decades. These heat waves have considerable, detrimental impacts on marine ecosystems and the services that they provide (e.g., Frölicher and Laufkötter, 2018; Smale et al., 2019; Smith et al., 2024). In 2024, 91% of the global ocean was affected by at least one marine heat wave, while 26% experienced at least one cold spell (Blunden and Reagan, 2025). Laufkötter et al. (2020) show that the frequency of these events has increased more than 20-fold since preindustrial times, when it is estimated that they typically occurred with a frequency of once in hundreds to thousands of years. From 1982 to 2023, the annual cumulative intensity of marine heat waves increased across almost all waters in the U.S. exclusive economic zone, except for a nearshore region from Georgia to North Carolina (see Figure 3.4) (EPA, 2025e). The largest changes are present in Alaskan coasts and waters off the northeastern United States.
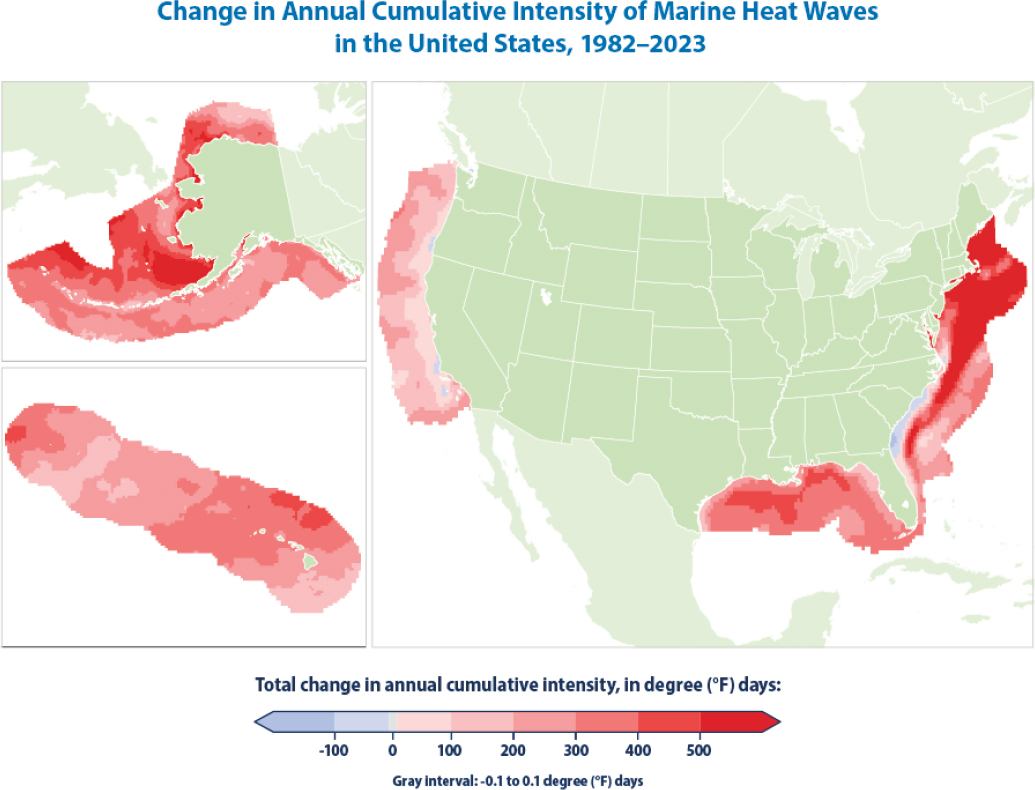
SOURCE: EPA, 2025e, with data from NOAA NCEI.
Ocean Chemistry
Continued observations of ocean chemistry since 2009 affirm the conclusions in EPA (2009a) about uptake of excess CO2 from the atmosphere. The ocean has taken up about 30% of the CO2 emitted to the atmosphere over the past century (Gruber et al., 2019). Uptake of CO2 in the ocean leads to a series of chemical reactions that lower the pH, increase concentrations of dissolved organic carbon, and increase the solubility of calcium carbonate. Calcium carbonate is an important component of the shells and skeletons of many marine organisms. EPA (2009a) noted that ocean pH had decreased from 8.2 in 1750 to 8.1 today, following a trend that has continued since 2009. Because the pH scale is logarithmic, a 0.1-unit decrease represents about a 30% increase in the hydrogen ion concentration in ocean water, which makes it less alkaline. The Intergovernmental Panel on Climate Change (IPCC) has assessed that it is virtually certain that human-caused CO2 emissions are the main driver of the current global decline in pH of the open ocean’s surface; a pH decline in the ocean interior over the past 2 to 3 decades has also been observed in all ocean basins (with high confidence) (IPCC, 2021). The decline in pH in U.S. offshore waters tracks with the global average trends, but changes in U.S. coastal waters vary due to upwelling conditions and nutrient and freshwater inputs that also lower the pH of ocean water (USGCRP, 2023).
Changes in ocean pH are monitored through in situ measurements of pH and partial pressure of CO2 (a measure of the quantity of CO2 dissolved in seawater). The number of moored and shipboard sensors for pH and CO2 have increased greatly over the past decade and now provide more accurate monitoring information than in 2009. The rise in atmospheric CO2 concentration concurrent with in situ measurements of pH and the partial pressure of CO2 in ocean water clearly illustrate a cause-and-effect relationship between these variables over the long-term. Ma, Gregor, and Gruber (2023) used in situ and satellite observations to examine the trend in ocean pH from 1982 to 2021, confirming that the declining pH across the global ocean is attributable to the increase in the partial pressure of CO2 from human-caused increases in atmospheric CO2. The IPCC estimates in the Special Report on the Ocean and Cryosphere in a Changing Climate (IPCC, 2019) that the rate of ocean surface pH decline is 0.017–0.027 pH units per decade across a range of time series that are longer than 15 years. Bates and Johnson (2020) found that seawater CO2-carbonate chemistry conditions today clearly exceed seasonal changes observed in the 1980s.
The study of ocean pH decline and its effects on marine organisms has expanded dramatically over the last two decades (Browman, 2016), and research demonstrates varied responses among various communities and species, with calcifying species (including corals) generally exhibiting more sensitivity to higher CO2 (Doney et al., 2020; Kroecker et al., 2013). The extent to which the effects of ocean pH decline on marine biota will impact human welfare is an area of active research. Some areas of focus include potential impacts on economics of commercial fisheries and tourism, cultural values, and role in coastal protection for corals (Doney et al., 2020). See Chapter 6 for further discussion of impacts.
3.5 CHANGES IN PHYSICAL AND BIOLOGICAL SYSTEMS
EPA (2009a) documented a number of changes in physical and biological systems, including in the cryosphere, hydrosphere, and biosphere. The report highlighted the finding from IPCC (2007) that “anthropogenic warming has had a discernible influence on many physical and biological systems” (p. 53), but also noted that other factors, such as land-use change or natural decade-scale climate variations (such as the Pacific Decadal Oscillation) were likely to play a role.
Since EPA (2009a), data records have lengthened, data coverage has improved for some variables (e.g., mountain glaciers), new data sources have become available (e.g., ICE-Sat2 and GRACE satellites), and improved methodologies have been devised for assessing change. The changes in physical and biological systems documented in 2009 have generally continued and in some cases become more clearly attributable to a human influence (IPCC, 2019, 2021).
Cryosphere
The trend in annual mean Arctic sea ice extent remains similar to that documented in EPA (2009a), with a loss per decade of ~500,000 square-kilometers (about 4.5% relative to the 1981–2010 average) for the period of 1979–2023 (Fetterer et al., 2025). Sea ice has decreased in all months relative to the historical average, with the largest reductions in September equaling about 12.2% per decade for 1979–2023 relative to 1981–2010. The melt season has also lengthened from 1979 to 2023, with both earlier melt onset and later freeze-up (EPA, 2025b). A pause in September sea ice loss has occurred in the last two decades. This pattern is consistent with internal climate variability (England et al., 2025) and was anticipated in work showing that decadal pauses in ice loss are possible when anthropogenic ice loss is counteracted by internal variability (Kay et al., 2011).
EPA (2009a) noted that for the 1979–2008 period, Antarctic sea ice exhibited no significant change. However, since that time, Antarctic sea ice has undergone a significant loss. A small but significant increase in ice extent occurred from 1979 to 2014. This was followed by a dramatic ice loss in austral spring of 2016. Ice extent has remained remarkably low during the last decade with losses comparable to the 46-year record of Arctic sea ice decline (Abram et al., 2025). This has led to the suggestion that a regime shift may have occurred in the Antarctic sea ice system (Hobbs et al., 2024; Purich and Doddridge, 2023).
The other cryospheric changes documented in EPA (2009a) have generally continued. For the 1961–2016 period, glacier mass has been lost globally (Zemp et al., 2019), with glaciers in Alaska losing 3,000 gigatons (equivalent to 0.31 inches, or 8 millimeters, of sea level rise) and in western Canada and the western United States losing 428 gigatons (equivalent to about 0.04 inches, or 1 millimeter, of sea level rise) of mass. Permafrost continues to warm and thaw, and lake ice cover has declined (IPCC, 2019; Vonk et al., 2015). Northern Hemisphere spring snow cover has continued to decline, with a loss since 1922 of approximately 0.3 million square-kilometers per decade (IPCC, 2021).
Sea Level
As discussed in the previous sections, Earth’s energy imbalance has led to warming of the surface, and 90% of the excess heat has been absorbed by the oceans. This has led to thermal expansion of the oceans which, together with land ice mass loss, contribute to sea level rise. Global mean sea level has risen about 7 inches (approximately 18 centimeters) since 1900, up from 6.7 inches reported in EPA (2009a).
Over the past three decades, satellites have provided continuous, accurate measurements of sea level on near global scales. EPA (2009a) reported the global average rate of sea level rise from 1993 to 2003 as measured by satellite altimetry to be about 0.12 inch (3.1 millimeters) per year; recent studies show the rate increased from about 0.08 inch (2.1 millimeters) per year in 1993 (the first year in previous averaged period) to about 0.18 inch (4.5 millimeters) per year in 2023 (Hamlington et al., 2024). This acceleration of the rate of sea level rise has been evident in both tide gauge and satellite altimetry records (Eyring et al., 2021; Sweet et al., 2022).
Regional relative sea level (see Figure 3.5) rose on average by approximately 11 inches (28 centimeters) in the last century along the continental United States, with about half of this amount (5–6 inches, about 13–15 centimeters) in the last 30 years (USGCRP, 2023). The greatest rise in regional relative sea level during that time (9 inches, about 23 centimeters) was along the U.S. western Gulf Coast, largely due to land subsidence from groundwater and fossil fuel extraction. Comparatively, regional relative sea level rise along the northeast and southeast Atlantic and eastern Gulf coasts was approximately 6 inches (about 15 centimeters). Along the Pacific Coast, natural modes of variability (the El Niño–Southern Oscillation and Pacific Decadal Oscillation) will continue to drive decadal variability in the rate of sea level rise.
Risks from rising sea levels include increased coastal flooding and increased vulnerability to coastal storms. Changes in average sea level have doubled the frequency of high tide flooding in the continental United States over the past few decades (USGCRP, 2023). In some cities, higher rates of local sea level rise have increased flood frequency. For example, using data from 1998 to 2013, Wdowinski et al. (2016) showed that significant changes in Miami Beach, Florida, flood frequency occurred after 2006, with four times as many disruptive high tide flooding events compared to the 1998–2005 period.
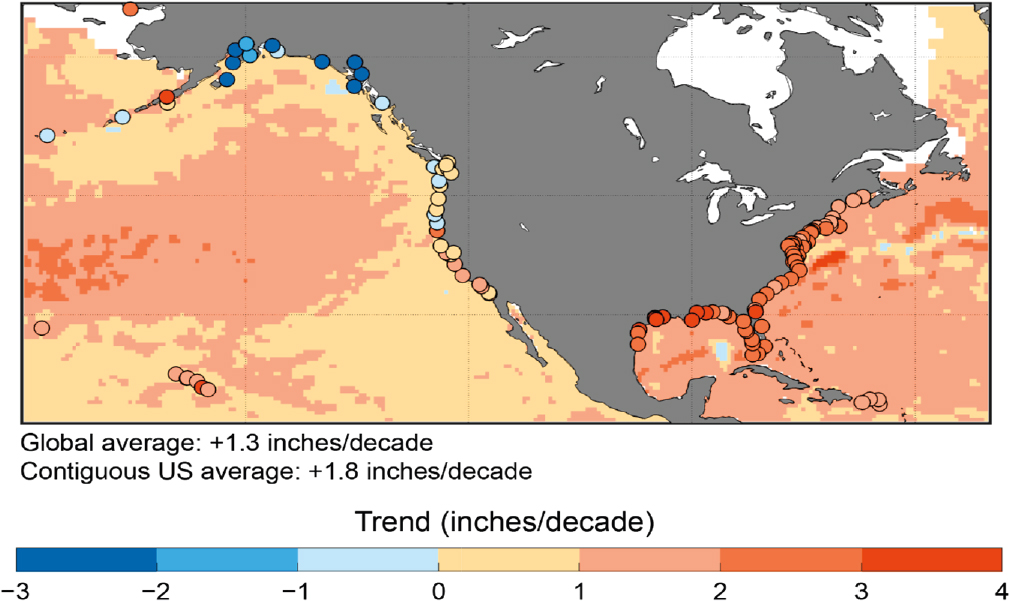
SOURCE: Marvel et al., 2023.
Longer observational records have increased confidence in estimates of human-caused sea level rise and acceleration in the rate of increase. Furthermore, with the benefit of a longer record, patterns and influences of natural variability of the ocean on interannual to decadal timescales can be more readily identified. This strengthens confidence since EPA (2009a) to support the conclusion that “global sea level gradually rose in the 20th century and is currently rising at an increased rate” (p. ES-3).
Biosphere
As discussed in previous sections, global increases in GHGs result in increases in global temperature, which in turn affects atmospheric and ocean circulation. These changes alter local weather conditions including increased local air or sea surface temperature (see Section 3.2) and precipitation and evapotranspiration patterns that control the moisture status of soils (see Section 3.3). Local conditions drive environmental forcings that can impact ocean chemistry (see Section 3.4) and sea level rise (see Section 3.6), as well as temperature and moisture stress; increased floods, drought, wildfire or wind events; and increased freshwater inputs to coastal areas.
These conditions control ecosystem response to climate changes, including increases in the frequency and severity of disturbance, incidence of novel disturbances, changes in primary productivity, changes in the movement of organic and inorganic matter, and altered populations and communities. Changes in these systems that most directly relate to impacts on human health and public welfare are discussed in more detail in Chapters 5 and 6—for example, how changing temperature and precipitation patterns can impact ecosystems, crops, livestock,
and water resources (public welfare, Chapter 6), as well as impacts on the distribution of vector-borne diseases and allergens (human health, Chapter 5).
Ground-Level Ozone
As EPA (2009a) described, climate change affects ground-level ozone by modifying precursor emissions (other compounds that produce ozone through chemical reaction in the atmosphere), atmospheric chemistry, transport, and removal. USGCRP (2023) expanded on climate-sensitive factors driving increases and decreases in ozone concentrations, which include temperatures, heat waves, wildfires, drought, and biogenic emissions. Climate change can also reduce ozone pollution through increasing humidity. Climate change-induced changes in precipitation do not affect ozone, and effects of climate change-induced changes in regional transport and stagnation are unknown (USGCRP, 2023).
New studies further corroborate the effects of climate change on ground-level ozone reported in EPA (2009a) (USGCRP, 2016, 2023). Historical climate change has increased peak season ozone concentrations over North America (Turnock et al., 2025). Ozone increases driven by climate change may put some areas of the United States into nonattainment with the ozone National Ambient Air Quality Standard (Chang et al., 2025; East et al., 2024). Wildfires release ozone precursor gases and therefore can worsen ozone concentrations (Cooper et al., 2024), including far downwind of the fire; this is demonstrated by, for example, fires in Canada increasing ozone in the U.S. Midwest (Cooper et al., 2024) and fires in California, Washington, and Arizona increasing ozone in northern Colorado by 8 parts per billion in July 2021 (Langford et al., 2023). Studies find increasing co-occurrence of ground-level ozone with fine particulate matter, wildfire smoke, and heat extremes (Kalashnikov et al., 2022). Ozone, heat, and particulate matter can act synergistically on biological systems, leading to worse health outcomes compared with ozone exposure alone (see Chapter 5) (Anenberg et al., 2020; Fann et al., 2021; He et al., 2025; Remigio et al., 2021).
In addition to the impacts of climate change on ground-level ozone, CH4 is both a potent GHG and a precursor for ground-level ozone. While local, daily variations in ozone concentrations are largely driven by reaction of non-CH4 volatile organic compounds with nitrogen oxide emissions in the presence of sunlight, decades of research show that CH4 also influences long-term average ozone concentrations globally and in the United States (Fiore et al., 2002; Fiore et al., 2008; McDuffie et al., 2023; Shindell et al., 2024; West and Fiore, 2005; West et al., 2006; Zhang et al., 2016). One study estimated that global CH4 increases contributed 15% of observed trends in daily maximum 8-hour average ozone over the western United States from 1980 to 2014 (Lin et al., 2017).
3.6 WILDFIRES
The evidence supporting the EPA (2009a) discussion of impacts of climate on wildfires has strengthened greatly since 2009, as the occurrence of wildfires in the western United States has increased (Abatzoglou and Williams, 2016; Duffy et al., 2018). While records show a deficit in widespread fire relative to pre-1880 fire regimes, this is largely a result of fire suppression (Parks et al., 2025). Despite this deficit, wildfire intensity has been amplified by climate change (Jones, Veraverbeke et al., 2024; Parks and Abatzoglou, 2020), even under human fire suppression.
Increasing wildfire severity and annual area burned are linked to climate change (USGCRP, 2023). Warmer springs, prolonged summer dry periods, and progressively drier soils and fuel sources increase the likelihood for wildfire ignition and spread (Ostoja et al., 2023). Earlier snowmelt and diminished snowpack reduce water availability during peak summer heat, further lowering fuel moisture and enabling hotter, more intense burning. These dynamics are expected to persist as droughts become more frequent and longer in duration in some regions within the United States. Since 2009, these same drivers—earlier spring onset, longer summer dryness, and cumulative drought stress—have continued to lengthen the fire window and raise the probability of large, fast-spreading events, especially in the western United States.
Observations have been consistent with these mechanisms. In the West, both total burned area and the area burned at high severity have increased alongside warmer, drier fire seasons and higher vapor-pressure deficit (a
measure of fuel aridity) (Abatzoglou and Williams, 2016). Synthesizing satellite burn-severity maps with incident records indicates roughly an eightfold rise in annual area burned and in high-severity burned area in western forests since the mid-1980s (EPA, 2025g). National indicators show greater acreage burned and longer fire seasons in the West relative to the East.
With increased wildfires, substantial amounts of particulate matter are produced (Law et al., 2025). Exposure to fine particulate matter is a known cause of mortality and cardiovascular disease and is linked to onset and worsening of respiratory conditions (see Section 5.3).
Wildfire Feedbacks
Changes in the water cycle are making forests in the western United States more susceptible to drought and wildfire. Moreover, increases in atmospheric nitrogen deposition and ground-level ozone shift the processing of water, carbon, and nitrogen in forest ecosystems, resulting in a cascade of synergetic effects that make trees more prone to disease, pest invasion, drought, and ultimately, wildfire. These air pollutants increase leaf turnover and litter mass and decrease the decomposition of litter (Gilliam et al., 2019). As a result, mixed conifer forests of southern California that are impacted by nitrogen and ozone pollution develop deep litter layers. Elevated ozone decreases plant control of water loss, increasing transpiration, which when coupled with loss of root mass, increases the susceptibility of trees to drought stress and makes them more vulnerable to attack by bark beetles, leading to significantly higher tree mortality (Jones et al., 2004).
The enhanced fuel load from tree decline and litter accumulation, coupled with historical fire suppression, increases in housing developments at the wildland–urban interface, and climate change, have resulted in catastrophic fires in northern and southern California in recent years, exacerbating air quality and health impacts. Such feedbacks are expected to continue to influence wildfires in the future, which would accelerate a deterioration in air quality and its associated impacts.
Wildfires also release large amounts of CO2, CH4, and other GHGs, as well as black carbon particles into the atmosphere, which contribute to climate warming, leading to a positive feedback loop that could further increase wildfire risk (NASEM, 2024e). Black carbon, a potent short-lived climate forcer present in wildfire smoke, accelerates glacier and snow melt and amplifies atmospheric warming. Elevated emissions from recent wildfires have been measured at levels equivalent to the annual fossil fuel output of major industrialized nations (Byrne et al., 2024). Jones, Veraverbeke et al. (2024) found that global CO2 emissions from forest fires have surged by 60% since 2001 largely due to increasingly intense and wide-ranging wildfires.
3.7 WHIPLASH AND COMPOUND EVENTS
Back-to-back occurrences of severe floods and droughts (referred to as weather or hydroclimate whiplash8) have increased in frequency and severity around the world (Li and Rodell, 2023; Swain et al., 2025). Using a metric of “hydroclimate whiplash” based on the Standardized Precipitation Evapotranspiration Index, Swain et al. (2025) find that the global-averaged sub-seasonal (3-month) and interannual (12-month) whiplash events have increased by 31–66% and 8–31% respectively since the mid-twentieth century. Extensive evidence links those increases primarily to thermodynamics, namely the rising water vapor-holding capacity and potential evaporative demand of the atmosphere. These increases highlight how the response of the climate system to warming can be nonlinear in a way that compounds its impact on the environment.
Another form of weather whiplash occurs with winter weather events. Rapid swings in winter weather can result in crossing from frozen to unfrozen conditions, or vice versa; thus, the potential impact of these types of events on coupled human and natural systems may be large (e.g., Casson et al., 2019; Creed et al., 2023). It is less clear how climate change is altering these events given limited observational records and the infrequency of these events.
___________________
8In this context, “whiplash” refers to rapid swings from one extreme or specified climate state to another (e.g., from drought to flood or from frozen to unfrozen winter weather conditions).
Compound events involve multiple climate drivers or hazards that either occur together or in a connected sequence, either in an individual location or across multiple locations (e.g., Zscheischler et al., 2018). The combinations of climate drivers and hazards can result in significantly greater impact than occurs because of a single climate driver. For example, the 2017 wildfires in California were followed by intense rainfall events on burned landscapes, resulting in mudslides and debris flows (USGCRP, 2023). Another example is the September 2024 flooding in Asheville, North Carolina, after Hurricane Helene. When the hurricane was still more than 620 miles (1,000 kilometers) to the southwest of Ashville, western North Carolina experienced an extreme rainfall event, receiving 5–8 inches (125–200 millimeters) of rain in less than 24 hours. This predecessor extreme rainfall event occurred when the moisture associated with Hurricane Helene met a southeastward-moving cold front originating from the Northern Plains (Schreck, 2025). This rainfall event, combined with the rainfall associated with the hurricane directly, contributed to the flooding experienced in the region. USGCRP (2023) indicates that observed compound events across the United States are becoming more frequent and severe due in part to climate change, which intensifies the underlying physical drivers.


