PFAS in Agricultural Systems: Guidance for Conservation Programs at USDA (2026)
Chapter: 4 Decision-Making Under Uncertainty
4
Decision-Making Under Uncertainty
The lack of data regarding the magnitude of per- and polyfluoroalkyl substances (PFAS) contamination on agricultural land, combined with uncertainties about what different potential PFAS sources may contribute to farm contamination, poses a challenge to advising farmers on how to manage PFAS risks. Concomitantly, there are issues around the unknowns on the fate, transport, and toxicity of different PFAS, and there is no federal agency consensus on the definition of PFAS, including in the context of agriculture. This chapter describes considerations the Farm Production and Conservation (FPAC) agencies may take into account with regard to a working definition of PFAS. It also summarizes how data on the proximity of farmland to potential PFAS sources along with PFAS measurements from previous studies could be leveraged to identify at-risk agricultural land and to advise farmers accordingly. Finally, it describes a framework that could be used by FPAC agencies to make decisions about PFAS in the face of uncertainty.
IDENTIFYING PFAS OF CONCERN ON AGRICULTURAL LAND
As discussed in Chapter 2, PFAS have circulated so widely around the globe that detection of one or more of these substances is likely even on farmland distant from major PFAS sources. However, much is unknown about the fate, transport, and toxicity of many PFAS. In addition to evaluating the risk that conservation practices could lessen or exacerbate PFAS contamination in soil and water on or off the farm, the Natural Resources Conservation Service (NRCS) needs to identify a way to determine if all PFAS that may be present are of equal concern. However, crafting a working agricultural definition of PFAS for the purpose of reducing complexity for on-farm guidance is difficult. No single definition of PFAS has been agreed to, whether based on chemical structure, existing regulations, or chemical behavior and properties. Below,
the committee reviews approaches that could be considered for defining PFAS in an agricultural context.
While there is agreement that what makes PFAS different from other synthetic compounds is the presence of one or more perfluorocarbons bound to a polar functional group, there is not a single, internationally accepted definition of PFAS. Slight variations exist among different federal agencies and international organizations regarding which chemical structures fall under a general class definition for PFAS. Commonly referenced definitions are based on structure and include Buck et al. (2011), the Organisation for Economic Co-operation and Development (OECD 2021), one published by the Environmental Protection Agency (EPA) in 2022, and a second EPA definition published in Gaines et al. (2023) (Table 4-1). Additionally, the 2021 National Defense Authorization Act (NDAA) contained a PFAS definition that was used to coordinate federal activities related to PFAS.1 Notably, under the fiscal year 2023 NDAA, a report on PFAS use within the U.S. Department of Defense (DoD) was issued that utilized the OECD definition of PFAS (DoD 2023). In some cases, there are curated lists of compounds that have been identified as meeting these PFAS published definitions. For example, the structures in Gaines et al. (2023) and EPA (2022) are in the EPA Comptox lists “PFAS Structures in DSSTox (update August 2022)”2 and “Chemical Contaminant Candidate List 5,”3 respectively. Although specific numbers of compounds that would be defined as PFAS under these definitions vary, in some cases (e.g., Gaines et al. 2023), there are currently more than 14,000 compounds with structures known to meet the relevant criteria.
Even though thousands of PFAS can be captured within the above definitions, few can be analyzed. Analytical standards are available for only a small subset of PFAS (less than 100), and there is no standard sample preparation or analytical method that includes all PFAS for which standards are available or all media relevant to agricultural systems (e.g., water, soil, sediment, plants, pesticides, fertilizers). However, EPA Method 1633A is one of the most widely applied standard methods for PFAS analysis (EPA 2024a). This method is applicable to the analysis of 40 PFAS in aqueous, soil, biosolids, sediment, and tissue samples. Additionally, EPA Method 1633A provides the flexibility to add additional PFAS without EPA approval and as standards become available, provided all quality control criteria can be met (EPA 2024a).
Therefore, a working PFAS definition based on chemical structure could be created for agriculture by narrowing down a broad list of chemicals that meet a structural definition of PFAS in Table 4-1 to those substances that can be successfully analyzed using a method such as EPA Method 1633A. This method alone would not be sufficient because, for example, the primary PFAS precursors in biosolids, such as the fluorotelomer phosphate diesters (diPAPs) of varying chain length, are not on the EPA Method 1633A list. However, they can be included and analyzed with this method. Utilizing
___________________
1William M. (Mac) Thornberry National Defense Authorization Act for Fiscal Year 2021, Public Law No. 116–283, tit. III, § 300f (2021).
2See https://comptox.epa.gov/dashboard/chemical-lists/PFASSTRUCTV5.
3See https://comptox.epa.gov/dashboard/chemical-lists/CCL5PFAS.
TABLE 4-1 Commonly Referenced Definitions of Per- and Polyfluoroalkyl Substances (PFAS)
| Reference | Definition |
|---|---|
| Buck et al. (2011) | “highly fluorinated aliphatic substances that contain 1 or more C atoms on which all the H substituents (present in the non-fluorinated analogues from which they are notionally derived) have been replaced by F atoms, in such a manner that they contain the perfluoroalkyl moiety CnF2n+1–” |
| 2021 National Defense Authorization Act | “…(A) man-made chemicals of which all of the carbon atoms are fully fluorinated carbon atoms; and (B) man-made chemicals containing a mix of fully fluorinated carbon atoms, partially fluorinated carbon atoms, and non-fluorinated carbon atoms.” |
| OECD (2021) | “PFASs are defined as fluorinated substances that contain at least one fully fluorinated methyl or methylene carbon atom (without any H/Cl/Br/I atom attached to it), i.e., with a few noted exceptions, any chemical with at least a perfluorinated methyl group (–CF3) or a perfluorinated methylene group (–CF2–) is a PFAS.” |
| EPA (2022) | Chemicals that have at least one of the following structures: R-(CF2)CF(R′)R″, R-CF2OCF2-R′, or CF3C(CF3)RR′ |
| Gaines et al. (2023) | Must contain at least 30% fluorine (not counting hydrogen) and a set of “substructural features” as shown below: |
analysis to guide a working definition of PFAS in this manner would require scheduled reviews (e.g., annual or similar) of the availability of new standards and the ability of laboratories to successfully analyze those standards using an established method.
Another approach to establishing a working definition of PFAS in agriculture could be to focus on PFAS that are already the subject of regulation, either at the federal level (such as under the Safe Water Drinking Act4 or the Comprehensive Environmental Response, Compensation, and Liability Act [CERCLA]5) or at the state level. In 2024, EPA established maximum contaminant levels (MCLs) for six PFAS in drinking water under the Safe Water Drinking Act (EPA 2024b);6 however, in May 2025, EPA announced its intention to rescind the MCLs for all but perfluorooctane sulfonic acid (PFOS) and perfluorooctanoic acid (PFOA; EPA 2025). Management of superfund sites subject to CERCLA relies on EPA Regional Screening Levels (RSLs), which are default screening levels for human exposure to contaminated residential and commercial–industrial soil, air, and drinking water that are based on toxicity information (i.e.,
___________________
442 U.S.C. §300f et seq.
542 U.S.C. §9601 et seq.
6The other PFAS in the 2024 rule were PFNA, PFHxS, HFPO-DA (GenX chemicals), and mixtures of two or more of the following: PFNA, PFHxS, HFPO-DA, and PFBS.
reference doses) combined with default exposure assumptions.7 At the time this report was published, there were more than 35 PFAS with screening levels for residential and industrial soil, tap water, and soil to groundwater pathways. As noted, RSLs are for residential and industrial exposure, so they are not specific to agricultural scenarios. Lastly, some states have developed regulatory criteria for PFAS in media including soil, water, and air. These criteria vary widely and are subject to change, but compilations are maintained by organizations such as the Interstate Technology & Regulatory Council (ITRC).8 Similar to analytical considerations, use of available MCLs and RSLs to guide an agricultural working definition of PFAS would require routine reviews for available reference doses (and associated RSLs when relevant).
As a result of the complications surrounding analysis and toxicity assessments of individual PFAS, some agencies and regulatory bodies are implementing limits on “total PFAS” concentrations. For example, the fiscal year 2020 NDAA prohibited DoD from procuring aqueous film-forming foam (AFFF) with greater than 1 part per billion (µg/kg) of PFAS.9 Total PFAS analysis does not elucidate which PFAS are present. It provides the total fluorine concentration associated with PFAS in a sample. Challenges include analysis and data interpretation. For example, combustion ion chromatography is often used as a method of total PFAS analysis, but sensitivity is low, and there is not a perfect method of sample preparation to ensure that analytical results represent total PFAS. Results may include non-PFAS sources of organic fluorine, including fluorinated pharmaceuticals, and when samples are prepared by extraction, it can lead to exclusion of highly soluble PFAS that are not well retained by the extraction approach (e.g., trifluoroacetic acid). Another example of analysis increasingly being used is the total oxidizable precursor (TOP) assay. The TOP assay converts PFAS precursors and some intermediate compounds to perfluoroalkyl acids (PFAAs), which can be more easily detected with targeted methods (Rehnstam et al. 2023; Lange et al. 2024; Dauchy 2025). Limitations of the TOP assay are that it is less likely to identify compounds such as fluorinated pharmaceuticals and there are challenges with data interpretation because some PFAS oxidize into more than one terminal PFAA. Moreover, oxidation consistency is affected by PFAS, matrix type, temperature control, reaction time, and proper analysis of ultra short-chain PFAAs. Regardless of these additional assays that may help to address estimation of total PFAS, regulatory or guidance criteria to inform total PFAS levels that require further action are lacking. Nevertheless, as more sensitive methods of total PFAS analysis (e.g., Hahm et al. 2024) become more commercially available, guidance on use of total PFAS as a screening or regulatory criteria may be developed. In that scenario, using total PFAS as a working definition (at least at the screening level) may be a practical and cost-effective method to help screen agricultural facilities for problematic PFAS impacts.
___________________
7See https://www.epa.gov/risk/regional-screening-levels-rsls.
8State-level standard and guidance values for PFAS in groundwater, drinking water, surface water, residential soil, and air are available by the ITRC under “PFAS Environmental Media Values Table Excel file,” found at https://pfas-1.itrcweb.org/fact-sheets (accessed September 2, 2025).
9National Defense Authorization Act for Fiscal Year 2020, Public Law No. 116–92, tit. III, § 322b (2019).
Another option for identifying a subset of PFAS that merits the most concern in agriculture (and thus its use as a working definition) is through approaches such as those used in the European Union Registration, Evaluation, Authorization and Restriction of Chemicals (REACH). Specifically, REACH identifies and defines substances of concern using persistence (P), bioaccumulation (B), and toxicity (T). More recently there have also been considerations for mobility (M) (Table 4-2) (Strempel et al. 2012; Hale et al. 2020; ECHA 2023, 2024). Designations used include PBT, PMT, PvB, and vMvT.10 Within REACH, these designations would be used to identify substances of very high concern that would be subject to restrictions such as reduced production volumes. However, in other settings, these factors could be used to identify chemicals within a family such as PFAS that merit the closest scrutiny when detected in environmental media. Compound-specific data are needed to evaluate P, B, T, and M categories, and experimental values are available for some PFAS. Compilations of experimental and calculated values needed to evaluate persistence, bioaccumulation, and mobility are provided for the majority of PFAS by EPA.11 The Open (Quantitative) Structure-activity/property Relationship Application (OPERA)12 is the primary tool used to generate calculated values. In the absence of toxicity data, these approaches could be proactively used to identify PB, PM, vPvB, or vPvM PFAS. There is also increasing focus on the use of high-throughput screening methods to facilitate faster data collection, particularly for toxicity (NASEM 2017; Escher et al. 2023).
Approaches such as RSLs and assessments using REACH criteria focus on a single compound at a time and neglect the impacts of mixtures. It is well-established that PFAS in the environment primarily occur as mixtures. In some cases, this may lead to synergistic toxicological effects where the impacts of mixture exposure on human or environmental health exceed the sum of impacts of individual exposures. The approach used for regulation in the context of contaminant mixtures will depend on the type of toxicity data available (e.g., whole mixture or individual compound data) and the toxicological effect (EPA 2000). As noted above, the original EPA MCLs for PFAS included six compounds. Four PFAS (GenX, perfluorobutanesulfonic acid [PFBS], perfluorononanoic acid [PFNA], and perfluorohexane sulfonate [PFHxS]) were to be regulated using a hazard index (HI), which is appropriate for contaminant mixtures that have similar toxicological effects (EPA 2000). Specifically, the original MCLs proposed that detected concentrations of GenX, PFBS, PFNA, and PFHxS in drinking water would each be divided by a compound-specific, health-based limit in water to yield a hazard quotient. The sum of the hazard quotients (i.e., the HI) should not exceed 1. Although EPA has announced it intends to rescind the HI (EPA 2025), the original 2024 regulation demonstrates a PFAS-specific example of a common approach for regulating contaminant mixtures. Approaches for regulating PFAS mixtures is an emerging area that may change as PFAS toxicity research evolves.
___________________
10Persistent, bioaccumulative, and toxic; persistent, mobile, and toxic; persistent and very bioaccumulative; very mobile and very toxic.
11See https://comptox.epa.gov/dashboard/chemical-lists/PFASSTRUCT and https://comptox.epa.gov/dashboard/chemical-lists/PFASDEV1.
12See https://ntp.niehs.nih.gov/whatwestudy/niceatm/comptox/ct-opera/opera.
| Characteristic | Definition |
|---|---|
| Persistent (P) |
Meets 1 of the following:
|
| Very Persistent (vP) |
Meets 1 of the following:
|
| Bioaccumulative (B) | BCF ≥2000 |
| Very Bioaccumulative (vB) | BCF ≥5000 |
| Toxicity |
Meets any of the following:
|
| Mobility | Log organic-carbon water partition coefficient (Koc) <3.0 |
| Very Mobile | Log organic-carbon water partition coefficient (Koc) <2.0 |
NOTES: Degradation half-life (t1/2) is the time for half of the parent compound to be degraded. BCF = bio-concentration factor
DATA SOURCE: ECHA 2024, European Chemicals Agency, http://echa.europa.eu.
In summary, a working definition of PFAS for agriculture may need to consider structural features, the ability to detect a specific PFAS, and thresholds for deciding when detected concentrations merit further investigation. Currently, one of the most pressing challenges is the lack of consistent regulatory criteria for PFAS in agricultural soils (e.g., RSLs), including considerations for occurrence of PFAS mixtures. Because of the variation in regulations at the state level, federal guidance on thresholds in agricultural lands would be beneficial to assist conservation planners and others in contextualizing PFAS occurrence at agricultural facilities. Notably, all of these considerations (structure, analysis, regulatory criteria, or the exceedance of a set threshold for some combination of persistence, bioaccumulation, toxicity, and mobility) are evolving areas of study and will require review and revision as the science advances.
IDENTIFYING AGRICULTURAL LANDS AT RISK FROM PFAS IN THE ABSENCE OF SITE-SPECIFIC DATA
Most agricultural lands have not been screened for PFAS. Monitoring PFAS occurrence at field sites including agricultural facilities can be expensive and time consuming, which can limit application to large regions. Additionally, although NRCS has an activity to assist with sampling costs for agricultural facilities interested in analyzing samples,13 routine and large-scale monitoring of PFAS at agricultural facilities is outside of NRCS’s scope. However, an understanding of PFAS occurrence may be useful for decision-making when considering implementation of conservation practices or support for agricultural facilities through the FPAC programs within the U.S. Department of Agriculture (USDA).
Because of the difficulty of site-specific modeling, along with the high costs of PFAS testing, new methods for estimating PFAS contamination risks based on available information about PFAS source locations could be helpful to inform decision-making about agricultural land. Recently developed databases and modeling methods provide a foundation for such alternative approaches. An increasing number of studies have demonstrated that data-driven approaches are useful for predicting the likelihood of PFAS occurrence (e.g., Guelfo et al. 2018; George and Dixit 2021; Hu et al. 2021; Li and MacDonald Gibson 2023; Moghadasi et al. 2023). These approaches couple existing datasets with statistical and/or machine-learning approaches to develop predictive models of PFAS occurrence.
Databases on PFAS Sources
Some federal and state agencies have compiled data on PFAS source locations and locations where PFAS have been measured previously that may be useful to inform risk management decisions. Table 4-3 lists selected examples. Data such as PFAS sources and soil and hydrogeologic characteristics are used as predictors for the likelihood of
___________________
13See discussion of Conservation Evaluation and Monitoring Activity 209 in section “Conservation Program Capabilities” in Chapter 2.
PFAS impacts. PFAS occurrence data are typically used to train and validate predictive models. In addition to geospatial data, data-driven approaches may incorporate PFAS fate and transport properties such as soil–water partitioning coefficients, particularly when models are focused on prediction of specific PFAS concentrations as opposed to the simple presence or absence of PFAS. Data from fate and transport models are increasingly being integrated with machine-learning models (Boxes 4-1 and 4-2).
Among the most comprehensive datasets is the EPA PFAS Analytical Tools database.14 This database allows users to visualize and download locations of a wide variety of facility types where PFAS have been manufactured, used, or unintentionally released to the environment. Examples include PFAS manufacturing companies, federal facilities that use or handle PFAS (e.g., Air Force bases that used AFFF), industrial facilities using PFAS, Superfund sites, and others. The database also includes data from previous PFAS testing in groundwater and surface waters.
PFAS Risk Screening Models
Recently, multiple research teams have leveraged public data sources (such as those in Table 4-3) to build and test computational models that predict the probability of PFAS occurrence in groundwater. Such models could also be useful for identifying areas where soil is at risk because soil serves as a major PFAS reservoir and source for groundwater contamination. Less extensive efforts have been made in predicting PFAS in soil. In both cases, models have been built and tested at a variety of scales, from local to state, regional, and national.
Predicting PFAS in Groundwater
Studies using data-driven approaches to predict PFAS occurrence have largely focused on groundwater. As an example of a local model, Li and MacDonald Gibson (2023) used public data sources (such as those in Table 4-3) along with data on PFOA measurements from 12,226 groundwater samples collected by the Minnesota Department of Health in the East Metro area of Minneapolis/St. Paul. The authors trained machine-learning Bayesian network models to predict the probability of PFOA occurrence above a state health-based action level for drinking water. This area of Minnesota is affected by PFAS released by the 3M Cottage Grove Facility, which has produced PFAS since the 1940s. Li and MacDonald Gibson (2023) found that the models were 82–89 percent effective in distinguishing locations where groundwater had PFOA concentrations above the state action level. In a separate study, the authors used a similar modeling approach to predict the occurrence of four short-chain PFAS above Minnesota’s corresponding health risk limits (Li and MacDonald Gibson 2022). Models were more accurate for these short-chain PFAS than for the previously described PFOA models. Following a similar approach, one could create maps that predict the chance
___________________
TABLE 4-3 Representative DatasetsaUsed in Data-Driven Approaches for Predicting PFAS Occurrence in the Environment
| Data type | Data description | Reference |
|---|---|---|
| Potential PFAS Sources | Industry sources manufacturing 25,000 pounds of PFAS | Chemical data reporting under the Toxic Substances Control Actb (also accessible in U.S. Environment Protection Agency [EPA] PFAS Analytic Toolsc) |
| Those importing 25,000 pounds of PFAS | ||
| Facilities within industrial sectors that may be associated with PFAS use (e.g., paper manufacturing, petroleum manufacturing, textile mills) | EPA Enforcement and Compliance History Online (ECHO) database;d also accessible in EPA PFAS Analytic Tools | |
| EPA Facility Registry Servicee | ||
| State-level data on sites of land application of organic soil amendments or sites of permits for land application of biosolids | Examples: Minnesota Pollution Control Agency;f North Carolina Department of Environmental Quality;g Maine Department of Environmental Protection PFAS Investigation Maph | |
| PFAS spills/releases | Federal facilities with known or suspected PFAS releases (e.g., U.S. Department of Defense [DoD] sites) | Compiled by EPA in the PFAS Analytic Tools |
| Agricultural facilities within one mile of a known or suspected DoD PFAS release | Annual reports posted to DoD web page,i also accessible as part of the federal facilities in the EPA PFAS Analytic Tools | |
| Superfund sites with known PFAS detections | EPA search Superfund site information tool,j also accessible in EPA PFAS Analytic Tools | |
| Spill responses | National spill response center database,k also accessible in EPA PFAS Analytic Tools | |
| Accidental spills/one-time releases and those part of normal facility operations | EPA toxic release inventory data and tools,l also accessible in EPA PFAS Analytic Tools | |
| Point-source discharges | National pollution discharge elimination system data; available multiple locations including ECHO database and PFAS Analytic Tools | |
| PFAS monitoring data | PFAS in public water systems serving >10,000 and a subset of those serving 3,300–10,000 people | EPA unregulated contaminant monitoring rule (UCMR) web page,m also accessible in EPA PFAS Analytics Tools |
| Public water systems | Collected by a subset of states and compiled by EPA in the PFAS Analytics Tools | |
| Ambient PFAS data in water, soil, sediment, and biota collected by researchers and other stakeholders | Water quality portal,n also accessible in EPA PFAS Analytic Tools |
| Data type | Data description | Reference |
|---|---|---|
| Hydrogeologic data | Surface water drainage basins | United States Geological Survey hydrologic units in the watershed boundary databaseo |
| Depth to groundwater | National Groundwater Monitoring Networkp | |
| Soil data | PFAS attenuation in soils | Natural Resources Conservation Service Web Soil Surveyq |
| PFAS movement classes |
a In some cases, national datasets were assembled by EPA from multiple, smaller (e.g., state-level) regional datasets and only represent regions where such data collection was implemented.
b See How to Access the TSCA Inventory, https://www.epa.gov/tsca-inventory/how-access-tsca-inventory#alternate#access.
c See PFAS Analytic Tools, https://echo.epa.gov/trends/pfas-tools.
d The ECHO database integrates federal records (including the Facility Registry Service) with environmental compliance data. See https://echo.epa.gov.
e See Facility Registry Service, https://www.epa.gov/frs.
f See Land Application Sites in Minnesota, https://gisdata.mn.gov/dataset/env-land-application-sites.
g See Division of Water Resources (DWR) Non Discharge Land Application Field Permits, https://data-ncdenr.opendata.arcgis.com/datasets/4e16c0959f234a0eaf79ee4c3282fe8b_0/explore?location=35.090606%2C-79.681950%2C8.01&showTable=true.
h See Maine Department of Environmental Protection PFAS Investigation Map, https://experience.arcgis.com/experience/462392f57317486eb1c8d7eb6d0fea3d?id=468a9f7ddcd54309bc1ae8ba173965c7.
i See PFAS Task Force Reports and Briefings, https://www.acq.osd.mil/eie/eer/ecc/pfas/tf/reports.html.
j See Search Superfund Site Information, https://cumulis.epa.gov/supercpad/CurSites/srchsites.cfm.
k See National Response Center website, https://nrc.uscg.mil.
l See Toxic Release Inventory Toolbox, https://www.epa.gov/toxics-release-inventory-tri-program/tri-toolbox.
m See Occurrence Data from the Unregulated Contaminant Monitoring Rule, https://www.epa.gov/dwucmr/occurrence-data-unregulated-contaminant-monitoring-rule.
n See National Water Quality Monitoring Council WQX 3.0 Beta website, https://www.waterqualitydata.us/beta.
o See Watershed Boundary Dataset, https://www.usgs.gov/national-hydrography/watershed-boundary-dataset.
p See National Groundwater Monitoring Network website, https://www.drought.gov/data-maps-tools/national-groundwater-monitoring-network.
q The Web Soil Survey does not have PFAS data present in its database. However, if a landowner suspects a PFAS issue on site or on adjacent sites, utilizing the Web Soil Survey tools related to PFAS may lead the user to more closely examine specific soil types to further identify the presence/absence/downward transport of PFAS.
BOX 4-1
Modeling PFAS Fate and Transport
An increasing number of studies are using models that incorporate PFAS-specific considerations to model PFAS fate and transport. Specifically, these models allow incorporation of transport parameters standard for modeling organic contaminants (e.g., sorption to soil) as well as those that are more unique to PFAS (e.g., air–water interface [AWI] sorption). Two examples are HYDRUS-1D and PFAS-LEACH. The earliest versions of HYDRUS-1D were developed in the 1990s by researchers at the Agricultural Research Service (ARS) of the U.S. Department of Agriculture (USDA; Simunek et al. 1998). HYDRUS-1D solves the Richards equation for unsaturated flow and couples it with advection–dispersion–reaction equations for solute transport, where reactions include processes such as chemical and biological transformation, sorption, plant uptake, and volatilization. Sorption models include equilibrium and rate-limited, and the latter has been found particularly relevant in modeling PFAS fate and transport. Recent versions of HYDRUS-1D have been adapted for use with PFAS by adding considerations for AWI sorption (Silva et al. 2020). HYDRUS-1D has been used to model non-agricultural scenarios, as well as fate and transport of PFAS at farmlands under effluent and biosolids application scenarios (Silva et al. 2022; Liao et al. 2025; Doria-Manzur et al. 2026).
More recently, the U.S. Department of Defense has sponsored efforts to develop PFAS-LEACH, which is a multitiered “decision support platform” to assess PFAS leaching in source zones.a The four tiers decrease in complexity from Tier 1 to Tier 4. Tiers 1 and 2 are still under development. Tiers 3 and 4 are both Excel-based tools. Tier 3 relies on mathematical solutions to transport equations to estimate how PFAS leach through the unsaturated zone (Guo et al. 2022). Unsaturated zone leaching can be coupled with groundwater dilution to support estimation of PFAS concentrations in receptor wells and development of site-specific soil screening levels (SSLs) for PFAS (Smith et al. 2024), both of which are key for regulatory decision-making. Tier 4 is an algebraic model that revises the Environmental Protection Agency’s (EPA’s) method of calculating dilution and attenuation factors (DAFs; Brusseau and Guo 2023). EPA DAFs are used in calculating SSLs by modeling how contaminant concentrations are reduced between the source zone and a receptor well. The revised DAF model incorporates the impact of AWI sorption.
Whereas HYDRUS-1D and PFAS-LEACH focus primarily on contaminant leaching in the unsaturated zone, other models that originated in USDA–ARS laboratories focus on surface processes such as runoff, erosion, and sediment transport. The Soil and Water Assessment Tool (SWAT) was first published in 1998 as a tool to predict how land and water management choices (e.g., water use, nonpoint-source loading, and pesticide use) affect water quantity and quality at the watershed scale to support conservation planning and long-term scenario assessment (Arnold et al. 1998). The Agricultural Policy/Environmental eXtender (APEX) model, published in 2009, also simulates surface processes
but at the facility scale (Gassman et al. 2009). APEX simulates the impacts of different management practices, including nutrient management, tillage, crop selection, and conservation practices, on factors such as water flow, sediment transport, and pollutant transport at the facility to small watershed scale. Although neither SWAT nor APEX has been widely applied to understand PFAS in agricultural systems, both tools already incorporate pollutant transport and thus are well-poised for adaptation to include PFAS-specific considerations.
a See PFAS-LEACH, https://github.com/GuoSFPLab/PFAS-LEACH-Tier-3-4?tab=readme-ov-file.
BOX 4-2
Predicting Where PFAS Will Occur: From Mechanistic Models to Machine Learning
Managing PFAS risks on agricultural lands is challenging in part because it is difficult to know where these chemicals will occur. Therefore, predictive models are a fundamental tool in understanding the likelihood of PFAS occurrence in scenarios where PFAS data are not available. Traditional (i.e., mechanistic) models, such as the HYDRUS-1D and PFAS-LEACH models, simulate how chemicals move, accumulate, and degrade using known physical, chemical, and biological processes. These models work well when key parameters describing the behavior of PFAS (e.g., potential to sorb to soil and to transform chemically or biologically) are known. However, for the majority of PFAS, the parameters needed to implement mechanistic models are uncertain or unavailable, making fully mechanistic prediction challenging.
Statistical regression approaches offer an alternative method of predicting PFAS occurrence across geographic areas (e.g., Wood et al. 2025). For example, in linear regression, the expected value of a continuous outcome is modeled as a linear combination of independent variables (e.g., concentration = a0 + a1•distance to source + a2•soil carbon + …) while also accounting for correlations between observations in close spatial proximity to one another. In logistic regression, the log-odds of exceeding a threshold are modeled as a linear function of the predictors. For PFAS, however, because the properties of most compounds are uncertain or unavailable, parameters (e.g., a1 and a2 in the above equation) do not need to be known a priori but instead are estimated based on fitting a model to an existing dataset, in which PFAS of interest have been measured in soil or groundwater at known spatial locations.
While statistical models are a form of machine learning, in that parameters are “learned” from data, more recent machine-learning models offer a complementary approach. Rather than assuming relationships between PFAS occurrence and potential predictor variables are linear or quasi-linear, these models learn complex, often non-linear patterns from data. A typical PFAS training dataset is similar to those used for regression modeling; it links measured PFAS at sampling locations to predictors such as distance to known or potential sources, soil properties (e.g., organic carbon, texture, mineralogy, and pH), hydrogeology, land use and land cover, and climate. After training, the model can estimate PFAS presence or concentration at unsampled locations.
Machine-learning models can handle two kinds of prediction problems: classification and regression. Classification, like logistic regression, asks a yes–no or exceedance question, such as “Will PFAS exceed a health-based threshold at this location?” The model returns a probability or a class label. Regression, as in statistical regression models with continue outcome variables, asks for a continuous value, such as “What concentration should we expect at this location?” The model returns a number. Some machine-learning methods are designed for only one of these problem types, whereas many have versions that handle either type.
Decision trees and random forests, support-vector methods, neural networks, and gradient-boosting frameworks can all be configured either for classification (to estimate exceedance probability) or for regression (to predict concentration). Bayesian networks are most often used to estimate probabilities and support “what-if” reasoning, but with appropriate specification they can also predict continuous outcomes.
The above approaches come with different assumptions and tradeoffs. For example, logistic regression assumes a linear relationship on the log-odds scale and can be sensitive to strongly correlated predictors. Bayesian networks explicitly encode probabilistic relationships among variables and can incorporate correlated predictors and expert knowledge. Neural networks can capture complex, nonlinear patterns but are less transparent and typically require more data. All of these approaches require careful validation.
A recent review (Rahman et al. 2025) summarized 32 peer-reviewed studies using machine learning for PFAS prediction, source identification, and remediation assessment. Many studies reported high performance, although results depended strongly on data quality, coverage of source types, and appropriate validation, especially when models were applied beyond the conditions represented in the training data.
Overall, mechanistic and machine-learning approaches can be complementary. Machine learning can rapidly screen large areas—whether the task is classification or regression—to guide targeted sampling and management, while mechanistic understanding helps assess whether relationship observed in machine-learning models may be causal. Furthermore, some machine-learning techniques, such as Bayesian networks, may be useful for guiding further development of mechanistic models by uncovering key drivers of PFAS occurrence. The combination of these modeling approaches offers power for creating data-generated, evidence-based maps to help guide soil conservationists and agricultural producers in deciding whether testing for PFAS may be necessary.
(or probability) of occurrence of (in this case, four short-chain) PFAS in groundwater (e.g., Figure 4-1).
Bayesian network and other machine-learning approaches also have been used to develop models and maps for predicting PFAS in groundwater in other areas (see Box 4-2), including southeastern North Carolina (Roostaei et al. 2021), Michigan (Fernandez et al. 2023), and Colorado (Barton et al. 2025). George and Dixit (2021) used data including co-contaminant occurrence, proximity of facilities that likely used AFFF, and hydrologic data to build machine-learning models using linear and random forest regression to predict PFAS occurrence in California groundwater. The random forest model combining all predictors (270 total) was able to predict where the sum of PFOA and PFOS would exceed 70 ng/L (.07 µg/L) in groundwater with an area under the curve (AUC) of 0.90. Hu et al. (2021) used data including PFAS sources, hydrogeologic data, and meteorological data to build machine-learning models using logistics and random forest regression to predict concentrations of five commonly occurring PFAS in New Hampshire groundwater. The random forest model using 20 predictors was able to predict individual PFAS concentrations achieving AUCs of 0.74 (PFOS) to 0.86 (perfluoroheptanoic acid [PFHpA]) and the sum of five PFAS achieving an AUC of 0.81. These and other studies that use machine-learning approaches to evaluate environmental occurrence of PFAS were also included in recent reviews that provide more in-depth treatment of this topic (Torres-Martínez et al. 2024; Rahman et al. 2025).
Recently, researchers have used previous PFAS monitoring data to build prediction tools and maps of nationwide risks to groundwater. Tokranov et al. (2024) published a model and associated map for predicting the detection of any PFAS from among 24 analytes. The model was trained on thousands of water samples collected through multiple national sampling campaigns conducted by EPA, the U.S. Geological Survey, and the state of Wisconsin. They used a machine-learning approach known as XGBoost, which essentially involves constructing and linking hundreds of decision trees. The model predicts the probability of PFAS detection in groundwater at depths used for drinking water at a scale of 1 km by 1 km across the United States (Figure 4-2); its accuracy is comparable to that of previously referenced local and regional models.
In another study, private well samples were collected from four case study communities in different U.S. regions (West, northern Midwest, central Midwest, and South; Wood et al. 2025). At these sites, the research team found that proximity to known PFAS production facilities was the most important predictor of the total concentration of 25 measured PFAS, considering all source types represented in the EPA PFAS Analytic Tools database. Their statistical model estimated that a well located 0.5 km from a production facility could be expected to have a nine-fold higher total PFAS concentration than a well located 1 km away. Superfund sites, sites where PFAS were known to have been spilled, and federal facilities also were statistically significantly associated with the concentration of total PFAS. Wood and colleagues are using these results to create nationwide maps of PFAS risks in private wells that can serve as additional risk screening tools.
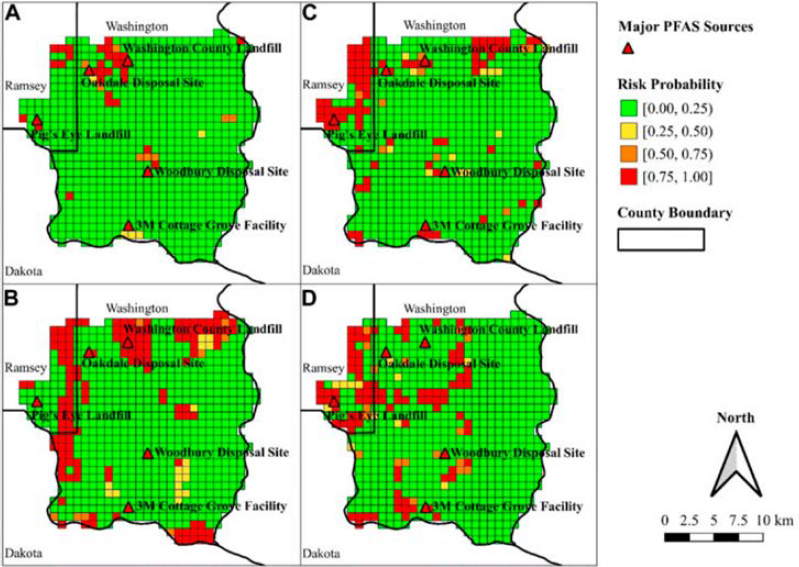
NOTE: A: Perfluorobutanoic acid (PFBA); B: Perfluorobutanesulfonic acid (PFBS); C: Perfluorohexanoic acid (PFHxA); D: Perfluorohexane sulfonate (PFHxS).
SOURCE: Li and MacDonald Gibson 2022. CC BY 4.0.
Predicting PFAS in Soil
Limited studies have applied data-driven approaches to predict PFAS concentrations in soil. Moghadasi et al. (2023) used PFAS soil-monitoring data and PFAS point sources to build a machine-learning model using random forest regression to predict PFAS occurrence in European soils. The random forest model—built only on point sources and existing PFAS soil data (divided into training and validation sets)—was able to predict PFAS concentrations in soil with an R2 of 60 percent. Predicted soil concentrations were coupled with soil bulk density, water content, and PFAS sorption coefficients (Kd) to predict PFAS concentrations in pore water. Soil concentrations of 5,000 ng/kg were predicted to lead to pore water concentrations of 2–5 ng/L (.002–.005 µg/L), which exceeds European regulatory criteria for drinking water. Despite limited applications, results of this study demonstrate that data-driven approaches utilized to generate predictive models of PFAS in groundwater can be applied to soil, which is key for agricultural scenarios.
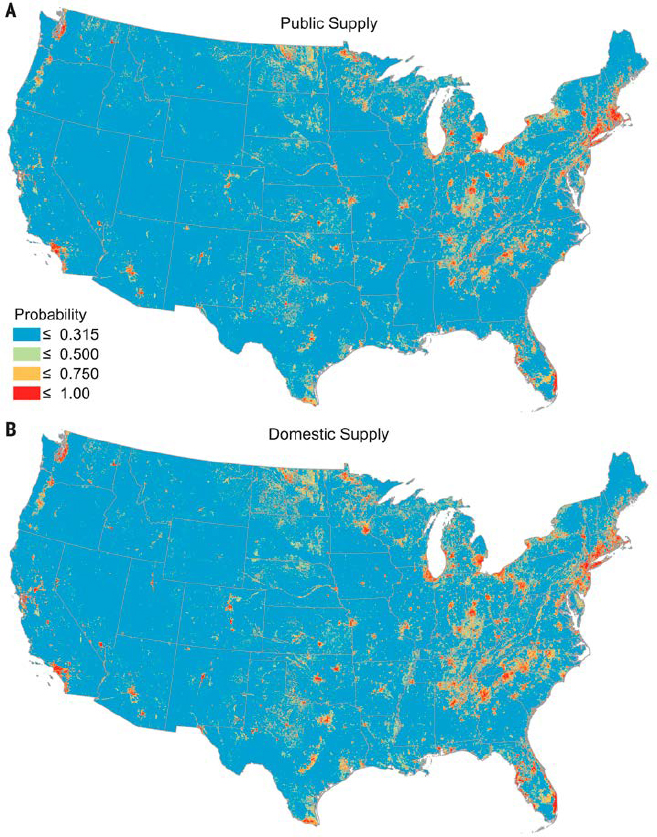
NOTE: (A) Public supply wells represent those used by community water systems (serving at least 15 service connections or 25 people year-round). (B) Domestic supply wells represent those used by one or a few households (fewer than 15).
SOURCE: Tokranov et al. 2024.
Challenges with Predictive Models
Data-driven approaches show exceptional promise as a practical tool for understanding PFAS occurrence over large regions, but key challenges in widespread application remain. First, data availability may vary from region to region, particularly PFAS monitoring data and data on certain types of PFAS releases such as biosolids and effluent application sites and historical spills and releases that pre-date tracking in regulatory databases. There are also issues associated with data consistency. This is particularly applicable to PFAS and water-quality monitoring data. Data preprocessing may be needed to handle factors such as varied detection limits and treatment of locations with data at multiple time points. Lastly, there is not a standard machine-learning approach for development of predictive models of PFAS occurrence. Despite these challenges, the studies to date demonstrate that development of large, regional models of PFAS occurrence in scenarios relevant to agricultural facilities (e.g., soil and groundwater) are currently feasible to develop with existing datasets.
INITIAL FRAMEWORK FOR DECISION-MAKING
Chapter 2 reviewed what is known about the occurrence, fate, and transport of PFAS in agricultural lands. Chapter 3 described the conservation planning process and how conservation practices, programs, and initiatives could influence PFAS introduction and movement on agricultural lands. In the sections above, the committee discussed different approaches for defining PFAS, in general and in agriculture, and how predictive maps may be tools to identify agricultural lands that could potentially have PFAS problems. Although there is a great deal more to learn about the fate and transport of different PFAS in agricultural systems, the committee drew upon the material reviewed up to this point to inform a decision-making framework that the FPAC agencies could potentially use to guide their efforts to respond to PFAS contamination on agricultural land.
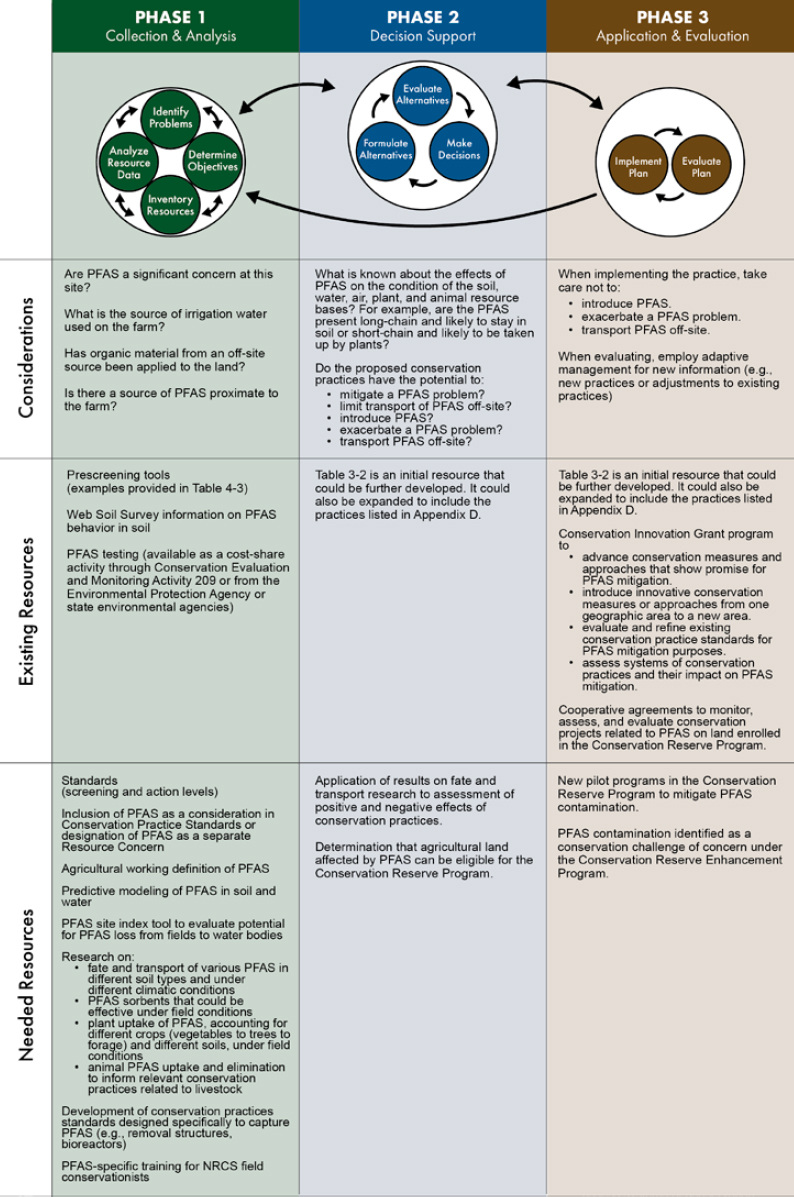
The framework illustrated in Figure 4-3 is connected to the nine-step conservation planning process described in Chapter 3 (see Figure 3-1). The figure below depicts the same planning process as an iterative effort with three phases, with the conservation planner able to move back and forth between steps and phases. The depiction is intentionally cyclical rather than linear to reflect how experienced planners move in and out of steps as new information surfaces. It also accommodates two possible realities: PFAS could be the explicit focus of a planning conversation, or it could be a background consideration while another resource concern drives the plan. The committee added a grid to the original NRCS image to describe in each phase certain considerations that might be made, resources that are available, and resources that are needed for the FPAC agencies to move forward in the face of uncertainty and lack of consensus information about PFAS contamination on agricultural land.
Phase 1 is the opportunity to identify the degree to which PFAS is a concern. If testing has not been carried out, it could be conducted at this time if the customer elects to do so. As outlined above (see section “PFAS Risk Screening Models”), planners could
make use of existing datasets and soil and hydrogeologic characteristics to determine whether PFAS are likely to be a problem for the specific site and resource in question (e.g., soil, water, air). Ideally, NRCS would work with other agencies that could build models specific to agricultural land, and the agency or others could add relevant features (such as distances from known sources, prior application of organic soil amendments, and soil and climate characteristics) from public sources and then use the resulting curated data to train and test predictive models. NRCS has already made at start by adding information about potential PFAS movement and attenuation in soils to the Web Soil Survey (Box 4-3).
If testing takes place, the process would benefit from a suitable standard operating procedure to collect representative samples, one that considers the targets of interest (e.g., PFAS concentrations), field topography, size, prior management, purpose of the measurement, and cost. A common approach is to collect several grab samples within each grid, combine them into a composite for that grid, and then analyze or subsample those grid composites to create one overall composite. However samples are collected, the test results remain with the customer and may or may not be disclosed back into planning. Whether or not testing occurs, as planners move into Phase 2, they can formulate and compare alternatives with PFAS risk explicitly kept in mind—avoiding new PFAS inputs (such as certain organic soil amendment sources) and avoiding practices that could mobilize or spread existing contamination—while weighing these considerations alongside the original resource concern (if PFAS is not the primary issue). Table 3-2 presents examples of how conservation practices may have positive or negative impacts with regards to PFAS contamination that conservation planners may want to keep in mind when recommending practices.
Phase 3 focuses on implementation with built-in evaluation. Practices could move forward with clear documentation of how PFAS was considered. If monitoring information, observations, or outcomes raise concerns about PFAS risk or unintended consequences, the process loops back to Phase 2 to adjust practices. The emphasis is on adaptive management—for example, switching water or soil amendment sources or revising practice selections—to avoid causing or exacerbating a PFAS problem. Innovative trials (as described in Chapter 3 with regard to the Conservation Innovation Grants under the Environmental Quality Incentives Program) and monitoring and evaluation (also described in Chapter 3 as part of the Conservation Reserve Program) could be implemented in this phase.
Overall, this framework is a planning aid rather than a prescriptive algorithm. It respects producer choice, the voluntary nature of programs, and current constraints such as the absence of uniform federal thresholds and the confidentiality of test results. Its purpose is to help field staff fold PFAS awareness into the work they already do—whether PFAS is the central issue or simply a prudent factor to consider—so that conservation activities do not inadvertently create new PFAS risks. Full operationalization of the framework will require additional data and tools development. NRCS could work with other agencies and entities to establish nationwide screening levels for different types of agricultural production facilities, soil types, and climatic systems. Machine-learning models could be trained, similar to those underlying the groundwater
BOX 4-3
USDA’s Web Soil Survey
The U.S. Department of Agriculture’s Natural Resources Conservation Service (NRCS) Web Soil Survey contains PFAS-related data present in its database. As most PFAS are anionic and thus have some degree of mobility in soils, a suite of soil properties that can lessen or completely retard PFAS movement through soils are coupled within the Web Soil Survey. To date, however, information regarding PFAS attenuation in soils and the PFAS attenuation model has not been created as a field in the Web Soil Survey. If a landowner suspects a PFAS issue on site or on adjacent sites, utilizing the PFAS variables in the Web Soil Survey may help the user to more closely examine specific soil types to further identify the presence, absence, or transport of PFAS to groundwater or surface water (Figure 4-4).
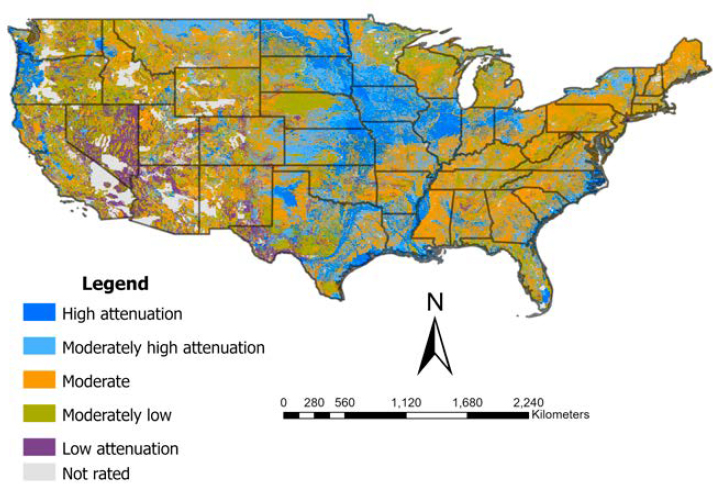
SOURCE: Data from NRCS Web Soil Survey, https://websoilsurvey.nrcs.usda.gov/app/WebSoilSurvey.aspx.
maps, using nationwide data on PFAS in agricultural soils and information in the Web Soil Survey combined with data on proximity to PFAS sources, agricultural land uses, climate, and other features.
Full operationalization of the framework would also be advanced through PFAS-specific training for NRCS field conservationists. NRCS field conservationists are often first points of contact for customers with PFAS concerns. At a minimum, a basic understanding by field conservationists of PFAS issues in agricultural systems, of the local, state, and federal resources available to impacted farmers, and of who to contact to help farmers access these resources would be of assistance to these customers (PFAS and Agricultural Policy Workgroup 2025). On-line training could be provided through USDA’s AgLearn centralized learning management system so that NRCS field conservationists across the country have consistent and up-to-date information.
Conclusion 4-1: A working definition of PFAS for agriculture may need to consider structural features of the compounds, the ability to detect a specific PFAS, and thresholds for deciding when detected concentrations merit further investigation. Federal guidance on thresholds of PFAS in agricultural lands would benefit conservation planners in contextualizing PFAS occurrence at agricultural operations.
Conclusion 4-2: Based on existing data-driven efforts to predict PFAS occurrence in groundwater and soil, it is possible to develop large, regional models that could help identify agricultural land at risk of PFAS contamination. NRCS could work with other agencies to build, train, and test such predictive models.
Conclusion 4-3: Even though many knowledge gaps about PFAS exist, there are sufficient opportunities within the conservation planning process, the conservation practice standards, and the conservation programs, as well as sufficient data about PFAS, for the FPAC agencies to create a framework for responding to the impacts of PFAS contamination on agricultural land. The development of federal guidance on PFAS thresholds in agricultural lands and the evaluation of additional data on PFAS in agricultural soils nationwide—which could be used to train predictive models—would enhance the ability of conservation planners to respond to PFAS concerns.
Conclusion 4-4: There is a need for coordinated training of NRCS field conservationists in the basics of PFAS and agriculture and for each NRCS state office to maintain a list of available resources for PFAS-affected farmers and contacts.
Applied research, discussed in the next chapter, could expand the capacity of existing practices and the development of new practices to address PFAS concerns. In cases where decision-makers determine that PFAS risks are unacceptably high, NRCS programs that support farmers in taking land out of production may be necessary.
REFERENCES
Arnold, J. G., R. Srinivasan, R. S. Muttiah, and J. R. Williams. 1998. “Large Area Hydrologic Modeling and Assessment Part I: Model Development.” JAWRA Journal of the American Water Resources Association 34 (1): 73–89. https://doi.org/10.1111/j.1752-1688.1998.tb05961.x.
Barton, Kelsey E., Peter J. Anthamatten, John L. Adgate, Lisa M. McKenzie, Anne P. Starling, Kevin Berg, Robert C. Murphy et al. 2025. “A Data-Driven Approach to Identifying PFAS Water Sampling Priorities in Colorado, United States.” Journal of Exposure Science & Environmental Epidemiology 35 (3): 414–424. https://doi.org/10.1038/s41370-024-00705-7.
Brusseau, Mark L., and Bo Guo. 2023. “Revising the EPA Dilution-Attenuation Soil Screening Model for PFAS.” Journal of Hazardous Materials Letters 4: 100077. https://doi.org/10.1016/j.hazl.2023.100077.
Buck, Robert C., James Franklin, Urs Berger, Jason M. Conder, Ian T. Cousins, Pim de Voogt, Allan Astrup Jensen et al. 2011. “Perfluoroalkyl and Polyfluoroalkyl Substances in the Environment: Terminology, Classification, and Origins. Integrated Environmental Assessment and Management 7 (4): 513–541. https://doi.org/10.1002/ieam.258.
Dauchy, Xavier. 2025. “The Quest for the Perfect ‘Total PFAS’ Method: How Can the Total Oxidisable Precursor (TOP) Assay Be Made Reliable?” Analytical and Bioanalytical Chemistry 417 (16): 3563–3577. https://doi.org/10.1007/s00216-025-05902-3.
DoD (U.S. Department of Defense). 2023. Report on Critical Per- and Polyfluoroalkyl Substances Uses. https://www.acq.osd.mil/eie/eer/ecc/pfas/docs/reports/Report-on-Critical-PFAS-Substance-Uses.pdf.
Doria-Manzur, Alonso, Evan P. Gray, Summer S. Streets, and Jennifer L. Guelfo. 2026. “Per- and Polyfluoroalkyl Substances (PFAS) Transport from Biosolids-Amended Soils: An Experimental and Numerical Approach.” Water Research 288: 124674. https://doi.org/10.1016/j.watres.2025.124674.
ECHA (European Chemicals Agency). 2023. Guidance on Information Requirements and Chemical Safety Assessment—Chapter R.11: PBT and vPvB Assessment Version 4.0, December 2023. https://doi.org/10.2823/312974.
ECHA. 2024. Guidance on the Application of the CLP Criteria: Part 4 and Part 5. Version 4.0, European Chemicals Agency. https://echa.europa.eu/documents/10162/2324906/clp_parts4-5_en.pdf/.
EPA (U.S. Environmental Protection Agency). 2000. Supplementary Guidance for Conducting Health Risk Assessment of Chemical Mixtures. EPA/630/R-00/002. https://iris.epa.gov/Document/&deid=20533.
EPA. 2022. “Drinking Water Contaminant Candidate List 5—Final.” Federal Register 87 (218): 68060–68085.
EPA. 2024a. Analysis of Per- and Polyfluoroalkyl Substances (PFAS) in Aqueous, Solid, Biosolids, and Tissue Samples by LC-MS/MS: Method 1633, Revision A. Office of Water. https://www.epa.gov/system/files/documents/2024-12/method-1633a-december-5-2024-508-compliant.pdf.
EPA. 2024b. “PFAS National Primary Drinking Water Regulation Rulemaking.” Federal Register 89 (82): 32532–32757.
EPA. 2025. “EPA Announces It Will Keep Maximum Contaminant Levels for PFOA, PFOS.” May 14. https://www.epa.gov/newsreleases/epa-announces-it-will-keep-maximum-contaminant-levels-pfoa-pfos.
Escher, Beate I., Rolf Altenburger, Matthias Blüher, John K. Colbourne, Ralf Ebinghaus, Peter Fantke, Michaela Hein et al. 2023. “Modernizing Persistence–Bioaccumulation–Toxicity (PBT) Assessment with High Throughput Animal-Free Methods.” Archives of Toxicology 97 (5): 1267–1283. https://doi.org/10.1007/s00204-023-03485-5.
Fernandez, Nicolas, A. Pouyan Nejadhashemi, and Christian Loveall. 2023. “Large-Scale Assessment of PFAS Compounds in Drinking Water Sources Using Machine Learning.” Water Research 243: 120307. https://doi.org/10.1016/j.watres.2023.120307.
Gaines, Linda G. T., Gabriel Sinclair, and Antony J. Williams. 2023. “A Proposed Approach to Defining Per- and Polyfluoroalkyl Substances (PFAS) Based on Molecular Structure and Formula.” Integrated Environmental Assessment and Management 19 (5): 1333–1347. https://doi.org/10.1002/ieam.4735.
Gassman, Philip W., Jimmy R. Williams, Xiuying Wang, Ali Saleh, Edward Osei, Larry M. Hauck, R. César Izaurralde, and Joan D. Flowers. 2009. The Agricultural Policy Environmental EXtender (APEX) Model: An Emerging Tool for Landscape and Watershed Environmental Analyses, Technical Report 09-TR 49. Iowa State University, Center for Agricultural and Rural Development. https://www.nrcs.usda.gov/sites/default/files/2023-04/ceap-crop-2009-APEX-Emergin-tool-Landscape-Watershed.pdf.
George, Sarabeth, and Atray Dixit. 2021. “A Machine Learning Approach for Prioritizing Groundwater Testing for Per- and Polyfluoroalkyl Substances (PFAS).” Journal of Environmental Management 295: 113359. https://doi.org/10.1016/j.jenvman.2021.113359.
Guelfo, Jennifer L., Thomas Marlow, David M. Klein, David A. Savitz, Scott Frickel, Michelle Crimi, and Eric M. Suuberg. 2018. “Evaluation and Management Strategies for Per- and Polyfluoroalkyl Substances (PFASs) in Drinking Water Aquifers: Perspectives from Impacted U.S. Northeast Communities.” Environmental Health Perspectives 126 (6): 065001. https://doi.org/10.1289/EHP2727.
Guo, Bo, Jicai Zeng, Mark L. Brusseau, and Yonggen Zhang. 2022. “A Screening Model for Quantifying PFAS Leaching in the Vadose Zone and Mass Discharge to Groundwater.” Advances in Water Resources 160: 104102. https://doi.org/10.1016/j.advwatres.2021.104102.
Hahm, Grace, Frenio A. Redeker, and Kaveh Jorabchi. 2024. “Multielement Detection of Nonmetals by Barium-Based Post-ICP Chemical Ionization Coupled to Orbitrap-MS.” Journal of the American Society for Mass Spectrometry 35 (5): 871–882. https://doi.org/10.1021/jasms.3c00424.
Hale, Sarah E., Hans Peter H. Arp, Ivo Schliebner, and Michael Neumann. 2020. “Persistent, Mobile and Toxic (PMT) and Very Persistent and Very Mobile (vPvM) Substances Pose an Equivalent Level of Concern to Persistent, Bioaccumulative and Toxic (PBT) and Very Persistent and Very Bioaccumulative (vPvB) Substances under REACH.” Environmental Sciences Europe 32 (1): 155. https://doi.org/10.1186/s12302-020-00440-4.
Hu, Xindi C., Beverly Ge, Bridger J. Ruyle, Jennifer Sun, and Elsie M. Sunderland. 2021. “A Statistical Approach for Identifying Private Wells Susceptible to Perfluoroalkyl Substances (PFAS) Contamination.” Environmental Science & Technology Letters 8 (7): 596–602. https://doi.org/10.1021/acs.estlett.1c00264.
Lange, Frank Thomas, Finnian Freeling, and Bernd Göckener. 2024. “Persulfate-Based Total Oxidizable Precursor (TOP) Assay Approaches for Advanced PFAS Assessment in the Environment—A Review.” Trends in Environmental Analytical Chemistry 44: e00242. https://doi.org/10.1016/j.teac.2024.e00242.
Li, Runwei, and Jacqueline MacDonald Gibson. 2022. “Predicting the Occurrence of Short-Chain PFAS in Groundwater Using Machine-Learned Bayesian Networks.” Frontiers in Environmental Science 10. https://doi.org/10.3389/fenvs.2022.958784.
Li, Runwei, and Jacqueline MacDonald Gibson. 2023. “Predicting Groundwater PFOA Exposure Risks with Bayesian Networks: Empirical Impact of Data Preprocessing on Model Performance.” Environmental Science & Technology 57 (46): 18329–18338. https://doi.org/10.1021/acs.est.3c00348.
Liao, Shuchi, Uriel Garza-Rubalcava, Linda M. Abriola, Heather E. Preisendanz, Linda S. Lee, and Kurt D. Pennell. 2025. “Simulating PFAS Transport in Effluent-Irrigated Farmland Using PRZM5, LEACHM, and HYDRUS-1D Models.” Journal of Environmental Quality 54 (1): 54–65. https://doi.org/10.1002/jeq2.20639.
Moghadasi, Ramin, Tabea Mumberg, and Philipp Wanner. 2023. “Spatial Prediction of Concentrations of Per- and Polyfluoroalkyl Substances (PFAS) in European Soils.” Environmental Science & Technology Letters 10 (11): 1125–1129. https://doi.org/10.1021/acs.estlett.3c00633.
NASEM (National Academies of Sciences, Engineering, and Medicine). 2017. Using 21st Century Science to Improve Risk-Related Evaluations. The National Academies Press. https://doi.org/10.17226/24635.
OECD (Organisation for Economic Co-operation and Development). 2021. Reconciling Terminology of the Universe of Per- and Polyfluoroalkyl Substances: Recommendations and Practical Guidance, OECD Series on Risk Management of Chemicals. OECD Publishing. https://doi.org/10.1787/e458e796-en.
PFAS and Agricultural Policy Workgroup. 2025. Federal Policy Recommendations to Address PFAS Contamination on Agricultural Land. https://farmland.org/files/federal-policy-recommendations-to-address-pfas-contamination-on-ag-land-sep.-2025.pdf.
Rahman, Md Hasan-Ur, Rabbi Sikder, Tanvir Ahamed Tonmoy, Md Mahjib Hossain, Tao Ye, Nirupam Aich, and Venkataramana Gadhamshetty. 2025. “Transforming PFAS Management: A Critical Review of Machine Learning Applications for Enhanced Monitoring and Treatment.” Journal of Water Process Engineering 70: 106941. https://doi.org/10.1016/j.jwpe.2025.106941.
Rehnstam, Svante, Mai-Britt Czeschka, and Lutz Ahrens. 2023. “Suspect Screening and Total Oxidizable Precursor (TOP) Assay as Tools for Characterization of Per- and Polyfluoroalkyl Substance (PFAS)-Contaminated Groundwater and Treated Landfill Leachate.” Chemosphere 334: 138925. https://doi.org/10.1016/j.chemosphere.2023.138925.
Roostaei, Javad, Sarah Colley, Riley Mulhern, Andrew A. May, and Jacqueline MacDonald Gibson. 2021. “Predicting the Risk of GenX Contamination in Private Well Water Using a Machine-Learned Bayesian Network Model.” Journal of Hazardous Materials 411: 125075. https://doi.org/10.1016/j.jhazmat.2021.125075.
Silva, Jeff Allen Kai, Jiří Šimůnek, and John E. McCray. 2020. “A Modified HYDRUS Model for Simulating PFAS Transport in the Vadose Zone.” Water 12 (10): 2758. https://www.mdpi.com/2073-4441/12/10/2758.
Silva, Jeff A. K., Jennifer L. Guelfo, Jiří Šimůnek, and John E. McCray. 2022. “Simulated Leaching of PFAS from Land-Applied Municipal Biosolids at Agricultural Sites.” Journal of Contaminant Hydrology 251: 104089. https://doi.org/10.1016/j.jconhyd.2022.104089.
Simunek, J., K. Huang, and M. Th. van Genuchten, 1998. The HYDRUS Code for Simulating the One-Dimensional Movement of Water, Heat, and Multiple Solutes in Variably-Saturated Media, Version 6.0. Research Report No. 144. Riverside, CA: USDA–ARS U.S. Salinity Laboratory.
Smith, Jacob, Mark L. Brusseau, and Bo Guo. 2024. “An Integrated Analytical Modeling Framework for Determining Site-Specific Soil Screening Levels for PFAS.” Water Research 252: 121236. https://doi.org/10.1016/j.watres.2024.121236.
Strempel, Sebastian, Martin Scheringer, Carla A. Ng, and Konrad Hungerbühler. 2012. “Screening for PBT Chemicals among the ‘Existing’ and ‘New’ Chemicals of the EU.” Environmental Science & Technology 46 (11): 5680–5687. https://doi.org/10.1021/es3002713.
Tokranov, Andrea K., Katherine M. Ransom, Laura M. Bexfield, Bruce D. Lindsey, Elise Watson, Danielle I. Dupuy, Paul E. Stackelberg et al. 2024. “Predictions of Groundwater PFAS Occurrence at Drinking Water Supply Depths in the United States.” Science 386 (6723): 748–755. https://doi.org/10.1126/science.ado6638.
Torres-Martínez, Juan Antonio, Jürgen Mahlknecht, Manish Kumar, Frank J. Loge, and Dugin Kaown. 2024. “Advancing Groundwater Quality Predictions: Machine Learning Challenges and Solutions.” Science of The Total Environment 949: 174973. https://doi.org/10.1016/j.scitotenv.2024.174973.
Wood, Erica, Riley E. Mulhern, Jacqueline MacDonald Gibson, Brian J. Reich, Andrea McWilliams, Chamindu Liyanapatirana, Kelly Hoffman et al. 2025. “PFAS in Rural U.S. Well Water: Using Participatory Science to Identify and Communicate Results to Address Risks.” Environmental Science & Technology 59 (32): 16852–16863. https://doi.org/10.1021/acs.est.5c02521.


