Recycled Asphalt Materials: Binder Availability and Its Impact on Mix Performance (2026)
Chapter: 2 Research Approach
CHAPTER 2 RESEARCH APPROACH
Figure 1 presents an overview of the research approach adopted in this project. The process began with a literature review and a survey of state DOTs (including one Canadian provincial transportation agency) to identify existing test methods for evaluating the RBA of asphalt mixtures containing RAM and to assess the current implementation status of the RBA approach. A critical review of these methods was then conducted, resulting in the selection of two candidate methods for laboratory evaluation using asphalt mixtures containing laboratory-prepared (LP) RAP samples. Based on the evaluation results, one method was chosen to assess the RBA of field RAM asphalt mixtures incorporating different RAM types, sources, and contents, as well as different mix design and production variables. Finally, the project examined the impacts of RBA on the performance and cost of high-RAM asphalt mixtures. Additional details on the research approach are provided subsequently.

2.1 Information Gathering
2.1.1 Literature Review
The literature review identified 14 existing test methods for evaluating the RBA of asphalt mixtures containing RAM, summarized as follows:
- Blending Simulation of Virgin and RAM Binders
- Comparison of Measured versus Predicted Dynamic Modulus of RAM Asphalt Mixtures
- Contact Blending Analysis of Two-layered Composite Binder Blend
- Extracted Binder Testing of Coarse-aggregate, Fine-RAP Asphalt Mixture
- Fluorescence Microscopy Analysis of RAP Binder Blend versus RAP Asphalt Mixture
- Ignition Oven Testing of Virgin Asphalt Mixture versus RAP Asphalt Mixture
- Performance Testing of RAM Asphalt Mixtures at Different RBA Conditions
- Photography Evaluation of Post-ignition RAP Aggregate with Virgin Binder
- Sieve Analysis of RAP versus Recovered RAP Aggregate
- Staged Solvent Extraction of Loose Mixture Particles of RAP Asphalt Mixture
- Use of Artificial Glass Beads in Virgin Aggregate as a Tracer for Extracted Binder Testing
- Use of Titanium Dioxide in Virgin Binder as a Tracer for EDS SEM Analysis
- Volumetric Analysis of Companion RAP Asphalt Mixtures
- Volumetric Analysis of Virgin versus RAM Asphalt Mixtures
Some of these methods are intended to qualitatively assess the blending and diffusion between virgin and RAM binders in the mixture, while others aim to quantitatively determine the RBA of the mixture. A detailed summary of each method is presented subsequently. Additionally, the literature review synthesized existing studies on definitions of RBA-related terminology, RAM quality characterization, and the impacts of RBA on mix design and performance of RAM asphalt mixtures. These findings are summarized in Appendix A.
2.1.1.1 Blending Simulation of Virgin and RAM Binders
This method involves casting thin films of virgin and RAM binders along the edge of two microscopic slides, as shown in Figure 2 (Nazzal et al., 2017). Each slide is heated on a hot plate at 154°C for 30 seconds and then positioned adjacent to one another. This arrangement allows the virgin and RAM binders to form a blended film with a diffused interfacial zone between the two slides. Atomic Force Microscopy (AFM) and force spectroscopy are subsequently employed to characterize the microstructure and viscoelastic domains within this interfacial zone. The resulting images are analyzed to qualitatively assess binder blending at the interface.

2.1.1.2 Comparison of Measured versus Predicted Dynamic Modulus of RAM Asphalt Mixtures
This method evaluates the blending of virgin and RAM binders by comparing the measured dynamic modulus (|E*|) of the mixture with the predicted |E*| derived from Dynamic Shear Rheometer (DSR) testing of the extracted and recovered asphalt binder (Bonaquist, 2005). During solvent extraction and recovery, the virgin and RAM binders are fully blended. The complex shear modulus (|G*|) master curve of the blended binder is then input into the Hirsch model to predict the |E*| of the mixture under an assumed full-blending scenario with 100% RBA. The relative difference between the measured and predicted |E*| serves as a qualitative indicator of whether complete blending occurs between the virgin and RAM binders. Although Bonaquist (2005) reported promising results, subsequent studies have provided mixed findings regarding the reliability of this method (Michael, 2011; Mogawer et al., 2012; Booshehrian et al., 2013; Farris, 2016; Yu et al., 2017; Roja et al., 2021).
2.1.1.3 Contact Blending Analysis of Two-layered Composite Binder Blend
This method involves DSR testing of two thin wafers, one composed of a virgin binder and the other of extracted and recovered RAP binder, placed in contact (Kriz et al., 2014; Rad et al., 2014; He et al., 2016). At elevated temperatures, the binders blend at their interface, allowing diffusion of the virgin binder into the RAP binder. As a result, the two-layered wafer represents a composite binder blend consisting of a layer of virgin binder and multiple layers of RAP binder with varying concentrations of diffused virgin binder. The composite binder sample is tested in the DSR to determine its rheological properties, and the results are analyzed using Fick’s law to estimate the diffusion rate of the virgin binder into the RAP binder. This method has also been modified to qualitatively assess the blending of virgin and RAS binders using topography AFM imaging, as shown in Figure 3 (Huang et al., 2017).

2.1.1.4 Extracted Binder Testing of Coarse-aggregate, Fine-RAP Asphalt Mixture
This method involves preparing RAP asphalt mixtures using virgin binder, fine RAP particles (passing a 4.75-mm sieve), and coarse virgin aggregate (retained on a 9.5-mm sieve) (Huang et al., 2005; Shirodkar et al., 2011; Bowers et al., 2014; Zhao et al., 2015; Ding et al., 2016; Zhao et al., 2016a; Zhao et al., 2016b; Yu et al., 2017; Gottumukkala et al., 2018; Hettiarachchi et al., 2020; Hou et al., 2021; Ma et al., 2021). After mixing, the loose mixture is separated into two fractions using a 4.75-mm sieve. As illustrated in Figure 4, the finer fraction consists of fine RAP particles (including RAP binder and aggregate) blended with virgin binder, while the coarser fraction represents a blend of coarse virgin aggregate, virgin binder, and a portion of the RAP binder activated during mixing. Asphalt binder extracted and recovered from each fraction is tested for rheological properties (e.g., viscosity and PG) and chemical properties [e.g., Fourier-transform Infrared Spectroscopy (FTIR) and Gel Permeation Chromatography (GPC)].
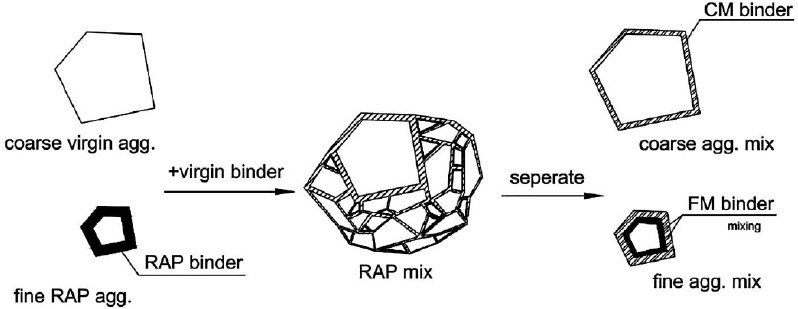
The method assumes that full blending between the virgin and RAP binders would result in identical properties for the two recovered binders; otherwise, the binder from the finer fraction would be stiffer and more brittle than the binder from the coarser fraction due to the presence of inactivated RAP binder. The RBA of the RAP asphalt mixture is quantitatively determined based on the difference in the measured property between the two recovered binders relative to the difference between the virgin binder and the recovered RAP binder, as expressed in Equation 1. Although this method was originally developed for RAP asphalt mixtures, a modified version has been applied to RAS asphalt mixtures by replacing fine RAP particles with preblended RAS and fine aggregates (passing the 4.75-mm sieve) (Zhao et al., 2014).
| Equation 1 |
Where PCF is a given property of the extracted and recovered binder from the coarse fraction of the RAP asphalt mixture; PFF is a given property of the extracted and recovered binder from the fine fraction of the RAP asphalt mixture; PV is a given property of the virgin binder; and PRAP is a given property of the extracted and recovered RAP binder.
2.1.1.5 Fluorescence Microscopy Analysis of RAP Binder Blend versus RAP Asphalt Mixture
This method evaluates the blending efficiency of RAP asphalt mixtures by measuring fluorescence differences between the virgin and RAP binders (Ding et al., 2018; Ding et al., 2020) through the following steps: (1) Develop a blending chart for RAP binder blends based on mean gray values obtained from fluorescence microscope images. Because fluorescence emission intensity decreases as binder ages, it can distinguish virgin binder from RAP binder. Ding et al. (2018) reported that the mean gray value decreases linearly with increasing RAP binder content. (2) Determine the RAP binder mobilization rate for multiple loose mixture particles by comparing their mean gray values to the blending chart, following Equation 2. (3) Calculate the overall binder mobilization rate for the RAP asphalt mixture using the mobilization rates of individual particles and their surface area percentages, as expressed in Equation 3.
___________________
1Yu, S., Li, P., Zhang, Z., & Shen, S. (2017). Evaluation of the blending effectiveness of reclaimed asphalt pavement binder. Journal of Materials in Civil Engineering, 29(12), 04017230. Copyright © 2017 by American Society of Civil Engineers. Republication Permission of American Society of Civil Engineers for first edition only. Translation prohibited.
| Equation 2 |
Where MRmix particle is the mobilization rate of the loose mixture particle; Pb,virgin is the percentage of virgin binder by total mixture; Pb,RAP is the percentage of RAP binder by total mixture; and RAP binder (%)blend is the RAP binder content of the loose mixture particle.
| Equation 3 |
Where MRmix particle is the mobilization rate of the RAP asphalt mixture; %SElarge mix particle is the surface area percentage of large aggregate particle; and %SEsmall mix particle is the surface area percentage of small aggregate particle.
2.1.1.6 Ignition Oven Testing of Virgin Asphalt Mixture versus RAP Asphalt Mixture
This method uses ignition oven testing on two companion asphalt mixtures: one virgin asphalt mixture without RAP and another incorporating RAP. Both mixtures are prepared with three aggregate fractions: coarse (passing a 12.5-mm sieve and retained on a 9.5-mm sieve), intermediate (passing a 9.5-mm sieve and retained on a 4.75-mm sieve), and fine (passing a 4.75-mm sieve and retained on 0.6-mm sieve) (Kaseer et al., 2019). The virgin asphalt mixture is composed of virgin aggregates with virgin binder, while the RAP asphalt mixture substitutes the intermediate virgin aggregate fraction with RAP of the same size (Figure 5) and reduces virgin binder content to maintain the same total binder content, assuming 100% RBA.

___________________
2Kaseer, F., Arámbula-Mercado, E., & Martin, A. E. (2019). A method to quantify reclaimed asphalt pavement binder availability (effective RAP binder) in recycled asphalt mixes. Transportation Research Record: Journal of the Transportation Research Board, 2673(1), 205–216. Copyright © 2019 by Sage Publications. Reprinted by Permission of Sage Publications
After mixing, both mixtures undergo short-term oven aging for four hours at 135°C and are cooled to ambient temperature. Each mixture is then sieved into three fractions using a 9.5-mm sieve and a 4.75-mm sieve. Binder content for each fraction is determined via ignition oven testing. The difference in binder content between the intermediate fractions of the two mixtures is used to estimate the RBA of the RAP asphalt mixture through linear interpolation between two extreme scenarios: full blending (100% RBA) and no blending (0% RBA).
The underlying assumption of this method is that, under full blending, the RAP binder becomes fully activated and mobilized to coat the virgin aggregates across all fractions; as a result, the RAP asphalt mixture would have the same binder content as the virgin asphalt mixture for the immediate fractions. Conversely, under a no-blending scenario, the RAP binder remains inactivated and confined to the intermediate fraction, resulting in a significantly higher content binder in that fraction compared to the virgin asphalt mixture. For this case, the binder content of the intermediate fraction in the RAP asphalt mixture can be estimated based on the measured binder content of the intermediate fraction in the virgin asphalt mixture, the difference in virgin binder content between the two mixtures, and the proportion and binder content of the intermediate RAP fraction in the RAP asphalt mixture.
2.1.1.7 Performance Testing of RAM Asphalt Mixtures at Different RBA Conditions
This method relies on performance testing of RAM asphalt mixtures prepared to simulate different RBA conditions, including 0% RBA, 50% RBA, 100% RBA, and Actual RBA (Al-Qadi et al., 2009; Coleri et al., 2018).
- The ‘0% RBA’ mixture is prepared by mixing the virgin binder, virgin aggregate, and post-ignition RAM aggregate. This mixture contains no extracted RAM binder, treating RAM as black rock with 0% RBA.
- The ‘50% RBA’ mixture is prepared by preblending the virgin binder with half of the extracted RAM binder based on the mix design, followed by mixing with the virgin aggregate and post-ignition RAM aggregate. This mixture relies on solvent extraction and recovery to activate half of the RAM binder to blend with the virgin binder for aggregate coating and binding. The extracted RAM binder is assumed to be fully blended with the virgin binder in the mixture.
- The ‘100% RBA’ mixture is prepared by preblending the virgin binder and extracted RAM binder before mixing with the virgin aggregate and post-ignition RAM aggregate. This mixture relies on solvent extraction and recovery to activate the RAM binder to blend with the virgin binder for aggregate coating and binding. Like the ‘50% RBA’ mixture, this mixture is assumed to have full blending between the extracted RAM binder and the virgin binder.
- The ‘Actual RBA’ mixture is prepared using the standard mixing procedure of virgin binder, virgin aggregate, and RAM. This mixture has the same total binder content as the ‘100% RBA’ mixture, but only a fraction of the RAM binder is activated to contribute to aggregate coating and binding. In other words, the RAM binder is partially blended with the virgin binder in the mixture.
Due to differences in the active RAM binder content, these mixtures are expected to exhibit varying rutting and cracking resistance. The RBA of the ‘Actual RBA’ mixture is determined based on the relative difference in the performance test results of these mixtures at varying RBA conditions.
2.1.1.8 Photography Evaluation of Post-ignition RAP Aggregate with Virgin Binder
This method estimates the activated binder ratio of RAP based on the “primed” coating of post-ignition RAP aggregate with virgin binder (Horan, 2020). The RAP sample is divided into two groups for photographic evaluation. The first group is heated in an oven at the anticipated mixing temperature for one hour and photographed. The second group is processed in an ignition furnace to determine the RAP binder content and obtain post-ignition RAP aggregate. The post-ignition RAP aggregate is then mixed with virgin binder in 0.25 to 0.5% increments and photographed. These images are visually compared to the image of the heated RAP sample in the first group. The amount of virgin binder that provides a similar appearance, based on the relative grey-black color contrast, is considered the activated RAP binder content. Finally, this value is divided by the RAP binder content from the ignition furnace to determine the activated RAP binder ratio. It is important to note that the activated binder ratio determined using this method is considered an intrinsic property of the RAP itself, rather than the RAP asphalt mixture. Therefore, it is conceptually different from the term RBA as defined in this project.
2.1.1.9 Sieve Analysis of RAP versus Recovered RAP Aggregate
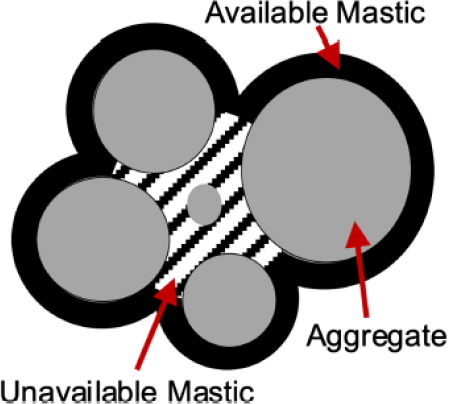
This method compares the particle size distribution of field-sampled RAP (the ‘black curve’) with that of post-ignition or post-extraction RAP aggregate (the ‘white curve’) (Pape and Castorena, 2022a; Mocelin and Castorena, 2023). The comparison provides an indication of RAP particle agglomeration, which is considered a primary factor for RAP binder availability. The underlying assumption is that peripheral mastic coatings in RAP are available to blend with virgin binder, while mastics bound within agglomerations are not, as illustrated in Figure 6. Based on the gradation results, RAP binder availability is calculated through the following steps:
- Calculate the average mastic film thickness in RAP by minimizing the absolute difference between the total mastic volume (Vmastic) calculated from Equation 4 and Equation 5. Equation 4 assumes spherical aggregate particles are coated with a uniform concentric mastic shell within RAP, while Equation 5 calculates the total mastic volume present in RAP.
- Calculate the volume of available mastic in RAP using Equation 6. This equation is similar to Equation 4 but uses the ‘black curve’ gradation of RAP instead of the ‘white curve’ gradation of the post-ignition or post-recovery RAP aggregate. Additionally, the particle diameter calculations are adjusted to account for the peripheral mastic film present on RAP particles.
- Calculate RAP binder availability using Equation 7 as the ratio of available mastic volume (Vavailable mastic) to Vmastic.
It is important to note that the RAP binder availability determined using this method is considered an intrinsic property of the RAP itself, rather than the RAP asphalt mixture. Therefore, it is conceptually different from the term RBA as defined this project.
| Equation 4 |
Where Vmastic is the volume of mastic in the mixture with 100 g of aggregate (cm3); Ni is the number of particles of size i; Vi is the volume of mastic coating aggregate of size i (cm3); Pi is the recovered aggregate percent passing sieve size i; Gsb is the aggregate bulk specific gravity; di is the sieve size (mm); and t is the mastic film thickness (mm).
| Equation 5 |
Where Vbe is the effective binder volume (cm3); Vfiller is the volume of filler (cm3); Pbe is the effective binder content; Pb is the total binder content; Gb is the specific gravity of the binder; Gsb is the bulk specific gravity of the aggregate; and P200 is the percent passing the 0.075-mm sieve.
| Equation 6 |
Where Vavailable mastic is the volume of available mastic in the mixture with 100 g of aggregate (cm3); and RPi is the RAP percent passing sieve size i.
| Equation 7 |
Where Vavailable binder is the volume of available binder in the mastic; and Vbinder is the volume of total binder in the mastic.
2.1.1.10 Staged Solvent Extraction of Loose Mixture Particles of RAP Asphalt Mixture
This method was originally developed to assess diffusion between asphalt binders at different aging conditions and has since been adapted to evaluate blending between virgin and RAP binders (Carpenter and Wolosick, 1980; Noureldin and Wood, 1987; Huang et al., 2005; Xu et al., 2018; Ali et al., 2021). In the original approach by Zearly (1979), an aggregate particle was first coated with an age-hardened binder and then with a soft binder to create a two-layer sample. The sample was eluted in trichloroethylene (TCE) three times, and the recovered binders were tested for penetration. Differences in penetration values indicated the degree of diffusion between the two binders.
In the adapted method by Bowers et al. (2014; 2015), loose RAP asphalt mixture particles were subsequently eluted in TCE solvents four times at intervals of 30 seconds, 1 minute, 3 minutes, and an extended duration to fully dissolve the asphalt binder. The binder recovered from each extraction was analyzed using GPC and FTIR to assess molecular size distribution and the presence of carbonyl and sulfoxide functional groups. Differences in GPC and FTIR results among the four extracted binders indicate the degree of blending between virgin and RAP binders. Due to its qualitative nature, this method does not provide a quantitative measure of RBA for RAM asphalt mixtures.
2.1.1.11 Use of Artificial Glass Beads in Virgin Aggregate as a Tracer for Extracted Binder Testing
This method uses borosilicate glass beads as tracers for virgin aggregates during RAM mixture preparation (Mohajeri, 2015; Sreeram et al., 2018). The mixture is prepared following a standard mixing procedure that combines virgin binder, virgin aggregate, glass beads, and RAM. After mixing, the glass beads are retrieved from the loose mixture, as shown in Figure 7. The asphalt binder coating the glass beads represents a blend of virgin binder and partially activated RAM binder. The RBA of the mixture is calculated by comparing a selected rheological or chemical property of the extracted binder from the glass beads (representing actual RBA) with those of the virgin binder (0% RBA) and the fully blended virgin-RAM binder (100% RBA), as defined in Equation 8.

| Equation 8 |
Where PGB is a given property of the extracted binder from the glass beads; PV is a given property of the virgin binder; and PRAP-blend is a given property of the recycled binder blend at the full-blending condition (i.e., the blend of virgin and extracted and recovered RAP binders assuming 100% RBA).
2.1.1.12 Use of Titanium Dioxide in Virgin Binder as a Tracer for EDS SEM Analysis
This method uses Energy Dispersive X-ray Spectroscopy (EDS) combined with Scanning Electron Microscopy (SEM) to evaluate the blending between virgin and RAP binders in the mixture (Castorena et al., 2016; Jiang et al., 2018; Abdalfattah et al., 2021). Titanium dioxide powder is preblended into the virgin binder prior to mixing, enabling differentiation of virgin and RAP binders in EDS mapping. Binder locations are identified by comparing carbon and titanium EDS maps: regions with carbon but no titanium correspond to inactivated RAP binder, while regions containing both carbon and titanium indicate a blend of virgin and activated RAP binders. In Figure 8, each image row represents different regions of a mixture specimen: adjacent to RAP (top), partially blended virgin and RAP binders (middle), and virgin binder (bottom). The columns show, from left to right, backscattered electron images, composite EDS maps, carbon EDS maps, and titanium EDS maps. The titanium-to-sulfur ratio derived from EDS maps can be used to quantitatively determine the RBA of the mixture (Jiang et al., 2018; Abdalfattah et al., 2021; Pape and Castorena, 2022a; Pape and Castorena, 2022b; Pape and Castorena, 2022c).

2.1.1.13 Volumetric Analysis of Companion RAP Asphalt Mixtures
This method applies volumetric analysis to two companion mixtures: one prepared with post-ignition RAP aggregate and the other with RAP assuming a specific RBA value (Coffey et al., 2012; Coffey et al., 2013). The mixture with post-ignition RAP aggregate is treated as a virgin asphalt mixture with no RAP binder, while the RAP asphalt mixture includes additional virgin binder to compensate for the inactivated RAP binder. The two mixtures share the same aggregate gradation. For each mixture, the virgin binder content required to achieve the design air voids is determined. The difference in virgin binder content between the two mixtures is then used to calculate the RBA of the RAP asphalt mixture, following Equation 9.
| Equation 9 |
Where Wvirgin-binder is the weight of virgin binder in the RAP asphalt mixture with an assumed RBA; Wm is the weight of the RAP asphalt mixture with an assumed RBA; ΔPbe,est is the difference in the estimated Pbe between the post-ignition asphalt RAP mixture and the RAP asphalt mixture with an assumed RBA; and WRAP-binder is the weight of RAP binder in the RAP asphalt mixture with an assumed RBA.
___________________
3Castorena, C., Pape, S., & Mooney, C. (2016). Blending measurements in mixtures with reclaimed asphalt: Use of scanning electron microscopy with X-ray analysis. Transportation Research Record: Journal of the Transportation Research Board, 2574(1), 57–63. Copyright © 2016 by Sage Publications. Reprinted by Permission of Sage Publications
2.1.1.14 Volumetric Analysis of Virgin versus RAM Asphalt Mixtures
This method uses volumetric analysis to compare a virgin asphalt mixture with a companion RAM mixture having the same aggregate gradation (Cooper et al., 2014; Cooper, 2015; Mohammad et al., 2019). Both mixtures are designed using the Superpave volumetric method, with the optimum binder content (OBC) determined at 4.0% air voids. Because the RAM binder cannot be fully activated to coat and bind aggregates, the RAM mixture requires a higher OBC than the virgin asphalt mixture to achieve the target air voids at the design gyration. The difference in OBC between the two mixtures, relative to the recycled binder content in the RAM mixture, is used to calculate the RBA following Equation 10. A larger OBC difference indicates a lower RBA.
| Equation 10 |
Where OBCRAM is the OBC of the RAM mixture; OBCV is the OBC of the virgin asphalt mixture; and Pb-RAM is the recycled binder content of the RAM mixture.
2.1.2 State DOT Survey
A survey of U.S. state DOTs and the Ministry of Transportation of Ontario found that, as of January 2023, nine agencies had adopted RBA values below 100% for asphalt mixtures containing RAM, while others continued to assume 100% RBA. Among these agencies, Ohio and New York DOTs applied RBA to RAP only; Illinois, Iowa, and Kentucky DOTs applied RBA to RAS only; and Georgia and South Carolina DOTs applied RBA to both RAP and RAS. Reported RBA values ranged from 60% to 90% for RAP and 60% to 85% for RAS. Survey responses varied regarding the preferred method for incorporating RBA into RAM mix designs. The three most selected methods were: (1) adding virgin binder to compensate for the inactivated RAM binder (35% of respondents); (2) reducing credit for RAM binder content (29% of respondents); and (3) reducing RAM bulk specific gravity (5% of respondents). Survey respondents also reported varied preferences for performance tests used to evaluate asphalt mixtures. The Hamburg Wheel Tracking Test (HWTT, per AASTHO T 324) was most frequently selected for assessing rutting resistance, while the Indirect Tensile Asphalt Cracking Test (IDEAL-CT, per ASTM D8225) was the most preferred choice for evaluating both load-related and thermal cracking resistance. Detailed survey responses and a copy of the questionnaire are provided in Appendix B.
2.2 RBA Method Selection
2.2.1 Critical Review of Existing RBA Methods
A critical review of existing RBA methods identified in the literature was conducted to assess: (1) ability to quantitatively determine the RBA of RAM asphalt mixtures; (2) ability to qualitatively assess the degree of blending or diffusion between virgin and RAM binders; (3) suitability for evaluating the RBA of asphalt mixtures with RAP only and those with RAP and RAS in combination (mixtures containing RAS only were not considered because they are not commonly used); (4) ability to differentiate RAM from various sources or under differing aging conditions; (5) sensitivity to common mix design and production variables; and (6) suitability to test plant produced RAM asphalt mixtures for field verification. The outcomes of this evaluation are presented in Table 1.
Of the 14 methods reviewed, 12 can either qualitatively assess the degree of blending or diffusion between virgin and RAM binders, quantitatively determine the RBA of RAM asphalt mixtures, or both. The remaining two methods focus solely on evaluating RAM without considering its interaction with other mixture components. Among all methods, the following five satisfied all of the criteria:
- Fluorescence Microscopy Analysis of RAP Binder Blend versus RAP Asphalt Mixture
- Performance Testing of RAM Asphalt Mixtures at Different RBA Conditions
- Use of Artificial Glass Beads in Virgin Aggregate as a Tracer for Extracted Binder Testing
- Use of Titanium Dioxide in Virgin Binder as a Tracer for EDS SEM Analysis
- Volumetric Analysis of Virgin versus RAM Asphalt Mixtures
The Fluorescence Microscopy Analysis of RAP Binder Blend versus RAP Asphalt Mixture and Use of Titanium Dioxide in Virgin Binder as a Tracer for EDS SEM Analysis methods require specialized equipment not typically available to state DOTs or asphalt contractors. Therefore, they were excluded from further consideration due to their limited potential for routine use in mix design and production. The Volumetric Analysis of Virgin versus RAM Asphalt Mixtures method was also eliminated because volumetric parameters are unlikely to fully distinguish between active and inactive RAM binders in the mixture, reducing the reliability of RBA determination. Consequently, two methods—Performance Testing of RAM Asphalt Mixtures at Different RBA Conditions and Use of Artificial Glass Beads in Virgin Aggregate as a Tracer for Extracted Binder Testing—were retained and ultimately selected for laboratory evaluation using LP-RAP asphalt mixtures. These methods are hereinafter referred to as the Performance Testing and Glass Beads methods, respectively.
Table 1. Critical Review of Existing RBA Methods in Literature
| Test Method | Ability to quantitatively determine RBA of RAM asphalt mixtures | Ability to qualitatively assess blending or diffusion of virgin and RAM binders | Suitability for evaluating RAP-only mixtures and RAP/RAS asphalt mixtures | Ability to differentiate RAM from various sources and aging conditions | Sensitive to common mix design and production variables | Suitability to test plant produced mixtures for field verification |
|---|---|---|---|---|---|---|
| Blending Simulation of Virgin and RAM Binders | X | X | ||||
| Comparison of Measured versus Predicted Dynamic Modulus of RAM Asphalt Mixtures | X | X | X | X | X | |
| Contact Blending Analysis of Two-layered Composite Binder Blend | X | X | ||||
| Extracted Binder Testing of Coarse-aggregate, Fine-RAP Asphalt Mixture | X | X | X | X | X | |
| Fluorescence Microscopy Analysis of RAP Binder Blend versus RAP Asphalt Mixture | X | X | X | X | X | X |
| Ignition Oven Testing of Virgin Asphalt Mixture versus RAP Asphalt Mixture | X | X | X | X | ||
| Performance Testing of RAM Asphalt Mixtures at Different RBA Conditions | X | X | X | X | X | X |
| Photography Evaluation of Post-ignition RAP Aggregate with Virgin Binder | X | |||||
| Sieve Analysis of RAP versus Recovered RAP Aggregate | X | |||||
| Staged Solvent Extraction of Loose Mixture Particles of RAP Asphalt Mixture | X | X | X | X | X | |
| Use of Artificial Glass Beads in Virgin Aggregate as a Tracer for Extracted Binder Testing | X | X | X | X | X | X |
| Use of Titanium Dioxide in Virgin Binder as a Tracer for EDS SEM Analysis | X | X | X | X | X | X |
| Volumetric Analysis of Companion RAP Asphalt Mixtures | X | X | X | X | X | |
| Volumetric Analysis of Virgin versus RAM Asphalt Mixtures | X | X | X | X | X | X |
2.2.2 Evaluation of Candidate RBA Methods using LP-RAP Asphalt Mixtures
The two selected candidate RBA methods underwent proof-of-concept evaluations using asphalt mixtures containing LP-RAP samples, following the approach illustrated in Figure 9. LP-RAP was chosen instead of field RAP to isolate binder stiffness as the primary variable for RBA testing, eliminating potential confounding effects from RAP binder content and aggregate gradation. Three LP-RAP samples were prepared under different aging conditions and incorporated into a 40% RAP mix design. The resulting mixtures were tested for RBA using the Performance Testing and Glass Beads methods. Additionally, the LP-RAP samples were characterized through PG grading, sieve analysis, Indirect Tensile (IDT) testing, and Dongre Workability Test (DWT). The results were analyzed to guide the selection and refinement of one RBA method for further evaluation using asphalt mixtures containing field RAM.

2.2.2.1 Preparation and Characterization of LP-RAP Samples
Three LP-RAP samples with distinct aging conditions were prepared in the laboratory using a PG 64-22 asphalt binder and low-absorptive granite aggregates from Georgia. The binder content (5.0%) and gradation of LP-RAP were selected to replicate a field RAP sample from Georgia. After mixing the virgin binder and aggregate, the loose mixture was subjected to short-term aging (STA) for two hours at 135°C per AASHTO R 30, additional long-term aging (LTA) for two weeks at 95°C, and extended long-term aging (ELTA) for four weeks at 95°C per AASHTO R 121 (Method C). These aging procedures were applied to achieve a wide range of binder stiffness. The resulting loose mixes were evaluated as LP-RAP samples for quality characterization and used to prepare LP-RAP asphalt mixtures with 40% RAP content for RBA testing. It is important to note that, although LP-RAP was prepared with representative binder content, binder stiffness, and
gradation, it did not fully replicate field RAP due to differences in particle agglomeration and the absence of uncoated aggregate particles typical from pavement milling.
Characterization of LP-RAP samples focused on properties expected to influence the RBA of resulting asphalt mixtures. The evaluation included PG grading to determine extracted binder stiffness, sieve analysis to assess particle agglomeration, Indirect Tensile (IDT) testing to evaluate binder activation, and Dongre Workability Test (DWT) to assess material workability. Additional details on each test are provided as follows:
- For binder PG grading, LP-RAP samples were subjected to solvent extraction per AASHTO T 164 (Method A, using TCE) and recovery per ASTM D5404. The recovered binder was subsequently tested using DSR (AASHTO T 315) and Bending Beam Rheometer (BBR, AASHTO T 313) for PG grading per AASHTO M 320.
- Sieve analysis was conducted to assess particle agglomeration in LP-RAP samples, following the procedure recommended by Pape and Castorena (2022a, 2022b, 2022c) and Castorena et al. (2024). This method involved determining two gradations: ‘black curve’ gradation and ‘white curve’ gradation. The ‘black curve’ gradation was measured after washing and drying the LP-RAP sample, whereas the ‘white curve’ gradation was obtained after subjecting the LP-RAP sample to ignition to remove asphalt binder followed by measuring aggregate gradation. These gradations, together with the binder content and effective specific gravity (Gse) of the LP-RAP sample, were used to calculate the ‘RAP binder availability’ as the ratio of available mastic volume to total mastic volume, as previously described for the Sieve Analysis of RAP versus Recovered RAP Aggregate method. Finally, the degree of agglomeration was reported as 100% minus the ‘RAP binder availability’ value.
- The IDT test was conducted following RILEM recommendations to assess the degree of binder activation (Mengusso Pires et al., 2021). The procedure included conditioning LP-RAP samples in an oven for four hours at 140°C and 170°C, compacting the conditioned samples using a Superpave Gyratory Compactor (SGC) to a height of 63.5 ± 1.3 mm with 30 gyrations, and testing the compacted specimens for dry IDT strength at 25°C. A higher IDT strength indicates potentially better binder activation at the specified conditioning temperature.
- The DWT test was conducted following the procedure by Dongre et al. (2013) to evaluate the workability of LP-RAP samples. The procedure involved conditioning LP-RAP in an oven for two hours at 140°C and 170°C, then compacting it in an SGC by applying force without gyrating at a constant load rate of 0.05 mm/second until a stress of 700 kPa was reached. Volumetric strain and corresponding stress data were recorded during compaction and used to calculate the DWT-value as the slope of the stress-strain curve at 600 kPa. A higher DWT-value indicates better workability.
2.2.2.2 Preparation of LP-RAP Asphalt Mixtures
LP-RAP asphalt mixtures were prepared using a 40% RAP mix design from Georgia by substituting the field RAP with LP-RAP samples under various aging conditions. The mix design was a Superpave surface mixture containing granite aggregates, hydrated lime, and a PG 64-22 unmodified binder. The nominal maximum aggregate size was 12.5 mm. The total binder content was 5.0%, with 3.0% provided by virgin binder and 2.0% by RAP binder, corresponding to an
RBR of 0.40. The mix design had 4.0% air voids, 16.0% voids in mineral aggregate (VMA), and 75.0% voids filled with asphalt (VFA) at 65 gyrations.
2.2.2.3 RBA Testing of LP-RAP Asphalt Mixtures
LP-RAP asphalt mixtures were tested for RBA at two laboratories using both the Performance Testing and Glass Beads methods.
Performance Testing Method
For the Performance Testing method, LP-RAP asphalt mixtures at 0% RBA, 50% RBA, 100% RBA, and Actual RBA conditions were prepared for each LP-RAP sample after STA, LTA, or ELTA condition.
- The ‘0% RBA’ mixture was prepared by mixing virgin aggregate and post-ignition LP-RAP aggregate with 3.0% virgin binder.
- The ‘50% RBA’ mixture was prepared by mixing virgin aggregate and post-ignition LP-RAP aggregate with 3.0% virgin binder and 1.0% extracted LP-RAP binder (half of the RAP binder in the mix design).
- The ‘100% RBA’ mixture was prepared by mixing virgin aggregate and post-ignition LP-RAP aggregate with 3.0% virgin binder and 2.0% extracted LP-RAP binder.
- The ‘Actual RBA’ mixture was prepared by mixing virgin aggregate and as-prepared LP-RAP (including both the aggregate and binder) with 3.0% virgin binder.
After mixing, each mixture was conditioned for two hours at 135°C per AASHTO R 30, then compacted and tested using IDEAL-CT per ASTM D8225 to evaluate intermediate-temperature cracking resistance and the Indirect Tensile Asphalt Rutting Test (IDEAL-RT) per ASTM D8360 to evaluate rutting resistance. All mixtures contained the same amount of virgin binder but varied in the amount of the activated LP-RAP binder. These differences were expected to result in distinct IDEAL-CT or IDEAL-RT results, enabling the determination of RBA for the ‘Actual RBA’ mixture following the approach illustrated in Figure 10.

Due to the low binder content, the ‘0% RBA’ mixture could not be compacted to a height of 62 mm with 7.0% (± 0.5%) air voids for IDEAL-CT and IDEAL-RT testing. Despite multiple trial weight efforts, the lowest achievable air voids were 11.0% at over 250 gyrations. Further compaction was not attempted due to concerns about potential aggregate breakdown. Because of this issue, testing of the ‘0% RBA’ mixture was excluded from the Performance Testing method.
Glass Beads Method
For the Glass Beads method, 2% glass beads (by weight of the mixture) were added as tracers for virgin aggregate during preparation of LP-RAP asphalt mixtures. The glass beads were preblended with virgin aggregate, then dry-mixed with LP-RAP before mixing with the virgin binder. After mixing, the glass beads were collected from the loose mixture, and solvent extraction and recovery were performed to obtain the asphalt binder coating their surfaces. RBA determination was based on three binders: virgin binder, extracted LP-RAP binder, and binder extracted from the glass beads. The unaged PGH was selected over other binder rheological or chemical parameters for several reasons: (1) it enables RBA estimation through linear interpolation between 0% and 100% RBA; (2) it eliminates the need for additional aging in the Rolling Thin Film Oven (RTFO, AASHTO T 240) and Pressure Aging Vessel (PAV, AASHTO R 28), which is impractical for the extracted binder from glass beads due to limited material availability; and (3) it can effectively differentiate virgin binder from RAM binder.
For RBA calculation, the PGH of the virgin binder and the extracted LP-RAP binder were first measured. These values were then used to estimate the PGH of a fully blended virgin-RAP binder based on the RBR of the mixture, following a linear blending chart analysis in accordance with AASHTO M 323. Subsequently, the PGH of asphalt binder extracted and recovered from the glass beads was determined and compared against those of the virgin binder and the estimated fully blended virgin-RAP binder. If no RAP binder was activated within the mixture, the extracted binder from glass beads would consist solely of virgin binder, representing a 0% RBA condition. If all RAP binder was activated, the extracted binder from glass beads would match the estimated fully blended virgin-RAP binder, representing a 100% RBA condition. Should only a portion of the RAP binder be activated, the extracted binder from glass beads would exhibit a PGH value between these two extremes. Figure 11 illustrates the Glass Beads method for determining the RBA by interpolating the PGH differences among the virgin binder, extracted binder from glass beads, and the estimated fully blended virgin-RAP binder.

2.2.2.4 Selection and Refinement of One RBA Method
RBA results from the Performance Testing and Glass Beads methods were analyzed to evaluate their sensitivity to LP-RAP aging conditions and compare reproducibility across two laboratories. Based on this analysis, the Glass Beads method was selected and refined with procedural improvements for RBA testing of asphalt mixtures incorporating field RAM.
2.3 RBA Sensitivity Evaluation
Using the refined Glass Beads method, the RBA of 25 field RAM asphalt mixtures was determined to assess sensitivity to RAM types, sources, and contents, as well as common mix design and production variables. As illustrated in Figure 12, this evaluation included material selection, volumetric mix design development, and RBA testing through three complementary experiments: Experiment 1 assessed the impacts of RAM type, source, and content; and Experiments 2 and 3 evaluated the sensitivity of two high-RAM mix designs to selected mix design and production variables, including virgin binder grade and source, virgin aggregate type, the addition of RA, mixing temperature, and laboratory simulation of silo storage.

2.3.1 Material Selection and Mix Design Development
The RBA sensitivity evaluation included 25 field RAM asphalt mixtures prepared with 11 mix designs, four virgin binders, one bio-based RA, and one WMA chemical additive. The mix designs incorporated two virgin aggregates: low-absorptive granite (GRN) from Georgia and high-absorptive limestone (LMS) from Florida; four RAP sources: Wisconsin (WI), Delaware (DE), Georgia (GA), and California (CA); and two RAS sources: WI and Alabama (AL).
Of the 11 mix designs, two used 25% RAP, four used 40% RAP, two used 4% or 5% RAS, and one used 20% RAP and 3% RAS, as shown in Table 2. The four virgin binders included two PG 64-22 binders, one PG 58-28 binder, and one PG 76-22 polymer-modified asphalt (PMA) binder using styrene-butadiene-styrene (SBS). SBS was selected for the PMA binder over rubber or other polymers due to its widespread use among state DOTs. The two PG 64-22 binders, despite sharing the same PG designation according to AASHTO M 320, originated from different sources and exhibited distinct low-temperature relaxation properties, as indicated by a 5.0°C difference in ΔTc.
Table 2. Mixture Component Combinations for Field RAM Mix Designs
| Mix Design ID | RAM Content and Type | RAP Source | RAS Source | Virgin Aggregate |
|---|---|---|---|---|
| 25% WI RAP_GRN | 25% RAP | WI | - | GRN |
| 25% GA RAP_GRN | 25% RAP | GA | - | GRN |
| 40% WI RAP_GRN | 40% RAP | WI | - | GRN |
| 40% DE RAP_GRN | 40% RAP | DE | - | GRN |
| 40% GA RAP_GRN | 40% RAP | GA | - | GRN |
| 40% GA RAP_LMS | 40% RAP | GA | - | LMS |
| 40% CA RAP_GRN | 40% RAP | CA | - | GRN |
| 4% WI RAS_GRN | 4% RAS | - | WI | GRN |
| 5% AL RAS_GRN | 5% RAS | - | AL | GRN |
| 20% WI RAP, 3% WI RAS_GRN | 20% RAP, 3% RAS | WI | WI | GRN |
| 20% WI RAP, 3% WI RAS_LMS | 20% RAP, 3% RAS | WI | WI | LMS |
2.3.2 Field RAM Characterization
Field RAM characterization included determining aggregate gradation, binder content, and PG grading of extracted and recovered binder, and conducting the DWT and sieve analysis, as summarized in Table 3. The DWT and sieve analysis were selected based on promising results from LP-RAP evaluation and were performed using the same procedures discussed previously.
Table 3. Field RAM Characterization
| Property Evaluated | Test Method | Test Output Parameter | Test Standard or Reference |
|---|---|---|---|
| Aggregate Gradation | Sieve Analysis | Gradation | AASHTO T 30 |
| Binder Content | Solvent Extraction | Binder Content (%) | AASHTO T 164 |
| Ignition Furnace | Binder Content (%) | AASHTO T 308 | |
| Extracted Binder PG | Superpave PG | PGH, PGI, PGL (°C) | AASHTO M 320 |
| Particle Agglomeration | Sieve Analysis | Degree of Agglomeration (%) | Pape and Castorena (2022a, 2022b, 2022c), Castorena et al. (2024) |
| Workability | DWT | DWT-value (kPa) | Dongre et al. (2021) |
2.3.3 RBA Testing of Field RAM Asphalt Mixtures
RBA testing of field RAM asphalt mixtures was conducted using the refined Glass Beads method. These mixtures were organized into three experiments, summarized in Table 4 through Table 6 and as follows:
- Experiment 1 included nine mixtures prepared with different mix designs and RAM sources but using the same virgin aggregate and virgin binder.
- Experiment 2 focused on evaluating RBA sensitivity to mix design variables (i.e., virgin binder type, use of RA, and virgin aggregate type). It included 12 high-RAM asphalt mixtures prepared with two GRN-based mix designs, two LMS-based mix designs, and five virgin binders from different sources and with various PG grades, including one modified with a bio-based RA.
- Experiment 3 focused on evaluating RBA sensitivity to production variables. It included eight high-RAM asphalt mixtures prepared with two mix designs and subjected to four combinations of production temperature (i.e., reduced through addition of a WMA chemical additive, standard, and elevated temperature) and laboratory simulation of silo storage.
Table 4. Field RAM Asphalt Mixtures for RBA Sensitivity Evaluation (Experiment 1)
| Mix Design ID | Virgin Binder | Production Temperature | Simulated Silo Storage |
|---|---|---|---|
| 25% WI RAP_GRN | PG 64-22 (Source A) | Standard | No |
| 25% GA RAP_GRN | PG 64-22 (Source A) | Standard | No |
| 40% WI RAP_GRN | PG 64-22 (Source A) | Standard | No |
| 40% DE RAP_GRN | PG 64-22 (Source A) | Standard | No |
| 40% GA RAP_GRN | PG 64-22 (Source A) | Standard | No |
| 40% CA RAP_GRN | PG 64-22 (Source A) | Standard | No |
| 4% WI RAS_GRN | PG 64-22 (Source A) | Standard | No |
| 5% AL RAS_GRN | PG 64-22 (Source A) | Standard | No |
| 20% WI RAP, 3% WI RAS_GRN | PG 64-22 (Source A) | Standard | No |
Table 5. Field RAM Asphalt Mixtures for RBA Sensitivity Evaluation (Experiment 2)
| Mix Design ID | Virgin Binder | Production Temperature | Simulated Silo Storage |
|---|---|---|---|
| 40% GA RAP_GRN | PG 64-22 (Source A) | Standard | No |
| PG 64-22 (Source B) | Standard | No | |
| PG 58-28 | Standard | No | |
| PG 76-22 PMA | Standard | No | |
| PG 64-22 (Source A) + RA | Standard | No | |
| 40% GA RAP_LMS | PG 64-22 (Source A) | Standard | No |
| 20% WI RAP, 3% WI RAS_GRN | PG 64-22 (Source A) | Standard | No |
| PG 64-22 (Source B) | Standard | No | |
| PG 58-28 | Standard | No | |
| PG 76-22 PMA | Standard | No | |
| PG 64-22 (Source A) + RA | Standard | No | |
| 20% WI RAP, 3% WI RAS_LMS | PG 64-22 (Source A) | Standard | No |
Table 6. Field RAM Asphalt Mixtures for RBA Sensitivity Evaluation (Experiment 3)
| Mix Design ID | Virgin Binder | Production Temperature | Simulated Silo Storage |
|---|---|---|---|
| 40% GA RAP_GRN | PG 64-22 (Source A) | Standard | No |
| Elevated | No | ||
| Reduced (WMA) | No | ||
| Standard | Yes | ||
| 20% WI RAP, 3% WI RAS_GRN | PG 64-22 (Source A) | Standard | No |
| Elevated | No | ||
| Reduced (WMA) | No | ||
| Standard | Yes |
2.4 RBA Impact Analysis
The impact of RBA on the performance and cost of asphalt mixtures containing high RAM contents was evaluated using the approach illustrated in Figure 13. This evaluation featured four high-RAM asphalt mixtures prepared with two mix designs and two virgin binders per design. Each mixture was first tested using the refined Glass Beads method to determine its RBA. These results were then used to determine the RBA-adjusted optimum binder content (A-OBC) for comparison with the volumetric optimum binder content (V-OBC) in volumetric and performance testing. Volumetric testing included determination of air voids, VMA, VFA, and the dust-to-asphalt (D/P) ratio. Performance testing comprised index-based rutting and cracking evaluation using HWTT and IDEAL-CT, respectively, and Asphalt Mixture Performance Tester (AMPT)based stiffness and fatigue characterization using the E* and Direct Tension Cyclic Fatigue (DTCF) tests. Additionally, FlexPAVE simulations were conducted to assess the influence of RBA on predicted pavement cracking performance. Finally, cost analyses were conducted to quantify the effect of RBA on material costs and project life-cycle costs for the selected high-RAM asphalt mixtures.

2.4.1 Materials and Mix Designs
The RBA impact analysis included two DOT-approved volumetric mix designs with high RAM contents to represent distinct climate conditions. One design was sourced from Georgia and used 40% RAP with an RBR of 0.40. The other design was sourced from Wisconsin and used 16% RAP and 4% RAS with an RBR of 0.31, including 0.14 from RAP and 0.17 from RAS. Table 7 summarizes the job mix formula for both mix designs. Each mix design was evaluated with two virgin binders: one unmodified binder and one PMA binder with SBS. SBS was selected over rubber or other polymers due to its widespread use among state DOTs. For the Georgia high-RAP mix design, the binders were PG 64-22 and PG 76-22, whereas for the Wisconsin high-RAP/RAS mix design, the binders were PG 58S-28 and PG 58V-28. Additionally, the Georgia high-RAP mix design included 0.5% hydrated lime by aggregate weight, and the Wisconsin high-RAP/RAS mix design incorporated 0.4% WMA additive by total binder weight.
Table 7. High-RAM Mix Design Summary
| Properties | Georgia High-RAP Mix Design | Wisconsin High-RAP/RAS Mix Design | |
|---|---|---|---|
| Aggregate Gradation (Sieve Size) | 19 mm | 100 | 100 |
| 12.5 mm | 98 | 95 | |
| 9.5 mm | 88 | 89 | |
| 4.75 mm | 59 | 75 | |
| 2.36 mm | 45 | 58 | |
| 1.18 mm | 36 | 43 | |
| 0.6 mm | 28 | 31 | |
| 0.3 mm | 21 | 16 | |
| 0.15 mm | 13 | 7 | |
| 0.075 mm | 6.7 | 4.7 | |
| Design Gyration | 65 | 75 | |
| Binder Content (%) | 4.85 | 5.30 | |
| RBR (Total) | 0.40 | 0.31 | |
| RBR (RAP) | 0.40 | 0.14 | |
| RBR (RAS) | — | 0.17 | |
| Air Voids (%) | 4.0 | 4.0 | |
| VMA (%) | 15.3 | 15.0 | |
| VFA (%) | 73.9 | 73.2 | |
2.4.2 RBA Testing and Volumetric Analysis
The RBA of each mixture was determined using the refined Glass Beads method. The result was then applied to adjust the mixture’s OBC using Georgia DOT’s COAC method (GDOT, 2025). A-OBC was calculated based on V-OBC, RAM binder content of the mixture (ACRAM), and the RBA value, as shown in Equation 11. Volumetric analysis was subsequently conducted to compare air voids, VMA, VFA, and D/P ratio at A-OBC versus V-OBC.
| Equation 11 |
2.4.3 Mixture Performance Testing
Performance testing of high-RAM asphalt mixtures at A-OBC versus V-OBC included index-based HWTT and IDEAL-CT for rutting and cracking evaluation, respectively, as well as AMPT-based E* and DTCF tests for stiffness and fatigue characterization, respectively (Table 8). HWTT and IDEAL-CT were chosen based on their ranking as the most preferred performance tests for asphalt mixture evaluation in the state DOT survey discussed previously. Additional details for each test are provided as follows:
- The HWTT (AASHTO T 324) was conducted to assess rutting resistance. It involved applying repeated wheel loading to submerged asphalt mixture specimens at an elevated temperature and measuring the rut depth throughout the test. The test temperature was set at 50°C for Georgia high-RAP mixtures and 45°C for Wisconsin high-RAP/RAS mixtures, replicating the typical high-temperature field conditions in each climatic region. Two
- replicates were tested, each consisting of a pair of cylindrical specimens (150 mm diameter and 62 mm height) with 7.0% ± 0.5% air voids. Lower rut depths are desired for better rutting resistance.
- The IDEAL-CT (ASTM D8225) was conducted at 25°C to evaluate intermediate-temperature cracking resistance. The test involved applying a monotonic indirect tensile load to cylindrical specimens (150 mm diameter and 62 mm height) with 7.0% ± 0.5% air voids until failure occurred. A minimum of three replicates were tested for each mixture. The test parameter is the CTIndex (Equation 12), where higher values indicate better cracking resistance.
Equation 12 Where Gf is fracture energy; t is specimen thickness; l75 is the displacement at 75% of peak load; D is specimen diameter; and m75 is the post-peak slope at 75% of peak load.
- The E* test (AASHTO TP 132) was conducted using the AMPT to characterize mixture stiffness and viscoelastic behavior. The test was performed across various temperatures and loading frequencies to simulate varying field conditions. Specifically, the Georgia high-RAP asphalt mixtures were tested at 4°C, 20°C, and 40°C, while the Wisconsin high-RAP/RAS asphalt mixtures were tested at 4°C, 20°C, and 35°C. Frequencies at each temperature ranged from 0.1 Hz to 25 Hz, allowing the development of master curves that characterize the variation in mixture stiffness as a function of loading rate and temperature. Typically, higher |E*| values suggest increased resistance to rutting at elevated temperatures, while higher values at colder temperatures may signal decreased resistance to cracking due to excessive stiffness. A minimum of three replicates were tested for each mixture.
- The DTCF test (AASHTO TP 133) was also conducted using the AMPT to evaluate fatigue resistance under repetitive loading. The test protocol includes two phases: an E* fingerprint and a direct tension cyclic fatigue loading phase. The E* fingerprint test is performed first at a single temperature and 10 Hz frequency, using a non-damaging strain amplitude (50 to 75 µm) to establish baseline pseudo stiffness. The fatigue loading phase is then carried out in displacement-controlled mode at 10 Hz, with the on-specimen strain gradually increasing as damage accumulates. The test temperature was selected based on the binder grade and the climatic region associated with the mix design. The selected temperatures were 21°C for PG 76-22 and 18°C for PG 64-22 in the Georgia high-RAP asphalt mixtures, and 15°C for PG 58V-28 and 12°C for PG 58S-28 in the Wisconsin high-RAP/RAS asphalt mixtures. A minimum of three replicates were tested for each mixture.
Fatigue resistance was assessed using two index parameters: failure criterion (DR) and damage capacity index (Sapp). DR represents the average reduction of material integrity until failure on a damage characteristic curve, which is referred to as the C-versus-S curve (Etheridge et al., 2019). Sapp is determined based on DR, average pseudo stiffness (Cavg), and C-versus-S curve parameters, according to Equation 13. Sapp accounts for the effect of the mixture’s modulus and toughness on fatigue resistance (FHWA, 2019). Higher DR and Sapp values indicate better fatigue damage resistance.
Equation 13 Where αT represents the time–temperature shift factor computed at the reference temperature; C11 and C12 are power-law coefficients used to fit the damage characteristic curve; α is the damage growth rate in the governing evolution law; ∣E∗∣ is the dynamic modulus measured at 10 Hz and the test temperature; and DR denotes the average reduction in pseudo stiffness up to failure.
Table 8. Mixture Performance Testing for RBA Impact Analysis
| Mix Design ID | Virgin Binder | Aging Condition | Test Method | Test Temperature |
|---|---|---|---|---|
| Georgia High-RAP | PG 64-22 | STA (2h@135°C) | HWTT | 50°C |
| STA + LTA (7h@135°C) | IDEAL-CT | 25°C | ||
| E* | 4, 20, 40°C | |||
| DTCF | 18°C | |||
| PG 76-22 PMA | STA (2h@135°C) | HWTT | 50°C | |
| STA + LTA (5d@95°C) | IDEAL-CT | 25°C | ||
| E* | 4, 20, 40°C | |||
| DTCF | 21°C | |||
| Wisconsin High-RAP/RAS | PG 58S-28 | STA (2h@135°C) | HWTT | 45°C |
| STA + LTA (6h@135°C) | IDEAL-CT | 25°C | ||
| E* | 4, 20, 35°C | |||
| DTCF | 12°C | |||
| PG 58V-28 PMA | STA (2h@135°C) | HWTT | 45°C | |
| STA + LTA (3d@95°C) | IDEAL-CT | 25°C | ||
| E* | 4, 20, 35°C | |||
| DTCF | 15°C |
Following recommendations in AASHTO PP 127, HWTT was conducted under a STA condition of two hours at 135°C per AASHTO R 30. IDEAL-CT, E*, and DTCF tests were conducted under additional LTA conditions to account for the impact of aging on cracking and fatigue resistance. The LTA procedures were selected to represent a critical field aging condition for surface cracking evaluation, which varied depending on the mix design source and virgin binder type (Chen et al., 2018 and 2020; Epps Martin et al., 2024). Georgia high-RAP mixtures with PG 64-22 binder were aged for seven hours at 135°C, adapted slightly from AASHTO R 121, Method E due to workflow constraints, while those with PG 76-22 binder were aged for five days at 95°C following AASHTO R 121, Method C. Wisconsin high-RAP/RAS mixtures using PG 58S-28 binder were aged for six hours at 135°C (AASHTO R 121, Method E), and those with PG 58V-28 binder were aged for three days at 95°C (AASHTO R 121, Method C). For mixtures containing PMA binders, 95°C aging was used instead of 135°C to avoid potential thermal degradation of polymers at elevated temperatures. Despite these variations, each mixture underwent performance testing at both V-OBC and A-OBC under consistent aging conditions, enabling a rigorous evaluation of RBA impact.
2.4.4 FlexPAVE Simulation
FlexPAVE™ Version 2.2 was used to simulate fatigue cracking performance of asphalt pavements using high-RAM asphalt mixtures at V-OBC and A-OBC. FlexPAVE is a Microsoft® Excel-based analysis tool that applies the Fourier-Finite Element method to model three-dimensional viscoelastic pavement responses and associated damage evolution under specified traffic and climate conditions (FHWA, 2025). It accounts for asphalt aging, repeated traffic loading, and temperature effects using environmental data from the Enhanced Climatic Model. Although the software can also simulate rutting, this project focused solely on fatigue cracking performance simulations. Fatigue damage was computed using the simplified viscoelastic continuum damage model embedded in the software. The simulation incorporated three key modeling components obtained from AMPT testing: (1) |E*|, (2) damage characteristic curve (C-versus-S), and (3) DR. These inputs were used to predict pavement fatigue cracking performance under realistic loading and environmental conditions.
FlexPAVE simulations were conducted for a hypothetical new construction project, using selected inputs from Table 9 and Figure 14. The simulation results were categorized as Total Fatigue Damage, Top Fatigue Damage, and Bottom Fatigue Damage. Total Fatigue Damage refers to the fatigue damage across the entire reference cross-sectional area of the pavement, and Top Fatigue Damage and Bottom Damage represent the fatigue damage in the top one-third portion and bottom two-thirds of the cross section, respectively.
Table 9. FlexPAVE Simulation Inputs
| FlexPAVE Input | Value |
|---|---|
| Design Life | 20 years |
| Pavement Structure | Three Layers |
| Location | Columbus, GA (for Georgia high-RAP mixtures) Milwaukee, WI (for Wisconsin high-RAP/RAS mixtures) |
| Axel Load Repetitions per day | 2055 |
| Design Traffic | 15 million ESALs |
| Axle Load | 80 kN |
| Tire Pressure | 689.5 kPa |
| Velocity | 75 km/h |

2.4.5 Cost Analysis
Two analyses were conducted to assess the cost impact of RBA. The first analysis compared the material costs of high-RAM asphalt mixtures at A-OBC versus V-OBC, as well as their costs relative to corresponding virgin asphalt mixtures and those containing 25% RAP at 100% RBA. For this comparison, the cost of individual component materials was obtained from a single asphalt contractor for each high-RAM mix design, as summarized in Table 10.
Table 10. Costs of Individual Component Materials for High-RAM Asphalt Mixtures
| Component Materials | Georgia High-RAP Mix Design | Wisconsin High-RAP/RAS Mix Design |
|---|---|---|
| Virgin Aggregate | $38.6 per metric ton | $19.8 per metric ton |
| RAP | $16.5 per metric ton | $13.2 per metric ton |
| RAS | — | $44.1 per metric ton |
| Virgin Binder (PG 64-22 Unmodified) | $661.4 per metric ton | — |
| Virgin Binder (PG 76-22 PMA) | $826.7 per metric ton | — |
| Virgin Binder (PG 58S-28 Unmodified) | — | $716.5 per metric ton |
| Virgin Binder (PG 58V-28 PMA) | — | $937.0 per metric ton |
The second analysis evaluated the life-cycle cost of high-RAM asphalt mixtures at A-OBC and V-OBC, considering both material costs and potential differences in pavement life. Figure 15 illustrates the life-cycle cost analysis (LCCA) framework for asphalt resurfacing projects. This analysis aimed to identify the minimum life extension required to offset the increased material costs associated with using more virgin binder at a reduced RBA level compared to 100% RBA. An overlay thickness of 6.35 cm was assumed for all LCCA scenarios. The bid price for each mixture was estimated as twice the material cost. Georgia high-RAP mixtures were analyzed using a 40-year analysis period and a 3% discount rate in accordance with Georgia DOT’s LCCA guidelines (Georgia DOT, 2019). Wisconsin high-RAP/RAS mixtures were analyzed over a 50-year period and with a 5% discount rate following Wisconsin DOT’s LCCA guidelines (Wisconsin DOT, 2021). Each mixture underwent iterative LCCA simulations with an assumed overlay life varying from 10 to 20 years in two-year increments.


