Recycled Asphalt Materials: Binder Availability and Its Impact on Mix Performance (2026)
Chapter: 3 Findings and Applications
CHAPTER 3 FINDINGS AND APPLICATIONS
3.1 RBA Method Selection Findings
This section presents the results and findings from evaluating the two selected candidate RBA methods—the Performance Testing and Glass Beads methods—using asphalt mixtures containing LP-RAP samples, along with refinements to the Glass Beads method procedure for subsequent RBA testing of field RAM asphalt mixtures.
3.1.1 LP-RAP Sample Characterization Results
The asphalt binder extracted and recovered from the STA LP-RAP sample was graded as PG 76-16, while binders from the LTA and ELTA LP-RAP samples were graded as PG 106+14 and PG 124-xx, respectively. The low-temperature grade for the ELTA LP-RAP sample could not be determined due to excessive binder stiffness during BBR testing. Nevertheless, these results confirmed the expected increase in LP-RAP binder stiffness with laboratory aging.
Figure 16 presents the sieve analysis results for LP-RAP samples under various aging conditions. The columns represent the average degree of agglomeration, while the error bars denote one standard deviation based on two replicates. The average degree of agglomeration decreased as the aging condition increased from STA to LTA and then ELTA, indicating a reduced incidence of aggregate particle agglomeration. However, it is important to note that the sieve analysis was originally developed for field RAP samples, and its applicability to LP-RAP samples remains unknown.

Figure 17 presents the IDT test results for LP-RAP samples under various aging conditions. The columns represent the average IDT strength, and the error bars denote one standard deviation based on six replicates per conditioning temperature. When conditioned at 140°C, the LTA samples exhibited the highest IDT strength, followed by the STA and ELTA samples. At the higher conditioning temperature of 170°C, the IDT strength decreased progressively from STA to LTA and ELTA, indicating a potential reduction in binder availability due to aging.

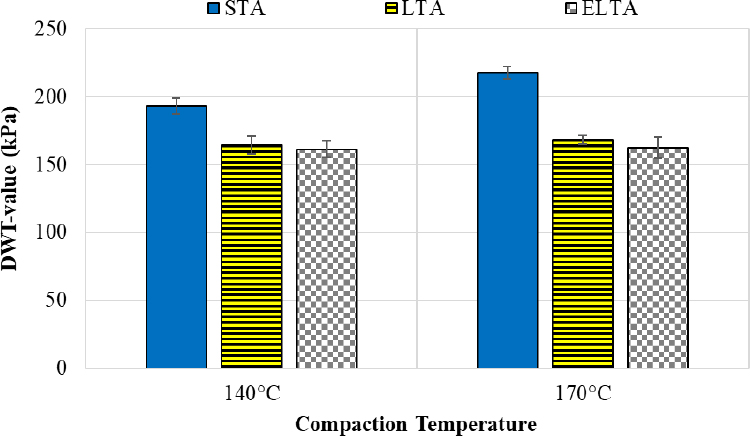
Figure 18 presents the DWT results, where the columns represent the average DWT-value and the error bars represent one standard deviation based on three replicates per compaction temperature. At both temperatures, the DWT-value decreased as the aging condition increased from STA to LTA, indicating reduced workability due to increased viscosity and possibly reduced activation of the RAP binder. However, further aging from LTA to ELTA did not significantly affect the DWT results.
Overall, LP-RAP samples under various aging conditions exhibited notable differences in binder stiffness, particle agglomeration, binder activation, and workability. These variations were expected to result in different RBA values among the resulting mixtures prepared using a 40% RAP mix design.
3.1.2 LP-RAP Asphalt Mixture RBA Results
3.1.2.1 Performance Testing Method
Figure 19 and Figure 20 present the IDEAL-CT and IDEAL-RT results, respectively, for LP-RAP asphalt mixtures under three RBA conditions: 50% RBA, 100% RBA, and Actual RBA. The columns in these figures represent the average cracking tolerance index (CTIndex) and rutting tolerance index (RTIndex), while the error bars indicate one standard deviation based on a minimum of three replicates. The letters (A, B, and C) denote statistical groupings based on the Games-Howell test at a 95% confidence level, where mixtures sharing the same letters have statistically comparable results considering data variability. Separate grouping analyses were performed for mixtures containing the same LP-RAP samples, with distinct notations for each aging condition (e.g., A for STA, A’ for LTA, and A” for ELTA). The ‘Actual RBA’ mixture at the LTA condition was not tested in IDEAL-RT in Laboratory 2 because the ‘50% RBA’ and ‘100% RBA’ mixtures exhibited nearly identical RTIndex, making RBA determination infeasible using the proposed approach in Figure 10.
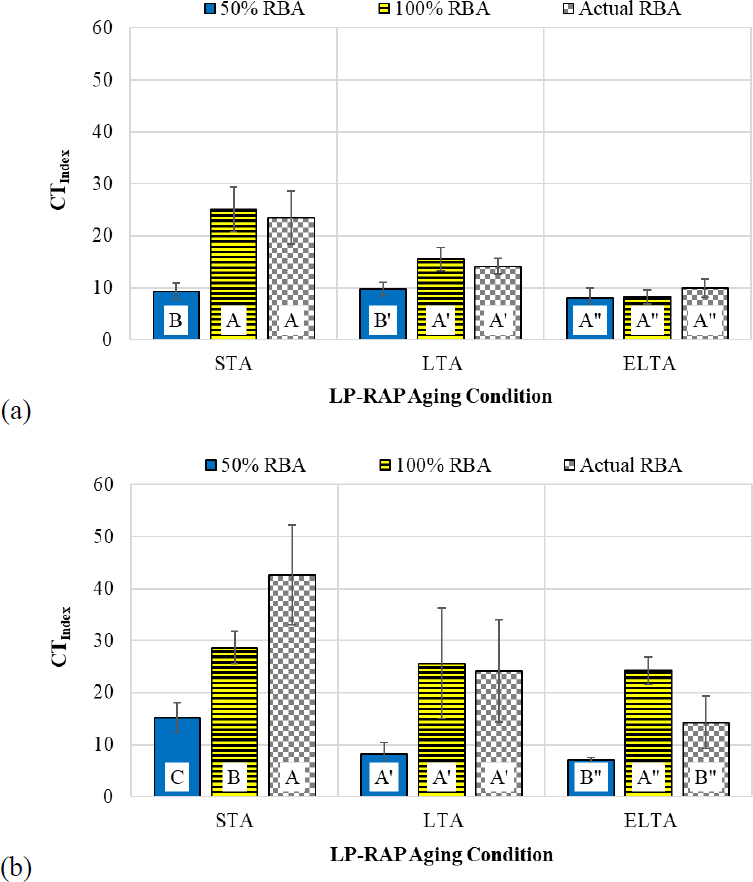

Except for the ELTA condition from Laboratory 1, all ‘100% RBA’ mixtures showed higher average CTIndex values and lower average RTIndex values than the corresponding ‘50% RBA’ mixtures. This indicates improved cracking resistance but reduced rutting resistance due to the inclusion of 1.0% additional fully activated LP-RAP binder obtained through solvent extraction and recovery. However, some comparisons did not reveal statistically significant differences, as indicated by identical grouping letters. The comparison of test results between the ‘Actual RBA’ mixture versus the ‘50% RBA’ or ‘100% RBA’ mixtures varied across the different LP-RAP aging conditions and between the two laboratories.
To obtain a reliable RBA value for the Performance Testing method, two criteria must be satisfied for the IDEAL-CT and IDEAL-RT results to apply the proposed approach in Figure 10: (1) the results for ‘50% RBA’ and ‘100% RBA’ mixtures must be statistically different, and (2) the results for ‘Actual RBA’ mixture must fall between those of ‘50% RBA’ and ‘100% RBA’ mixtures. For IDEAL-CT (Figure 19), the STA and LTA mixtures from Laboratory 1 and the ELTA mixtures from Laboratory 2 satisfied these criteria. For IDEAL-RT (Figure 20), only the ELTA mixture from Laboratory 2 met the criteria. The RBA results for these mixtures are
summarized in Table 11. For the remaining mixtures, RBA could not be determined because their IDEAL-CT or IDEAL-RT results at various RBA conditions failed to meet at least one criterion. Overall, the Performance Testing method failed to determine the RBA for most LP-RAP asphalt mixtures, showed poor reproducibility across the two laboratories, and could not distinguish asphalt mixtures with LP-RAP samples produced under different aging conditions. Because of these limitations, the Performance Testing method was excluded from further consideration for determining RBA of field RAM asphalt mixtures.
Table 11. RBA Results of LP-RAP Asphalt Mixtures for Performance Testing Method
| LP-RAP Aging Condition | IDEAL-CT | IDEAL-RT | ||
|---|---|---|---|---|
| Laboratory 1 | Laboratory 2 | Laboratory 1 | Laboratory 2 | |
| STA | 95% | n/a | n/a | n/a |
| LTA | 88% | n/a | n/a | n/a |
| ELTA | n/a | 71% | n/a | 63% |
n/a = RBA value could not be determined.
3.1.2.2 Glass Beads Method
Table 12 summarizes the PGH results for LP-RAP asphalt mixtures tested using the Glass Beads method, based on a single measurement without replicates. Under LTA and ELTA conditions, the PGH of the extracted binder from glass beads fell between the virgin binder and the estimated fully blended virgin-RAP binder, indicating partial activation of the RAP binder within the mixture. However, under the STA condition, the extracted binder from glass beads showed a higher PGH than the estimated fully blended virgin-RAP binder, especially for Laboratory 2, implying over 100% activation of the RAP binder. This unrealistic outcome likely stems from insufficient differences in PGH between the virgin binder (representing 0% RBA) and the estimated fully blended virgin-RAP binder (representing 100% RBA), or variability associated with the preparation of glass beads and solvent extraction and recovery of the asphalt binder.
Table 12. PGH Results of LP-RAP Asphalt Mixtures
| Laboratory | LP-RAP Aging Condition | Unaged PGH (°C) | |||
|---|---|---|---|---|---|
| Virgin Binder | Extracted RAP Binder | Fully Blended Virgin-RAP Binder (Estimated) | Extracted Binder from Glass Beads | ||
| 1 | STA | 69.4 | 79.9 | 73.6 | 74.0 |
| LTA | 69.4 | 108.5 | 85.0 | 73.6 | |
| ELTA | 69.4 | 123.9 | 91.2 | 77.0 | |
| 2 | STA | 70.1 | 83.6 | 75.5 | 80.9 |
| LTA | 70.1 | 108.5 | 85.4 | 81.9 | |
| ELTA | 70.1 | 127.3 | 93.0 | 78.4 | |
Figure 21 presents the RBA of LP-RAP asphalt mixtures calculated from the PGH results in Table 12. For the STA mixture, the calculated RBA value exceeded 100% using the approach in Figure 11, but it was reported as 100%, indicating full activation of the RAP binder. This outcome was considered reasonable since the STA LP-RAP binder was graded as PG 76-16, which is not substantially different from a virgin binder. For the LTA mixture, the two laboratories reported markedly different RBA values, primarily due to an 8.3°C variation in the PGH of the
extracted binder from glass beads. In contrast, the ELTA mixture produced similar PGH results, yielding RBA values of 33% in Laboratory 1 and 36% in Laboratory 2. Overall, the RBA results obtained using the Glass Beads method differentiated among the LP-RAP asphalt mixtures. As the LP-RAP sample aging increased, RBA values decreased, indicating reduced binder availability.

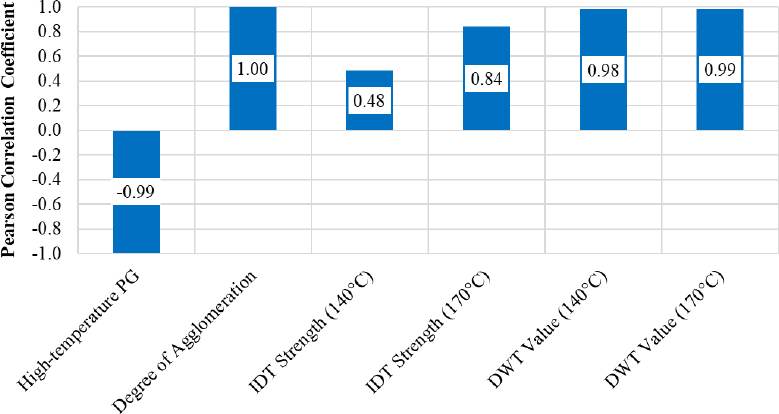
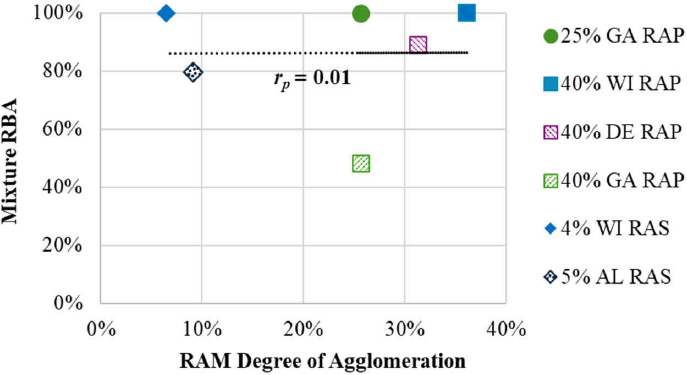
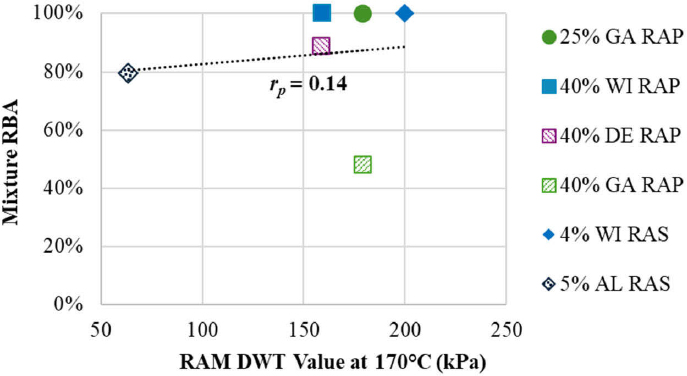
A Pearson correlation analysis was conducted between the LP-RAP sample characterization results and the average RBA results obtained by two laboratories using the Glass Beads method. The analysis resulted in a correlation coefficient (rp) ranging from -1 to +1, with -1 indicating a perfect negative correlation, 0 indicating no correlation, and +1 indicating a perfect positive correlation. Generally, an |rp| value greater than 0.6 to 0.7 is considered a strong linear correlation. As shown in Figure 22, the PGH of extracted asphalt binder, degree of agglomeration, and DWT-value exhibited strong correlations with the RBA results. In contrast, IDT strength showed inconsistent correlations between the two conditioning temperatures (140°C and 170°C). These findings suggest that binder stiffness, particle agglomeration, and workability of RAP may influence the RBA of the resulting mixtures.
3.1.3 Refinement of Glass Beads Method Procedure
Because of the promising RBA results, the Glass Beads method was selected for further evaluation to determine the RBA of field RAM asphalt mixtures. Based on insights gained from testing LP-RAP asphalt mixtures, several modifications were implemented to improve the test procedure by reducing operation variability and including additional replication for solvent extraction and recovery of glass beads and subsequent PGH testing of the recovered binder. The refinements included: (1) adopting a more rigorous sieving procedure by increasing the number of sieves and performing an additional round of sieving to effectively separate glass beads from fine particles of the mixture; (2) increasing the number of material batches to collect 1,000g of glass beads for each mixture and dividing them into two equal samples for asphalt extraction, recovery, and PGH testing; (3) utilizing an Asphalt Analyzer (Automated Extractor) to extract the asphalt binder from the glass beads, in accordance with ASTM D8159; (4) obtaining two replicate results for extracted binders from glass beads for each mixture, with a PGH difference of less than 3.0°C to ensure repeatability, based on PGH data from Asphalt Mixture Solvent Extraction (HMS) samples in the AASHTO re:source’s Proficiency Sample Program; and (5) determining the PGH of the fully blended virgin-RAM binder at 100% RBA by testing binder extracted directly from the mixture rather than estimating it using a linear blending chart analysis. Detailed procedures for the refined Glass Beads method are provided in Appendix C, following a draft AASHTO format.
3.2 RBA Sensitivity Evaluation Findings
This section presents the results and findings from evaluating the RBA sensitivity of field RAM asphalt mixtures prepared with various RAM types, sources, and contents, as well as different mix design and production variables, using the refined Glass Beads method.
3.2.1 Field RAM Characterization Results
Table 13 summarizes the aggregate gradation, binder content, and extracted binder PG results for field RAM samples. The PGI of the CA RAP binder and the PGI and PGL of the two RAS binders could not be determined due to excessive stiffness and brittleness during DSR and BBR testing. The RAP samples from WI, GA, and CA exhibited similar gradations, whereas the DE RAP sample had a coarser gradation. Binder content for the four RAP samples ranged from 4.5% to 4.9% by solvent extraction and from 4.8% to 5.8% by the ignition method. The PG results show that WI RAP had the lowest binder stiffness (PG 82-10), followed by DE RAP (PG 88-10), GA RAP (PG 94-4), and CA RAP (PG 100+14). Compared to RAP, the two RAS samples had significantly finer gradations, higher binder contents, and higher binder stiffness. Among the RAS samples, AL RAS had a lower binder content and a higher PGH than WI RAS.
Table 13. Aggregate Gradation, Binder Content, and Extracted Binder PG Results of Field RAM Samples
| Sieve Size | WI RAP | DE RAP | GA RAP | CA RAP | WI RAS | AL RAS |
|---|---|---|---|---|---|---|
| Percent Passing (%) | ||||||
| 19 mm | 100 | 100 | 100 | 100 | 100 | 100 |
| 12.5 mm | 100 | 100 | 98 | 100 | 100 | 100 |
| 9.5 mm | 97 | 95 | 93 | 99 | 100 | 100 |
| 4.75 mm | 74 | 65 | 74 | 79 | 99 | 100 |
| 2.36 mm | 55 | 43 | 58 | 61 | 99 | 98 |
| 1.18 mm | 42 | 31 | 46 | 47 | 77 | 84 |
| 0.6 mm | 32 | 23 | 37 | 35 | 52 | 63 |
| 0.3 mm | 21 | 16 | 26 | 23 | 44 | 52 |
| 0.15 mm | 15 | 12 | 17 | 14 | 34 | 39 |
| 0.075 mm | 12 | 9 | 9 | 8 | 22 | 28 |
| Binder Content (%) (Solvent Extraction) | 4.9 | 4.6 | 4.8 | 4.5 | 23.2 | 15.7 |
| Binder Content (%) (Ignition) | 5.8 | 4.8 | 4.9 | 5.3 | 25.2 | 19.0 |
| PGH (°C) | 86.4 | 92.4 | 98.3 | 105.1 | 142.9 | 204.2 |
| PGI (°C) | 38.1 | 40.8 | 39.1 | n/a | n/a | n/a |
| PGL (°C) | -12.5 | -14.9 | -4.4 | 11.1 | n/a | n/a |
| PG Grade | 82-10 | 88-10 | 94-4 | 100+14 | 142-xx | 202-xx |
Figure 23 shows the sieve analysis results for field RAM samples, where columns represent the average degree of agglomeration and error bars indicate one standard deviation based on two replicates. The RAS samples exhibited lower agglomeration values compared to the RAP samples, which can possibly be attributed to the higher stiffness of the RAS binder and its relatively weaker adhesion to RAS aggregate. For RAP samples, the average degree of agglomeration decreased as binder stiffness increased, as indicated by PG results in Table 13. However, the values remained within a relatively narrow range of 24% to 36% and were not statistically significant according to the Kruskal-Wallis test at a significant level of 0.05.

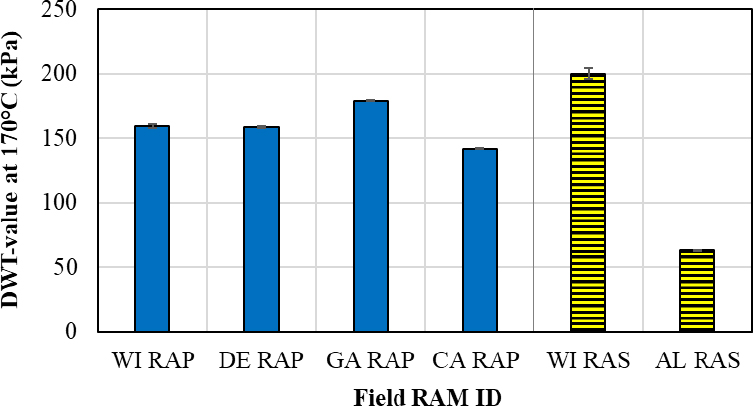
Figure 24 presents the DWT-value results at 170°C for field RAM samples, with error bars representing one standard deviation based on three replicates. Among all the samples, WI RAS exhibited the highest average DWT-value, indicating the best workability, followed by the four RAP samples and AL RAS. These results did not correlate with the extracted binder PG results in Table 13, differing from the trends observed for LP-RAP samples discussed previously. This discrepancy is likely attributable to the fact that the workability of RAM, measured by the DWT-value, is influenced by aggregate gradation, binder content, and binder stiffness. In the previous evaluation, LP-RAP samples had constant gradation and binder content, with binder stiffness as the only variable. Conversely, field RAM samples varied in gradation and binder content, especially between RAP and RAS, which may have obscured the effect of binder stiffness on the DWT results illustrated in Figure 24.
3.2.2 Field RAM Mix Design Results
Table 14 and Table 15 summarize the aggregate gradations and key volumetric properties for 11 field RAM mix designs used in the RBA sensitivity evaluation. The Mix Design IDs follow a consistent naming format that specifies RAM content, type, source, and virgin aggregate type. For example, “25% WI RAP_GRN” represents a 25% RAP mix design using Wisconsin RAP and granite aggregate. Overall, the mix designs exhibited similar gradations and volumetric properties despite variations in RAM types, sources, and contents.
Table 14. Aggregate Gradations of Field RAM Mix Designs
| Mix Design ID | Sieve Size (mm) | |||||||||
|---|---|---|---|---|---|---|---|---|---|---|
| 19 | 12.5 | 9.5 | 4.75 | 2.36 | 1.18 | 0.6 | 0.3 | 0.15 | 0.075 | |
| Percent Passing (%) | ||||||||||
| 25% WI RAP_GRN | 100 | 98 | 84 | 57 | 43 | 33 | 26 | 19 | 12 | 6.7 |
| 25% GA RAP_GRN | 100 | 98 | 89 | 61 | 47 | 37 | 29 | 22 | 13 | 5.9 |
| 40% WI RAP_GRN | 100 | 99 | 88 | 61 | 46 | 35 | 28 | 20 | 13 | 7.8 |
| 40% DE RAP_GRN | 100 | 98 | 88 | 62 | 46 | 35 | 27 | 19 | 13 | 6.7 |
| 40% GA RAP_GRN | 100 | 98 | 88 | 59 | 45 | 36 | 28 | 21 | 13 | 6.7 |
| 40% GA RAP_LMS | 100 | 96 | 88 | 61 | 44 | 36 | 29 | 20 | 11 | 6.3 |
| 40% CA RAP_GRN | 100 | 98 | 88 | 60 | 46 | 36 | 28 | 19 | 12 | 6.6 |
| 4% WI RAS_GRN | 100 | 98 | 88 | 59 | 46 | 36 | 28 | 21 | 13 | 6.1 |
| 5% AL RAS_GRN | 100 | 98 | 88 | 59 | 46 | 36 | 28 | 21 | 13 | 6.4 |
| 20% WI RAP, 3% WI RAS_GRN | 100 | 98 | 88 | 60 | 46 | 36 | 28 | 20 | 13 | 6.8 |
| 20% WI RAP, 3% WI RAS_LMS | 100 | 92 | 78 | 54 | 38 | 30 | 24 | 17 | 9.3 | 6.3 |
Table 15. Volumetric Properties of Field RAM Mix Designs
| Mix Design ID | Binder Content (%) | RBR, RAP | RBR, RAS | Air Voids (%) | VMA (%) | VFA (%) |
|---|---|---|---|---|---|---|
| 25% WI RAP_GRN | 4.85 | 0.30 | --- | 3.7 | 15.1 | 74.3 |
| 25% GA RAP_GRN | 4.93 | 0.25 | --- | 4.0 | 15.4 | 74.1 |
| 40% WI RAP_GRN | 5.00 | 0.47 | --- | 4.0 | 15.8 | 74.8 |
| 40% DE RAP_GRN | 4.80 | 0.40 | --- | 4.0 | 15.2 | 74.0 |
| 40% GA RAP_GRN | 4.85 | 0.40 | --- | 4.0 | 15.3 | 73.9 |
| 40% GA RAP_LMS | 5.32 | 0.37 | --- | 4.0 | 16.1 | 75.1 |
| 40% CA RAP_GRN | 4.88 | 0.48 | --- | 4.0 | 15.2 | 73.9 |
| 4% WI RAS_GRN | 5.12 | --- | 0.25 | 4.0 | 15.7 | 75.0 |
| 5% AL RAS_GRN | 5.00 | --- | 0.22 | 4.2 | 15.6 | 73.1 |
| 20% WI RAP, 3% WI RAS_GRN | 5.18 | 0.22 | 0.18 | 4.0 | 16.1 | 75.3 |
| 20% WI RAP, 3% WI RAS_LMS | 5.73 | 0.20 | 0.17 | 4.0 | 16.9 | 76.4 |
3.2.3 Field RAM Asphalt Mixture RBA Results
3.2.3.1 Impacts of RAM Type, Source, and Content
Table 16 shows the PGH results for the virgin binder, the extracted binder from glass beads, and the fully blended virgin-RAM binder of nine RAM asphalt mixtures in Experiment 1. Each value
represents the average of two replicates. Testing of the extracted binder from glass beads was based on two extraction and recovery samples to assess repeatability. All mixtures used the same virgin aggregate (low-absorptive GRN) and virgin binder [PG 64-22 (Source A)] but varied in RAM type, source, or content. The RBA for each mixture was determined following the approach in Figure 11 for all but two mixtures. For the 25% WI RAP asphalt mixture, the PGH difference between the virgin binder and the fully blended virgin-RAM binder was only 2.1°C, making RBA determination highly sensitive to minor variations in the extracted binder from glass beads after solvent extraction and recovery. For the 40% CA RAP asphalt mixture, the amount of extracted binder from glass beads was insufficient for DSR testing to determine PGH. As a result, RBA values for these two mixtures could not be determined.
Table 16. PGH Results of Field RAM Asphalt Mixtures with Different RAM Types, Sources, and Contents
| Mix Design ID | Virgin Binder | Unaged PGH (°C) | PGH Results Valid for RBA Determination? | ||||
|---|---|---|---|---|---|---|---|
| Virgin Binder | Extracted Binder from Glass Beads | Fully Blended Virgin-RAM Binder | |||||
| Sample 1 | Sample 2 | Average | |||||
| 25% WI RAP_GRN | PG 64-22 (Source A) | 68.8 | 78.8 | 76.4 | 77.6 | 70.9 | No* |
| 25% GA RAP_GRN | 68.8 | 80.2 | 79.5 | 79.9 | 79.3 | Yes | |
| 40% WI RAP_GRN | 68.8 | 82.2 | 81.2 | 81.7 | 79.8 | Yes | |
| 40% DE RAP_GRN | 68.8 | 86.5 | 86.6 | 86.6 | 88.7 | Yes | |
| 40% GA RAP_GRN | 68.8 | 74.9 | 77.7 | 76.3 | 84.3 | Yes | |
| 40% CA RAP_GRN | 68.8 | Not available | 87.3 | No^ | |||
| 4% WI RAS_GRN | 68.8 | 82.4 | 79.6 | 81.0 | 81.0 | Yes | |
| 5% AL RAS_GRN | 68.8 | 89.6 | 88.5 | 89.1 | 94.2 | Yes | |
| 20% WI RAP, 3% WI RAS_GRN | 68.8 | 85.1 | 83.6 | 84.4 | 89.5 | Yes | |
Notes: * Insufficient PGH difference between the virgin binder and the fully blended virgin-RAM binder for RBA determination. ^ Insufficient amount of extracted binder from glass beads for DSR testing to determine PGH. | |||||||
Figure 25 presents the calculated RBA results for the remaining seven mixtures in Experiment 1, organized into four groups by RAP content effect, RAP source effect, RAS source effect, and the combined use of RAP and RAS. The columns represent the average RBA value for each mixture, and the error bars indicate one standard deviation based on two replicates from binder samples extracted and recovered from glass beads. Two mixtures had average calculated RBA values exceeding 100% (105% and 117%), caused by slightly higher PGH values (less than 2.0°C) for the extracted binder from glass beads compared to the fully blended virgin-RAM binder, as shown in Table 16. These differences are likely due to typical variability in solvent extraction, recovery, and DSR testing for PGH determination. Consequently, the RBA values for these mixtures were interpreted as 100%, indicating full activation of the RAM binder.

In the “RAP content effect” group, the two mixtures showed a reduction in RBA values as RAP content increased from 25% to 40%, suggesting that a higher proportion of virgin binder may enhance RAP binder mobilization during mixing. Similarly, RBA values decreased as RAM binder stiffness increased for mixtures in the “RAP source effect” and “RAS source effect” groups. The two RAS-only mixtures exhibited RBA values within the range observed for RAP-only mixtures, despite the high stiffness of RAS binder. These findings indicate that RBA, as measured by the Glass Beads method, is influenced not only by RAM binder stiffness, but also by aggregate agglomeration, with RAS showing notably lower agglomeration values than RAP (Figure 23). The high RBA values observed for RAS-only mixtures may also be attributed to improved dispersion resulting from the finer particle size of RAS and the higher proportion of virgin binder, which likely facilitates mobilization of the RAS binder during mixing. The RAP/RAS asphalt mixture
had an RBA value within the range observed for RAP-only and RAS-only mixtures, but no definitive trend could be established with only one mixture available.
Overall, the results in Figure 25 indicate that both RAM content and source affect RBA. Specifically, the RBA of mixtures containing only RAP or RAS decreases as the content and aging condition (measured by binder stiffness) of the RAM increase. RAS asphalt mixtures do not necessarily have lower RBA values than RAP asphalt mixtures, despite the excessively high stiffness and brittleness of RAS binders.
Pearson correlation analysis was conducted on RAM characterization and RBA results. As shown in Figure 26, Figure 27, and Figure 28, extracted RAM binder PGH, degree of agglomeration, and DWT-value showed no correlation with RBA across all field RAM asphalt mixtures in Experiment 1, differing from the trends observed for LP-RAP asphalt mixtures discussed previously. This lack of correlation is likely due to mix design differences resulting from variations in binder content and aggregate gradation among field RAM samples. Figure 26 indicates that for mixtures with 40% RAP or with RAS-only, RBA values consistently decreased as extracted RAM binder PGH increased. However, this relationship did not hold when comparing mixtures with different RAM contents (25% RAP vs. 40% RAP) or RAM types (RAP-only versus RAS-only). Overall, these correlation results suggest that predicting RBA solely from individual RAM properties characterized through extracted binder PG, sieve analysis, or DWT testing may not be feasible.

3.2.3.2 Sensitivity to Mix Design Variables
Table 17 presents the PGH results for the virgin binder, the extracted binder from glass beads, and the fully blended virgin-RAM binder of field RAM asphalt mixtures measured in Experiment 2. As in Experiment 1, each value represents the average of two replicates, with the extracted binder from glass beads tested based on two extraction and recovery samples to assess repeatability. The mixtures are divided into two groups: Group 1 consists of six mixtures containing 40% GA RAP, and Group 2 includes six mixtures with 20% WI RAP and 3% WI RAS. Each group contains one LMS-based mixture with PG 64-22 (Source A) binder and five GRN-based mixtures with different virgin binders: PG 64-22 (Source A), PG 64-22 (Source B), PG 58-28, PG 76-22 PMA, and PG 64-22 (Source A) modified with a bio-based RA. Based on supplier recommendations, RA dosage (by weight of virgin binder) was 8.5% for the 40% GA RAP asphalt mixture and 6.2% for the 20% WI RAP, 3% WI RAS asphalt mixture. These mixtures enable evaluation of RBA sensitivity to virgin binder type (including the use of RA) and virgin aggregate type.
Table 17. PGH Results of Field RAM Asphalt Mixtures with Different Mix Design Variables
| Mix Design ID | Virgin Binder | Unaged PGH (°C) | PGH Results Valid for RBA Determination? | ||||
|---|---|---|---|---|---|---|---|
| Virgin Binder | Extracted Binder from Glass Beads | Fully Blended Virgin-RAM Binder | |||||
| Sample 1 | Sample 2 | Average | |||||
| 40% GA RAP_GRN | PG 64-22 (Source A) | 68.8 | 74.9 | 77.7 | 76.3 | 84.3 | Yes |
| PG 76-22 PMA | 81.5 | Not available | 88.2 | No* | |||
| PG 58-28 | 58.5 | 76.2 | 74.4 | 75.3 | 84.4 | Yes | |
| PG 64-22 (Source B) | 66.7 | 81.2 | 83.9 | 82.6 | 87.1 | Yes | |
| PG 64-22 (Source A) + 8.5% RA | 55.6 | 76.3 | 73.9 | 75.1 | 81.7 | Yes | |
| 40% GA RAP_LMS | PG 64-22 (Source A) | 68.8 | 76.9 | 78.9 | 77.9 | 81.2 | Yes |
| 20% WI RAP, 3% WI RAS_GRN | PG 64-22 (Source A) | 68.8 | 85.1 | 83.6 | 84.4 | 89.5 | Yes |
| PG 76-22 PMA | 81.5 | Not available | 94.7 | No* | |||
| PG 58-28 | 58.5 | 75.5 | 77.9 | 76.7 | 80.2 | Yes | |
| PG 64-22 (Source B) | 66.7 | 87.7 | 87.8 | 87.8 | 88.3 | Yes | |
| PG 64-22 (Source A) + 6.2% RA | 55.6 | 76.5 | 78.3 | 77.4 | 79.3 | Yes | |
| 20% WI RAP, 3% WI RAS_LMS | PG 64-22 (Source A) | 68.8 | 80.4 | 80.5 | 80.4 | 81.0 | Yes |
Notes: * Poor repeatability in the PGH of the extracted binder from glass beads. | |||||||
For two mixtures containing PG 76-22 PMA binder, RBA could not be determined because the extracted binder from glass beads exhibited poor repeatability in PGH compared to the suggested 3.0°C criterion suggested by AASHTO re:source’s HMS data, despite multiple retests. This issue likely resulted from inappropriate solvent extraction of the PG 76-22 PMA binder using TCE, highlighting a limitation of the Glass Beads method. Consequently, RBA for these two mixtures remained undetermined.
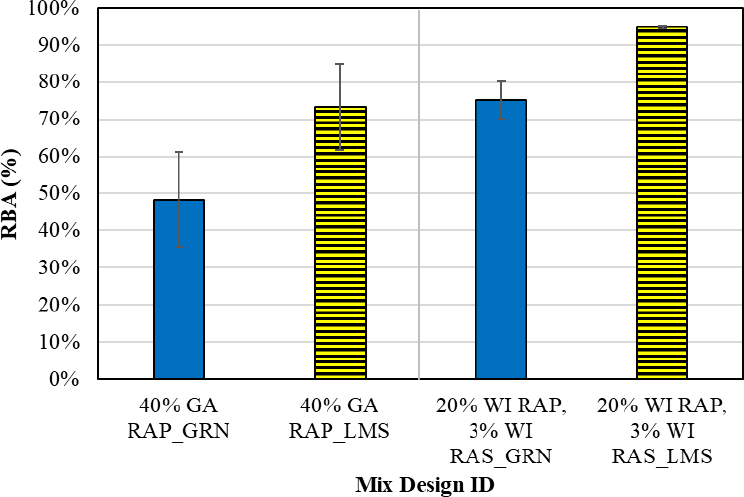
Figure 29 presents the RBA results for field RAM asphalt mixtures prepared with two GRN-based mix designs and four virgin binders. Error bars represent one standard deviation based on two replicates from binder samples extracted and recovered from glass beads. The results are grouped by mix design to evaluate sensitivity to virgin binder type. For both mix designs, PG 64-22 (Source B) binder yielded the highest RBA value, followed by PG 64-22 (Source A) binder modified with a bio-based RA, PG 58-28 binder, and PG 64-22 (Source A) binder. These findings indicate that both virgin binder source and grade affect RBA. However, RBA values do not correlate with the continuous PG grades of the virgin binders, suggesting that virgin binder effects extend beyond binder stiffness alone. The addition of RA increased RBA for both mix designs, likely due to softening of the RAM binder and restoration of the asphaltene-maltene balance, which may enhance RAM binder activation and mobilization during mixing.

Figure 30 presents the RBA results for two sets of high-RAM asphalt mixtures using the same RAM and virgin binder but different virgin aggregates (i.e., low-absorptive GRN and high-absorptive LMS), based on two replicates. In both cases, LMS mixtures exhibited higher RBA values than GRN mixtures, likely due to the increased virgin binder content in LMS mixtures from volumetric mix design. As noted previously, a higher proportion of virgin binder might facilitate RAM binder mobilization during mixing, resulting in higher RBA values. Overall, these results suggest that virgin aggregate type can affect the RBA of RAM asphalt mixtures, even when the same RAM and virgin binder are used.
3.2.3.3 Sensitivity to Production Variables
Table 18 presents the PGH results for the virgin binder, the extracted binder from glass beads, and the fully blended virgin-RAM binder of field RAM asphalt mixtures measured in Experiment 3. As in previous experiments, each value represents the average of two replicates, with the extracted binder from glass beads tested based on two extraction and recovery samples to assess repeatability. The mixtures are divided into two groups: Group 1 includes four 40% GA RAP asphalt mixtures, and Group 2 includes four mixtures with 20% WI RAP and 3% WI RAS. Mixtures within each group used the same mix design and virgin binder [PG 64-22 (Source A)] but were subjected to different production variables. Three mixtures were produced at standard, elevated, and reduced temperatures without simulated silo storage, while the fourth mixture was produced at the standard temperature with laboratory simulated silo storage.
The standard temperature corresponded to the specified mixing temperature based on the virgin binder grade. The elevated temperature was set 16.7°C higher than the standard, and the reduced temperature was 16.7°C lower, achieved by using a WMA chemical additive (at 0.5% by weight of total binder) to maintain mixture workability. Silo storage was simulated in the laboratory by placing loose mixtures (in 2,500g batches) in gallon cans and conditioning them in an oven at the compaction temperature (157°C) for two hours. The cans were loosely covered by the lid to limit direct exposure of the mixture to oxygen and heat inside the oven. After conditioning, the loose mixture underwent solvent extraction and recovery, followed by DSR testing to determine the PGH of the virgin binder, the extracted binder from glass beads, and the fully blended virgin-RAM binder.
Table 18. PGH Results of Field RAM Asphalt Mixtures with Different Production Variables
| Mix Design ID | Virgin Binder | Mixing Temperature | Simulated Silo Storage | Unaged PGH (°C) | PGH Results Valid for RBA Determination? | ||||
|---|---|---|---|---|---|---|---|---|---|
| Virgin Binder | Extracted Binder from Glass Beads | Fully Blended Virgin-RAM Binder | |||||||
| Sample 1 | Sample 2 | Average | |||||||
| 40% GA RAP_GRN | PG 64-22 (Source A) | Standard (143°C) | No | 68.8 | 74.9 | 77.7 | 76.3 | 84.3 | Yes |
| Reduced (WMA, 126.7°C) | No | 68.3 | 74.8 | 79.7 | 77.2 | 86.0 | Yes | ||
| Elevated (160°C) | No | 68.8 | 80.6 | 83.7 | 82.1 | 81.5 | Yes | ||
| Standard (143°C) | Yes | 76.5 | 84.2 | 84.3 | 84.3 | 91.6 | Yes | ||
| 20% WI RAP, 3% WI RAS_GRN | PG 64-22 (Source A) | Standard (148.9°C) | No | 68.8 | 85.1 | 83.6 | 84.4 | 89.5 | Yes |
| Reduced (WMA, 132.2°C) | No | 68.7 | 80.5 | 81.5 | 81.0 | 90.2 | Yes | ||
| Elevated (165.6°C) | No | 68.8 | 83.1 | 83.4 | 83.2 | 82.3 | Yes | ||
| Standard (148.9°C) | Yes | 74.6 | 86.4 | 87.5 | 86.9 | 98.1 | Yes | ||
Figure 31 presents the RBA results for two RAM asphalt mixtures produced at different temperatures, based on two replicates. For both mixtures, RBA increased significantly with a 16.7°C increase in production temperature. At the elevated temperatures, the PGH of the extracted binder from glass beads was slightly higher (by less than 1.0°C) than that of the fully blended virgin-RAM binder, likely due to typical variability in solvent extraction, recovery, and DSR testing. This resulted in calculated RBA values slightly above 100% (105% and 107%), which were interpreted as 100%, indicating full activation of the RAM binder during mixing. Reducing the production temperature by 16.7°C decreased the RBA of the 20% WI RAP, 3% WI RAS asphalt mixture but had no effect on the 40% GA RAP asphalt mixture. These findings suggest that production temperature affects RBA, although the magnitude of the effect may vary by mixture.
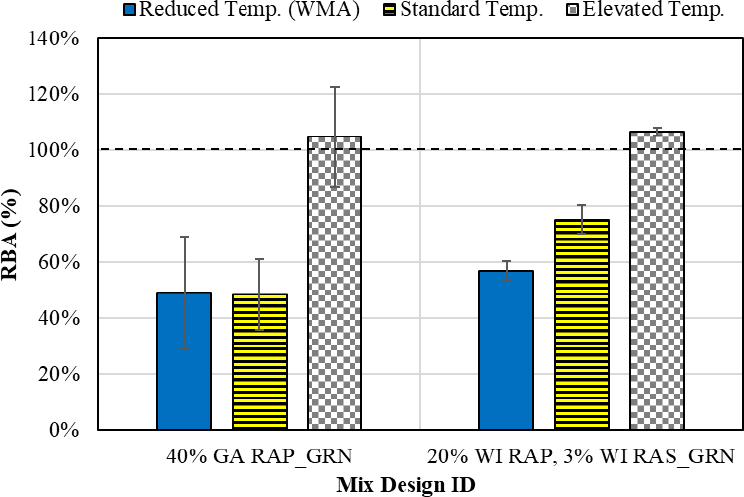
Figure 32 presents the effects of laboratory simulated silo storage on RBA for two high-RAM asphalt mixtures, based on two replicates. The 40% GA RAP_GRN mixture showed slight changes in RBA after laboratory simulated silo storage, while the 20% WI RAP, 3% WI RAS_GRN mixture exhibited a notable decrease. Laboratory simulated silo storage involved holding the mixture at elevated temperatures for an extended period after mixing, which may facilitate continued activation of the RAM binder and therefore increase RBA. However, prolonged exposure to high temperatures can also cause additional aging and stiffening of the RAM binder, reducing its mobilization within the mixture and consequently lowering RBA. Therefore, the impact of laboratory simulated silo storage on RBA may depend on the balance between these two competing effects, as evidenced by the contrasting trends in Figure 32.

3.3 RBA Performance Impact Analysis Findings
3.3.1 Virgin and RAM Binder PG Results
Table 19 summarizes the PG grading results for virgin and extracted RAM binders used in the two high-RAM mix designs. The virgin binder was graded in accordance with AASHTO M 320. Solvent extraction and recovery of the RAM binder were conducted following AASHTO T 164 (Method A, using TCE) and ASTM D5404, respectively. The RAM binder was graded using the same procedure as the virgin binder, including RTFO aging per AASHTO T 240 and 20 hours of PAV aging per AASHTO R 28.
Table 19. Virgin and RAM Binder PG Results
| Mix Design ID | Binder ID | PGH (°C) | PGI (°C) | PGL (°C) | ΔTc (°C) |
|---|---|---|---|---|---|
| Georgia High-RAP | PG 64-22 | 69.2 | 24.2 | -22.5 | 0.6 |
| PG 76-22 | 81.8 | 22.3 | -25.9 | -4.7 | |
| RAP | 98.3 | 39.1 | -4.4 | -12.8 | |
| Wisconsin High-RAP/RAS | PG 58S-28 | 59.7 | 17.9 | -30.2 | -0.6 |
| PG 58V-28 | 64.4 | 12.7 | -35.0 | 0.3 | |
| RAP | 77.8 | 30.2 | -20.2 | -8.9 | |
| RAS | 156.2 | n/a | n/a | n/a |
For both mix designs, the PMA binder exhibited higher continuous PGH and lower continuous PGI and PGL than the unmodified binder, indicating better rutting resistance, fatigue cracking resistance, and low-temperature cracking resistance, respectively. The comparison of ΔTc for block cracking characterization showed mixed trends: the PG 76-22 PMA binder had a significantly lower ΔTc than the PG 64-22 binder, while the PG 58V-28 binder had a slightly higher ΔTc than the PG 58S-28 binder. Although ΔTc is a useful indicator of the balance between binder
stiffness and relaxation properties at low temperatures, its applicability to PMA binders, especially those modified with elastomeric polymers, remains questionable (Asphalt Institute, 2019).
The Georgia RAP binder was graded as PG 94-4, with a continuous grade of PG 98.3-4.4 and a ΔTc of -12.8°C. The Wisconsin RAP binder was graded as PG 76-16, with a continuous grade of PG 77.8-20.2 and a ΔTc of -8.9°C. These results indicate that the Georgia RAP was considerably more aged than the Wisconsin RAP, exhibiting higher stiffness and poorer relaxation properties. The Wisconsin RAS binder was graded as PG 154-xx with a continuous PGH of 156.2°C. PGI and PGL could not be determined due to the excessive binder stiffness and brittleness during DSR and BBR testing.
3.3.2 RBA Testing Results
Table 20 summarizes the measured PGH results for virgin binders, extracted binders from glass beads, and fully blended virgin-RAM binders, along with the calculated average RBA values based on two replicates using the refined Glass Beads method. The Georgia high-RAP asphalt mixture with PG 64-22 binder had an RBA value of 48%. The RBA for the mixture containing PG 76-22 PMA binder could not be determined due to high variability in the PGH results of the extracted binder from glass beads, likely caused by inappropriate extraction using TCE. The Wisconsin high-RAP/RAS asphalt mixture with PG 58S-28 binder had an RBA value of 65%, while the PG 58V-28 PMA binder yielded a lower RBA value of 58%.
Table 20. RBA Results of High-RAM Asphalt Mixtures
| Mix Design ID | Virgin Binder | Unaged PGH (°C) | RBA Value (Average) | ||||
|---|---|---|---|---|---|---|---|
| Virgin Binder (0% RBA) | Extracted Binder from Glass Beads | Fully Blended Virgin-RAM Binder (100% RBA) | |||||
| Sample 1 | Sample 2 | Average | |||||
| Georgia High-RAP | PG 64-22 | 68.8 | 74.9 | 77.7 | 76.3 | 84.3 | 48% |
| PG 76-22 | 81.5 | Not available* | 88.2 | Not available* | |||
| Wisconsin High-RAP/RAS | PG 58S-28 | 58.9 | 73.3 | 75.4 | 74.4 | 82.5 | 65% |
| PG 58V-28 | 64.4 | 75.5 | 75.3 | 75.4 | 83.5 | 58% | |
| Note: * RBA could not be determined due to poor repeatability in the PGH of the extracted binder from glass beads. | |||||||
Table 21 compares the A-OBC at the measured RBA levels with V-OBC at 100% RBA. Due to the lack of success using the refined Glass Beads method, the RBA for the Georgia high-RAP asphalt mixture with PG 76-22 PMA binder was assumed to be equal to that of the mixture with PG 64-22 binder, enabling a direct comparison of performance properties between the two virgin binders. For Georgia high-RAP asphalt mixtures, A-OBC was 1.05% higher than V-OBC.
For Wisconsin high-RAP/RAS asphalt mixtures, A-OBC exceeded V-OBC by 0.59% when using the PG 58S-28 binder and by 0.71% when using the PG 58V-28 binder.
Table 21. V-OBC and A-OBC Results of High-RAM Asphalt Mixtures
| Mix Design ID | Virgin Binder | RBA Value | V-OBC (%) | A-OBC (%) |
|---|---|---|---|---|
| Georgia High-RAP | PG 64-22 | 48% | 4.85 | 5.90 |
| PG 76-22 | 48% (assumed) | 4.85 | 5.90 | |
| Wisconsin High-RAP/RAS | PG 58S-28 | 65% | 5.30 | 5.89 |
| PG 58V-28 | 58% | 5.30 | 6.01 |
3.3.3 Volumetric Analysis Results
Table 22 compares the volumetric properties of Georgia high-RAP and Wisconsin high-RAP/RAS mix designs at V-OBC and A-OBC, using PG 64-22 and PG 58S-28 unmodified binders, respectively. At A-OBC, the additional virgin binder resulted in lower RBR, air voids, and VMA compared to V-OBC, while increasing VFA and reducing the D/P ratio. Due to these changes, both mix designs at A-OBC did not comply with the respective DOT requirements for VMA and VFA. These findings suggest that the RBA approach may necessitate relaxing current volumetric requirements at A-OBC to accommodate the additional virgin binder without changing aggregate gradation.
Table 22. Volumetric Properties of High-RAM Mix Designs at V-OBC and A-OBC
| Mix Design ID | OBC (%) | RBR | Air Voids (%) | VMA (%) | VFA (%) | D/P Ratio |
|---|---|---|---|---|---|---|
| Georgia High-RAP | 4.85 (V-OBC) | 0.40 | 4.0 | 15.3 | 73.9 | 1.5 |
| 5.90 (A-OBC) | 0.33 | 1.5 | 14.8 | 78.9 | 1.2 | |
| Respective DOT Requirements | Min. 15.0 | 72 to 76 | 0.8 to 1.6 | |||
| Wisconsin High-RAP/RAS | 5.30 (V-OBC) | 0.31 | 4.6 | 15.6 | 70.7 | 1.2 |
| 5.89 (A-OBC) | 0.28 | 1.7 | 14.4 | 87.9 | 1.1 | |
| Respective DOT Requirements | Min. 14.5 | 65 to 75 | 0.6 to 1.2 | |||
3.3.4 Index-based Performance Testing Results
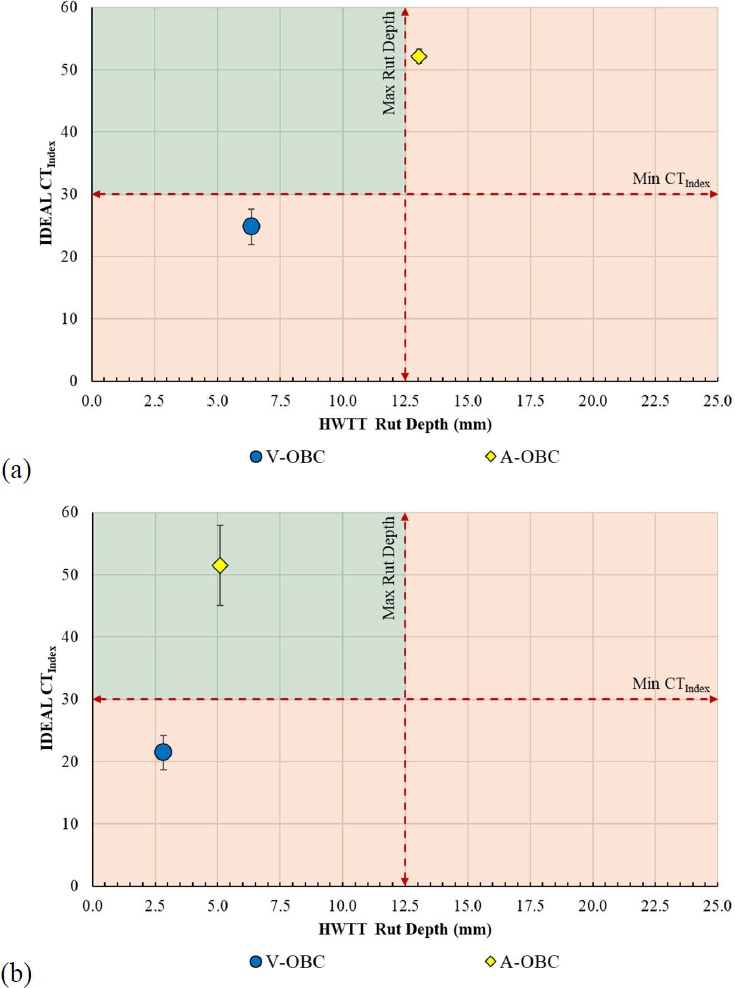
Figure 33 and Figure 34 present the HWTT and IDEAL-CT results for the Georgia high-RAP and Wisconsin high-RAP/RAS asphalt mixtures, respectively, on a balanced mix design (BMD) performance interaction diagram. HWTT results were based on two replicates and IDEAL-CT results were based on a minimum of three replicates. The dashed lines indicate the suggested criteria in AASHTO PP 127: a minimum CTIndex of 20 after LTA for Georgia high-RAP mixtures and 30 for Wisconsin high-RAP/RAS mixtures, and a maximum rut depth of 12.5 mm at 20,000 passes after STA, when tested at 50°C for Georgia high-RAP mixtures and 45°C for Wisconsin high-RAP/RAS mixtures. These criteria divide the diagram into four quadrants, with the upper left quadrant (shaded light green) indicating the desired “balanced performance” zone for rutting and cracking resistance.
Figure 33 shows that Georgia high-RAP asphalt mixtures at V-OBC, regardless of virgin binder type, met the HWTT criterion but failed the IDEAL-CT, indicating good rutting resistance but poor cracking resistance. As a result, they fell outside the “balanced performance” zone on the diagram. Increasing the virgin binder content by 1.05% at 48% RBA significantly improved the IDEAL-CT results, achieving an average CTIndex of 36.0 with PG 64-22 binder and 32.5 with PG 76-22 binder, both above the minimum threshold of 20. The additional virgin binder slightly reduced rutting resistance in both mixtures, as indicated by an approximately 1.5 mm increase in HWTT rut depth; nevertheless, the results remained below 12.5 mm, demonstrating adequate rutting resistance likely due to the stiff RAP and hydrated lime in the mixture. As a result, the mixtures at A-OBC fell within the “balanced performance” zone.
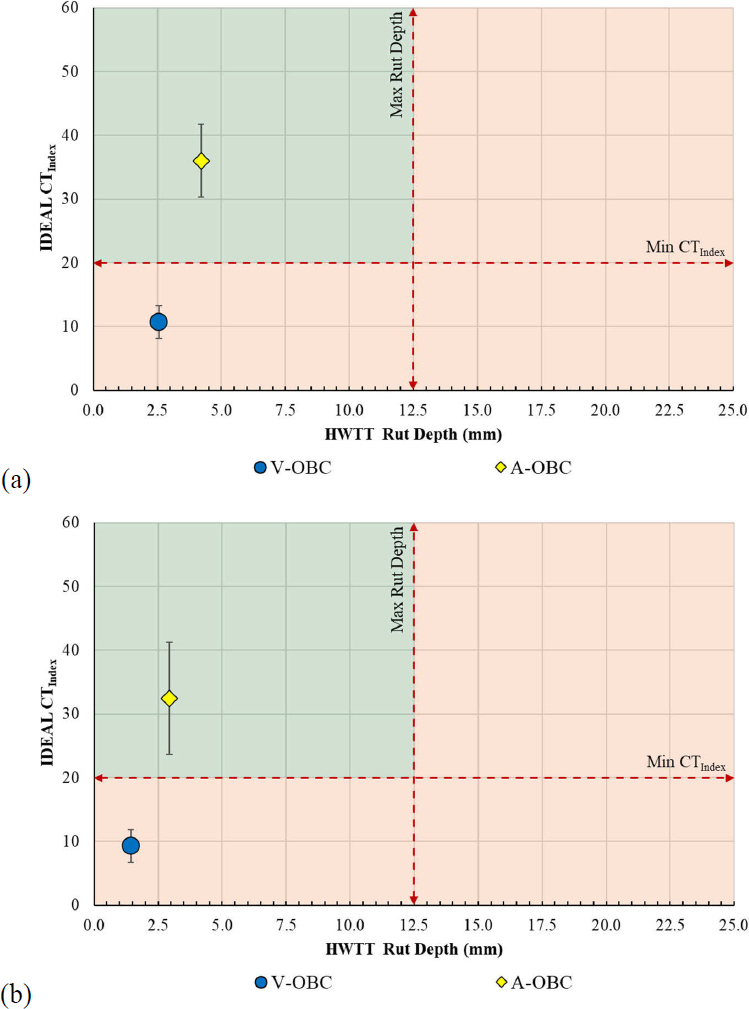
The Wisconsin high-RAP/RAS asphalt mixture with PG 58V-28 binder [Figure 34(b)] exhibited a trend similar to the Georgia high-RAP asphalt mixtures. At V-OBC, it met the HWTT criterion but failed the IDEAL-CT, indicating good rutting resistance but poor cracking resistance. Increasing the virgin binder content by 0.71% at 58% RBA achieved balanced performance, meeting both HWTT and IDEAL-CT requirements at A-OBC. Conversely, the mixture with PG 58S-28 binder did not achieve balanced performance at either OBC, as shown in Figure 34(a). At V-OBC with 100% RBA, it met the HWTT criterion but failed the IDEAL-CT, similar to the other mixtures evaluated. Adding 0.59% more virgin binder at 65% RBA improved the average CTIndex to 52.2, surpassing the IDEAL-CT threshold at A-OBC; however, it failed the HWTT criterion with a rut depth of 13.0 mm, showing marginally inadequate rutting resistance. The contrasting HWTT results between PG 58S-28 and PG 58V-28 binders underscore the benefit of polymer modification in improving rutting resistance.
Overall, the IDEAL-CT results indicated that increasing the virgin binder content at a reduced RBA level significantly improved the cracking resistance of both Georgia high-RAP and Wisconsin high-RAP/RAS asphalt mixtures, regardless of whether an unmodified or PMA binder was used. This highlights the influence of binder quantity on mixture cracking resistance. Conversely, HWTT results revealed an adverse effect on rutting resistance due to the additional virgin binder, with the magnitude of this impact varying by mix design and virgin binder type. Based on the suggested test criteria in AASHTO PP 127, all mixtures demonstrated good rutting resistance but poor cracking resistance at V-OBC with 100% RBA. At A-OBC with a reduced RBA level, three mixtures achieved balanced rutting and cracking resistance. However, the Wisconsin high-RAP/RAS asphalt mixture with PG 58S-28 binder exhibited marginally inadequate rutting resistance despite acceptable cracking resistance. These findings indicate that considering RBA is a viable approach for achieving balanced performance in high-RAM asphalt mixtures. However, they also emphasize the need to verify rutting resistance after applying the RBA approach, especially for mixtures with unmodified binders.
3.3.5 AMPT-based Performance Testing Results
Figure 35 and Figure 36 present the fitted |E*| master curves for the Georgia high-RAP and Wisconsin high-RAP/RAS asphalt mixtures, respectively, prepared with different virgin binders at V-OBC versus A-OBC. The master curves were developed in accordance with AASHTO R 84, using a minimum of three replicates per mixture. In all cases, the A-OBC curve positioned below the V-OBC curve, indicating consistently lower |E*| values—by up to approximately 33% to 37% for Georgia high-RAP mixtures and 25% to 37% for Wisconsin high-RAP/RAS mixtures—across a wide range of reduced frequencies. These results suggest that incorporating additional virgin binder at a reduced RBA level reduces mixture stiffness, regardless of whether an unmodified or PMA binder is used.
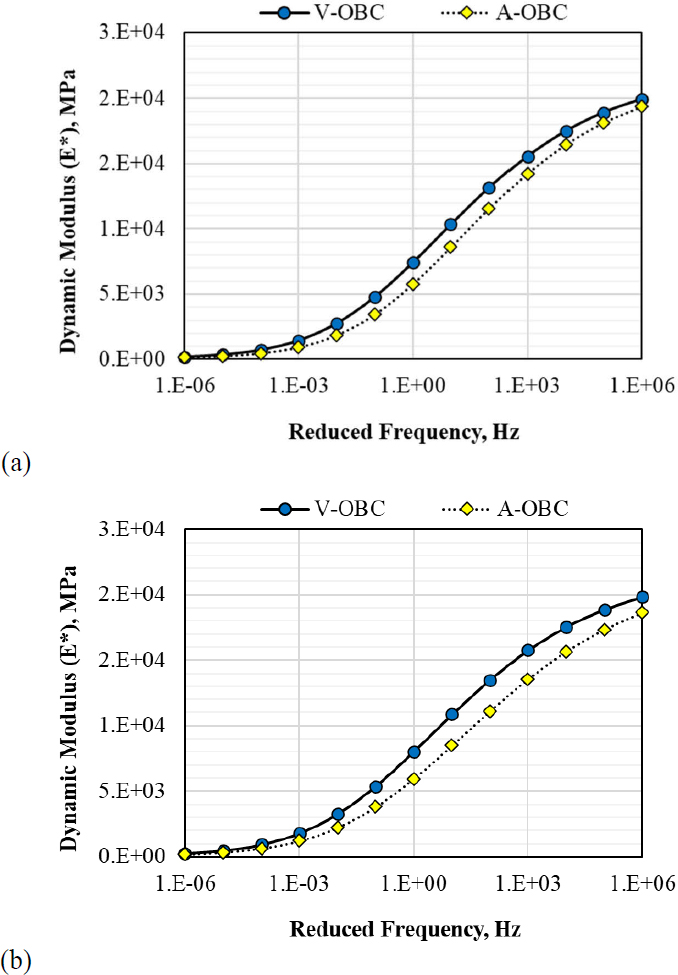

Figure 37 and Figure 38 present the DTCF DR and Sapp results for Georgia high-RAP and Wisconsin high-RAP/RAS asphalt mixtures, respectively, at V-OBC and A-OBC. Error bars represent one standard deviation based on a minimum of three replicates per mixture. For Georgia high-RAP asphalt mixtures with PG 64-22 and PG 76-22 PMA binders, both average DR and Sapp values were higher at A-OBC than at V-OBC, indicating improved fatigue damage resistance with additional virgin binder at a reduced RBA level. However, these differences were not statistically significant according to a t-test at a significant level of 0.05. The Wisconsin high-RAP/RAS asphalt mixture with PG 58S-28 binder exhibited statistically higher DR and Sapp values at A-OBC compared to V-OBC. In contrast, the mixture with PG 58V-28 PMA binder showed similar DR values but lower average Sapp values at A-OBC, with differences not statistically significant when accounting for test variability. This discrepancy can be attributed to differences in mixture stiffness and toughness between the two binder contents, which influenced Sapp but not DR. Overall, the
DTCF results suggest that high-RAM asphalt mixtures exhibit better or comparable fatigue cracking resistance at A-OBC with a reduced RBA level than at V-OBC with 100% RBA.


3.3.6 FlexPAVE Simulation Results
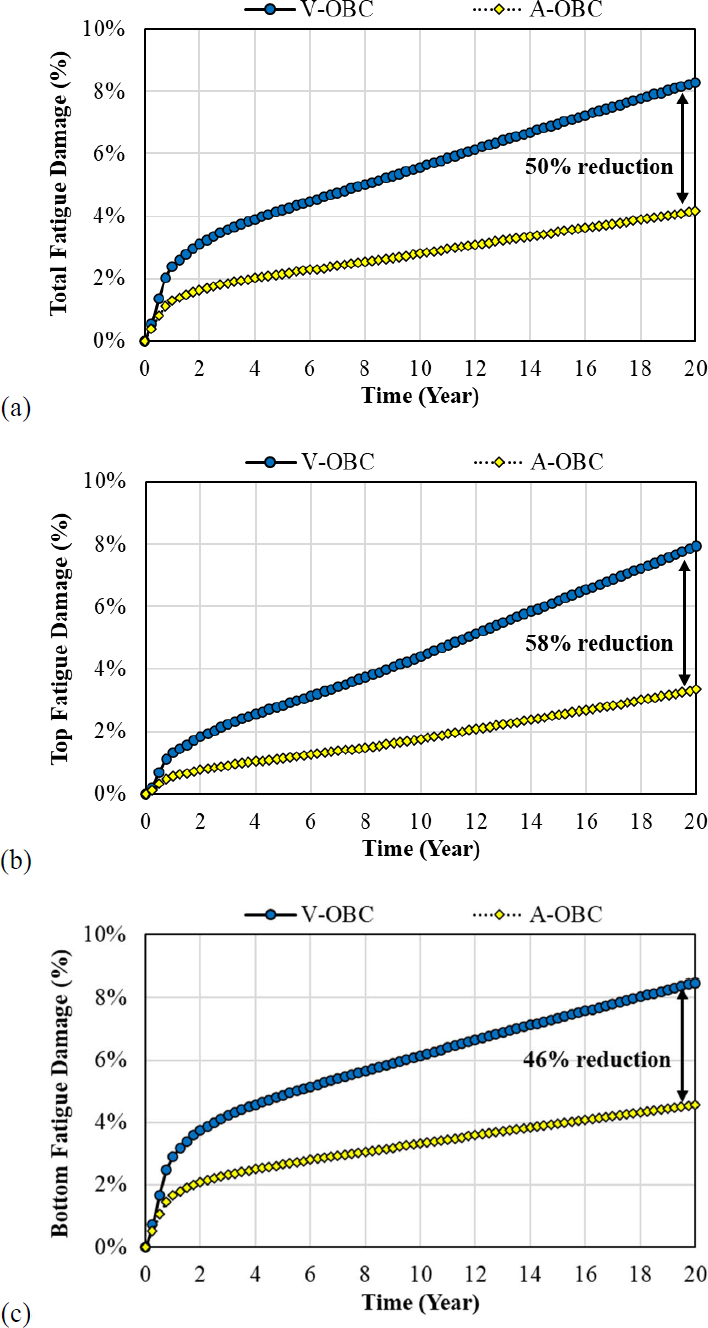
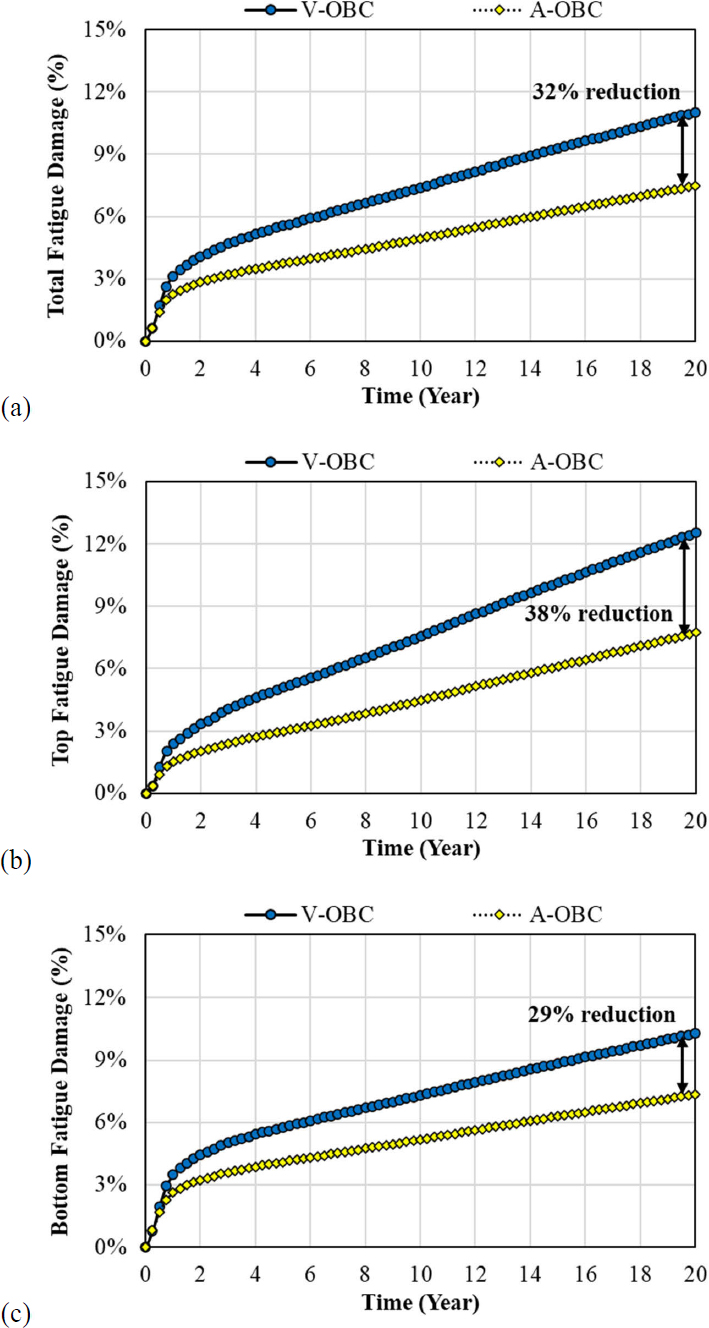
Figure 39 and Figure 40 show the predicted fatigue damage progression for Georgia high-RAP asphalt mixtures with PG 64-22 and PG 76-22 PMA binders, respectively. For both virgin binders, mixtures at A-OBC significantly outperformed those at V-OBC in terms of bottom-up and top-down cracking resistance. At the end of service life, total fatigue damage at A-OBC was 50% lower for the mixture with PG 64-22 binder, and 32% lower for the mixture with PG 76-22 PMA binder. These results demonstrate that adding additional virgin binder at a reduced RBA level improves predicted pavement cracking performance in FlexPAVE simulations.
Additional FlexPAVE simulations were conducted for A-OBC at a reduced asphalt layer thickness to further quantify the cracking performance benefits associated with the RBA approach. For the mixture with PG 64-22 binder, the asphalt layer thickness at A-OBC could be reduced to 21.6 cm while still matching the bottom fatigue damage observed for V-OBC with a 27.9 cm asphalt layer, representing a 23% reduction in thickness. Despite the thinner pavement structure, the A-OBC mixture maintained lower total and top fatigue damage compared to the V-OBC mixture, as shown in Figure 41. For the mixture with PG 76-22 PMA binder, the asphalt layer thickness at A-OBC could be reduced to 22.9 cm (Figure 42), an 18% reduction compared to the V-OBC mixture. These results highlight potential pavement thickness-reduction benefits associated with the RBA approach for high-RAM asphalt mixtures from a structural design perspective.
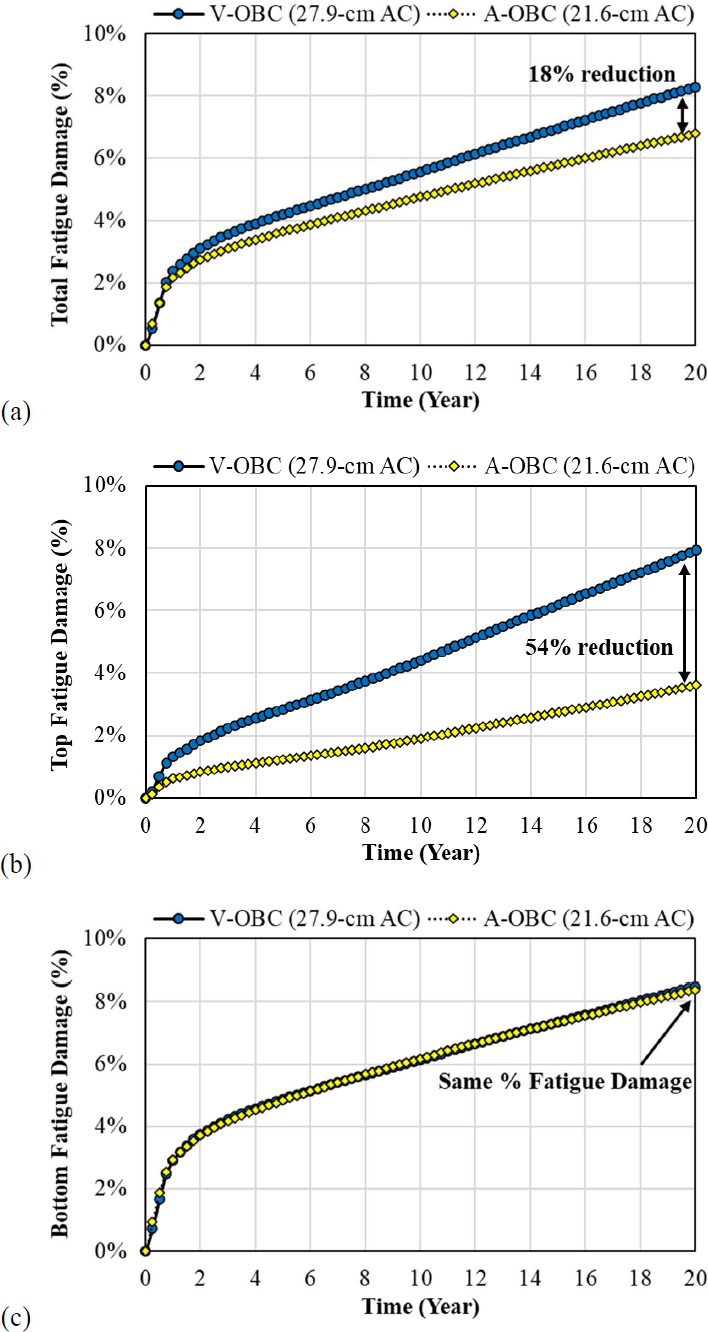
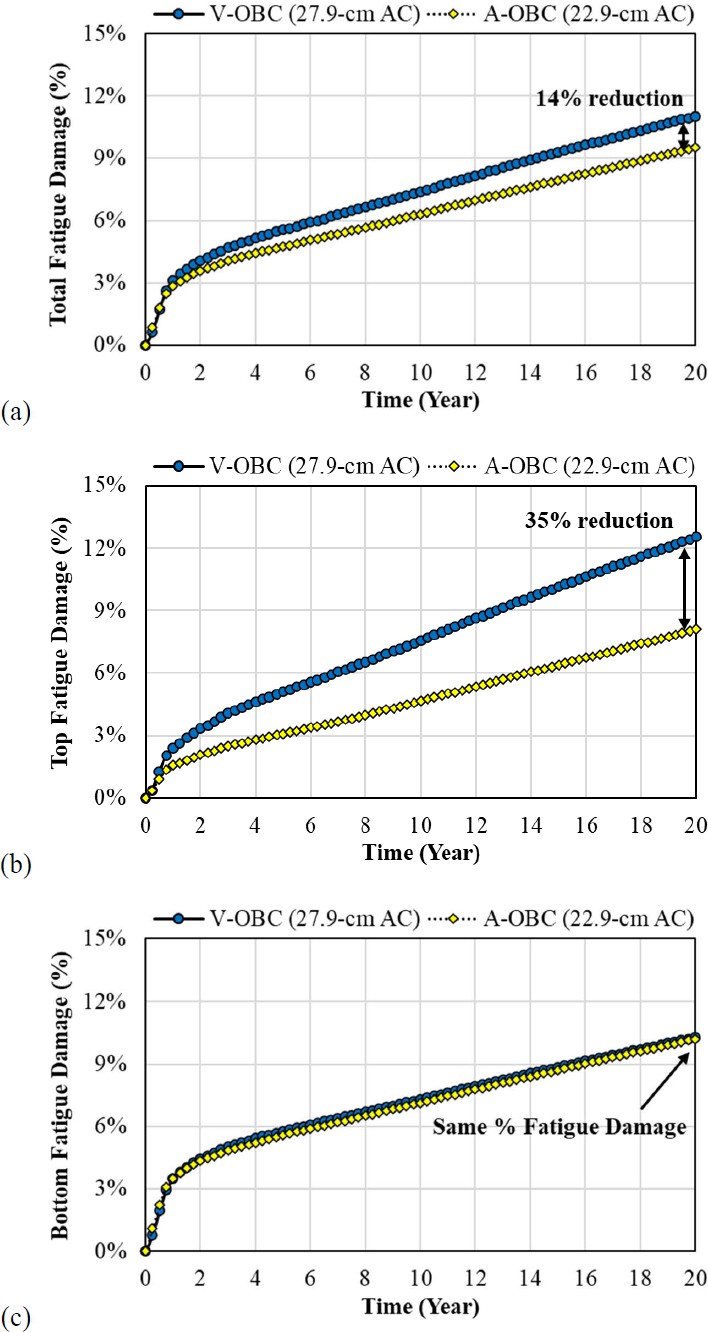
Figure 43 and Figure 44 present the predicted fatigue damage progression for Wisconsin high-RAP/RAS asphalt mixtures with PG 58S-28 and PG 58V-28 binders, respectively. For the PG 58S-28 binder, the mixture showed a 3% increase in total fatigue damage at the end of service life at A-OBC compared to V-OBC, indicating that adding additional virgin binder at a reduced RBA level did not improve cracking performance. In contrast, the mixture with PG 58V-28 binder demonstrated significant improvements at A-OBC, with a 44% reduction in total fatigue damage, a 50% reduction in top fatigue damage, and a 40% reduction in bottom fatigue damage relative to V-OBC. Additional FlexPAVE simulations for this mixture showed that the asphalt layer thickness at A-OBC could be reduced to 19.1 cm to achieve equivalent bottom fatigue damage while maintaining significantly less top fatigue damage compared to the V-OBC mixture with a 27.9 cm asphalt layer (Figure 45). This corresponds to a 32% reduction in asphalt layer thickness from a pavement structural perspective.


3.4 RBA Cost Impact Analysis Findings
This section presents the results and findings from evaluating the RBA cost impact for four high-RAM asphalt mixtures prepared using two mix designs and two virgin binders.
3.4.1 Material Cost Comparison Results
Figure 46 presents the material cost comparison results. For Georgia high-RAP asphalt mixtures, adding 1.0% virgin binder at 48% RBA increased costs by $6.5 per metric ton with PG 64-22 binder and $8.3 per metric ton with PG 76-22 PMA binder, representing an approximately 15% increase from V-OBC to A-OBC. For the Wisconsin high-RAP/RAS asphalt mixture with PG 58S-28 binder, adding 0.6% virgin binder at 65% RBA increased costs by $4.1 per metric ton (or about 9%), while adding 0.7% virgin binder at 58% RBA increased costs by $6.5 per metric ton (or about 12%) with PG 58V-28 PMA binder.

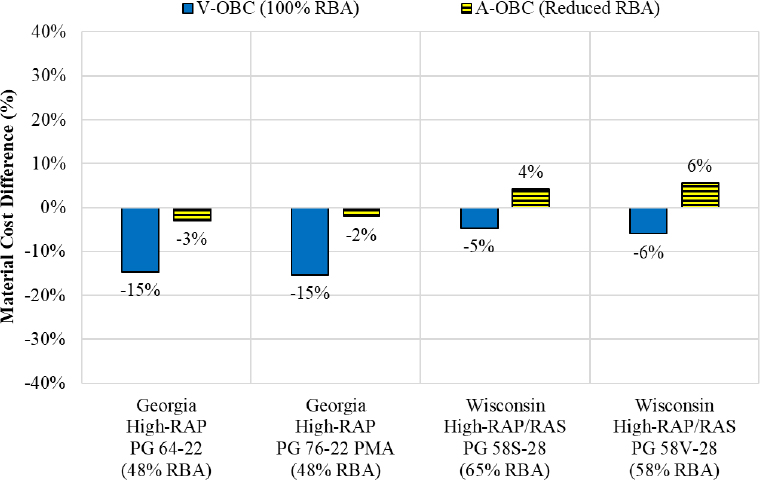
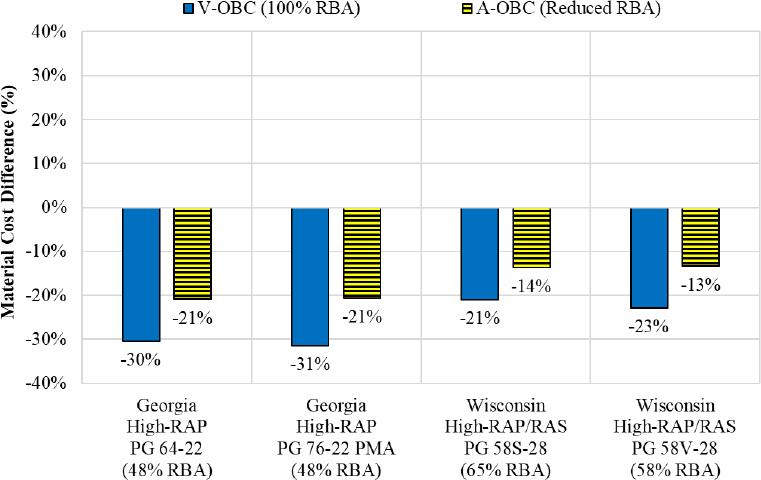
Figure 47 and Figure 48 compare the relative material cost differences between the high-RAM asphalt mixture and two references: a typical 25% RAP asphalt mixture at 100% RBA and a virgin asphalt mixture using the same virgin binder. A negative percentage indicates that the high-RAM asphalt mixture is more cost-effective, while a positive percentage indicates that the reference asphalt mixture is more cost-effective. The results in Figure 47 show that for Georgia high-RAP asphalt mixtures, using 40% RAP at 100% RBA was approximately 15% less expensive than using 25% RAP at 100% RBA. At 48% RBA, the 40% RAP asphalt mixtures were comparable in cost to the 25% RAP asphalt mixtures. For Wisconsin high-RAP/RAS asphalt mixtures, using 16% RAP and 4% RAS at 100% RBA was 5% to 6% more cost-effective than using 25% RAP at 100% RBA, although these mixtures became slightly more costly at a reduced RBA level. The comparison against virgin asphalt mixtures in Figure 48 consistently shows substantial savings for high-RAM asphalt mixtures at both 100% RBA and reduced RBA levels.
3.4.2 Life-Cycle Cost Analysis Results
Figure 49 and Figure 50 present the LCCA results, expressed as net present value (NPV) per lane kilometer, for Georgia high-RAP and Wisconsin high-RAP/RAS asphalt mixtures, respectively. Due to higher material costs, mixtures at A-OBC showed considerably higher NPVs than those at V-OBC when assuming identical overlay life. However, adding more virgin binder to account for a reduced RBA level can potentially extend the lifespan of high-RAM asphalt mixtures because of improved cracking resistance. This life extension may result in life-cycle cost savings by reducing the frequency or delaying the application of future overlays within the analysis period.


The horizontal shift between the two curves in Figure 49 and Figure 50 represents the minimum overlay life extension required to offset the higher material costs of the mixture at A-OBC compared to V-OBC. For example, assuming the Georgia high-RAP asphalt mixture with a PG 64-22 unmodified binder at V-OBC had an overlay life of 12 years, its NPV was approximately $125,000 per lane kilometer for the resurfacing project, as shown in Figure 49(a). To achieve a lower NPV, the mixture at A-OBC would need an overlay life of 14 years or longer. In this scenario, a minimum of a two-year life extension was necessary to make A-OBC more cost-effective than V-OBC.
Table 23 presents the estimated life extension required for a mixture at A-OBC to achieve the same NPV as the corresponding mixture at V-OBC. Georgia high-RAP asphalt mixtures would need approximately two to three years of additional service life to justify the life-cycle costs of adding extra virgin binder at a reduced RBA level. For Wisconsin high-RAP/RAS asphalt mixtures, the required life extension ranged from one to four years, depending on the virgin binder type and the service life of the mixture at V-OBC. FlexPAVE simulation results discussed previously
suggest that these life extension targets are likely attainable for all mixtures except the Wisconsin high-RAP/RAS asphalt mixture with PG 58S-28 binder. This finding should be validated through field projects that compare pavement performance of high-RAM asphalt mixtures at A-OBC versus V-OBC under specific traffic and climate conditions.
| Service Life at V-OBC (Year) | Life Extension Required for A-OBC Compared to V-OBC (Year) | |||
|---|---|---|---|---|
| Georgia High-RAP Mixtures | Wisconsin High-RAP/RAS Mixtures | |||
| PG 64-22 | PG 76-22 PMA | PG 58S-28 | PG 58V-28 PMA | |
| 10 | 1.7 | 1.9 | 1.3 | 1.7 |
| 12 | 2.0 | 2.4 | 1.6 | 2.1 |
| 14 | 2.6 | 3.0 | 1.9 | 2.6 |
| 16 | 2.9 | 3.3 | 2.5 | 3.4 |
| 18 | 2.8 | 3.2 | 2.9 | 3.7 |
| 20 | 2.3 | 2.6 | 2.7 | 3.4 |


