New Strategies for America's Watersheds (1999)
Chapter: Color Plates
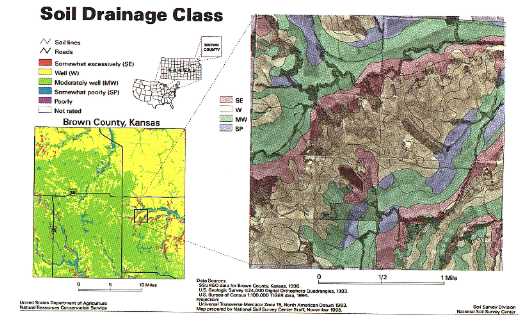
Plate 2:
Geographic information systems (GIS) can provide access to information across multiple scales, giving decisionmakers both an overall view of the issue and specific information to guide site-specific planning. This map of soil drainage class combines information about topography and land use with soil drainage characteristics to provide a detailed, field-by-field perspective on drainage patterns. Farmers can use such maps to plan cropping systems and minimize erosion potential as well as groundwater vulnerability. This image shows field boundaries and water retention dams in Brown County, Kansas. Photo image tones can be seen through the soil drainage class thematic overlay in shades of red, yellow, green, and blue. SOURCE: Brown County, Kansas Soil Survey Geographic Data Base (SSURGO), 1996. USDA-Natural Resources Conservation Service, Salina, Kansas.
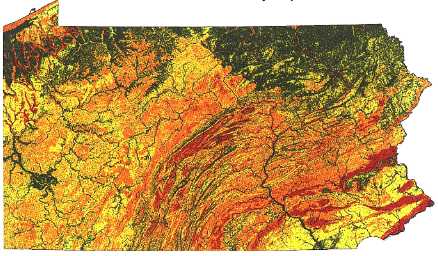
Plate 3:
Geographic information systems (GIS) make decisionmaking more efficient and can help reduce the costs of environmental protection. For instance, as a result of regulatory requirements, water suppliers must test their source waters for a substantial list of possible chemical contaminants unless they can clearly justify that there is no reason to do so. In an effort to obtain a waiver for a suite of synthetic organic chemicals (most related to pesticide use), resource managers in Pennsylvania developed a strategy to determine the likelihood of a pesticide being applied in a given area and a measure of the risk posed. Using the location of all water supply facilities, they developed a GIS strategy that incorporated the amount of agricultural land, the most likely crops crown, and water movement through the environment (based on terrain factors such as geology, soil type, and topography). The result was this map of inherent ground water vulnerability. The map shows clearly where certain pesticides were not in use, and thus provides scientific support for waiving the testing of certain potentially problematic chemicals. This combined watershed and GIS initiative saved Pennsylvania taxpayers $7 million. (SOURCE: Barry Evans, Environmental Resources Research Institute, The Pennsylvania State University.)
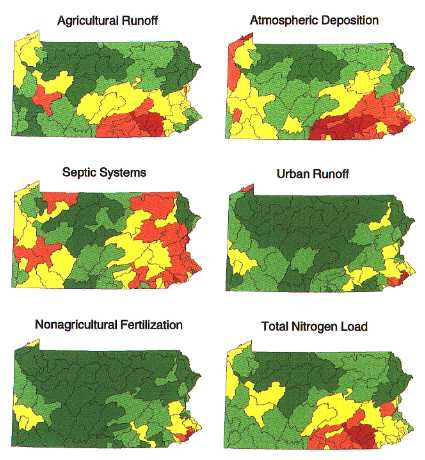
Plate 4:
Geographic information systems (GIS) can be used to compile information in ways to help decisionmakers set priorities. In Pennsylvania, for example, legislation requires increased control of nitrogen and phosphorus as part of a multi-state effort to control nutrient loads to the Chesapeake Bay. But to reduce its contributions, Pennsylvania needed to understand the base levels of each pollutant in surface and ground water. The Department of Environmental Protection used a GIS strategy to quantify loads in different watersheds and estimate the fraction contributed by different nonpoint sources. With this information, the state developed mitigation strategies to address the most significant contributors. These maps show the nitrogen loads (in kg/ha) delivered to surface water by source category. Dark green indicates the lowest per unit area loads and dark red indicates the highest loads. (SOURCE: Barry Evans, Environmental Resources Research Institute, The Pennsylvania State University.)


