Review of Northeast Fishery Stock Assessments (1998)
Chapter: D. Presentation to the Committee by NMFS Scientists
Appendix DPresentation to the Committee by NMFS Scientists (9 July, 1997, Bedford, Massachusetts)
Agenda
Time | Issue | Presenter |
10:00-10:10 | Overview, Introductions | M. Sissenwine |
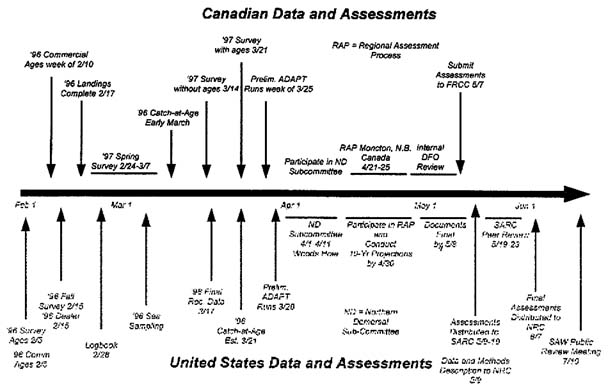
10:10-10:20 | Stock Assessment Workshop Process, Terms of Reference, Interaction with Canadian Process | E. Anderson |
10:20-10:45 | Generic Issues: Databases, Survey Calibration, Assessment, and Prediction Methods | S. Murawski |
| Assessments Inputs, Assumptions, Results, and Research Recommendations | S. Murawski |
10:45-11:00 | Georges Bank Haddock | R. Mayo |
11:00-11:15 | Georges Bank Cod | R. Mayo |
11:15-11:30 | Gulf of Maine Cod | R. Mayo |
11:30-11:45 | Southern New England Yellowtail Flounder | W. Overholtz |
11:45-12:00 | Georges Bank Yellowtail Flounder | W. Overholtz |
12:00-12:45 | Lunch |
|
12:45-1:15 | Management Advice, Context with Previous Assessments, A#7/A#5, Canadian Management | M. Sissenwine |
1:15-1:45 | Questions and Discussion |
|
Information Presented
| SAW-24 Agenda |
NORTHEAST REGIONAL STOCK ASSESSMENT WORKSHOP (SAWPROCESS) • Steering Committee • Working Groups • Stock Assessment Review Committee (SARC) • Public Review Workshop | • Stocks –Gulf of Maine Cod –Georges Bank Cod –Georges Bank Haddock –Georges Bank Yellowtail Flounder –Southern New England Yellowtail Flounder of estimates of stock abundance and fishing mortality rates • Terms of Reference –Assess the stock status through 1996 and characterize the variability –Provide projected estimates of catch for 1997-1998 and SSB for 1998-1999 at various level of F, including all relevant biological reference points –Advise on the assessment and management implications of incorporating recreational catch and commercial discard data in the assessment |
Generic Assessment Issues I | Generic Assessment Issues II |
• Assessment Databases –Changes in Landings Data Collection System –Proration of Landings to Stock Area –Effort & CPUE/LPUE –Rates of Biological Sampling of the Catch –Discard Estimates • Survey Calibration Studies –Vessel/Door/Net Changes over Time –Estimation of Calibration Coefficients –Effects of Alternative Estimation Methods | Uncertainty in Assessments < Bootstrap Estimates of Precision in ADAPT < Sensitivity of Assessment Results to Potential Biases < Explicit vs. Implicit Sources of Uncertainty < Conveying Uncertainty to Managers Medium-Term Projections < Utility of Results < Stock Rebuilding Targets < Estimation Methods < Presentation of Results |
Georges Bank Haddock Research Recommendations
Improve biological sampling of U.S. commercial landings and discards.
Examine the effects of large tows on overall and age-specific abundance indices, specifically with reference to closed areas.
Examine effects of abrupt changes in mean weights during the 1990s, specifically with respect to the 1989-1991 year classes in the eastern part of Georges Bank.
Investigate factors associated with apparent recent improvements in survival ratios (R/SSB).
Georges Bank Cod Issues in Assessment
Data Used:
ANALYTICAL, Age structured assessment
ADAPT VPA Calibration of age 1-10+catch at age, 1978-1996
NEFSC spring and autumn RV indices (1978-1996)
Canadian DFO spring RV indices (1986-1997)
CAA estimated for recreational landings 1981-1996
Discard ratios estimated for 1989-1996
CAA:
Commercial: sufficient age/length data not available prior to 1978
1994-1996 sampling poorest since 1982, notably in ''large" market category.
1996 "scrod" and "market" samples greater than 1995 samples
Recreational: derived from very few length samples, 1981-1996
Sensitivity Runs:
Recreational (1981-1996): slightly higher stock size, with similar [Text incomplete in source] and SSB as base run
LPUE (1978-1996): lower stock size and higher F than final run
Other issues:
Transboundary stock: use Canadian CAA and RV survey
Canadian RV survey indices for 1993 and 1994 not used (lack of coverage)
LPUE not used as in previous assessments (1994-1996 data unreliable)
Discards not incorporated: lack of samples, 1978-1988
Recreational not used: poor sampling, lack of samples, 1978-198[Text incomplete in source]
Georges Bank Cod Assessment Summary
Current landings (1996) = 8,900; up from 7,900 mt in 1995
Survey indices fluctuate near record-low values
LPUE declined by 1993 to the lowest LPUE in time series
VPA results
Current F(1996) = 0.17
Current SSB(1997) = 46,400 t
Shift to older ages in PR
Mean F (4-8, u) declined from record-high in 1994 to record-low in 1996
Record-low recruitment of the 1994-1996 year classes
Yield and SSB per Recruit Model
F0.1= 0.17
Fmax= 0.32
F20%= 0.43
Projections
Short term: At status quo F, landings in 1998 (8,400 t) remain stable, SSB increases 35% during 1996 (41,200 t) to 1999 (55,000 t) Higher F scenarios initially increase landings and SSB, with subsequent declines
Medium term: 1998 to 2006 Landings increase from 8,200 mt to 29,400 mt SSB improves from 53,700 mt to 199,900 mt Median recruitment increases from 14 million to 34.4 million
CONCLUSIONS
Stock remains in overexploited state with low biomass
Recruitment of three most recent year classes at record low
SSB remains near record low value
Current F(96) nearly equal to F0.1
Georges Bank Cod Research Recommendations
Further investigate the effect of closed areas on the use of LPUE as an index of abundance, specifically examine the impact of change in fleet distribution as a result of progressive exclusion from the Canadian zone and then from Closed Area II.
Further investigate the basis for deriving the recreational component of the cod catch. Specifically, the effect of sampling levels in the party and charter categories at age can be used to augment the commercial landings at age in the VPA.
Further examine discard rates in years prior to 1989 before discard data can be incorporated into the catch at age.
Gulf of Maine Cod Assessment Issues — I Data Used
CURRENT ASSESSMENT
ANALYTICAL (Age Structured)
ADAPT VPA Calibration of Age 2-7+ CAA, 1982-1996
ANALYTICAL (Age Structured)
ADAPT VPA Calibration of Age 2-7+ CAA, 1982-1996
1996 landings were 7,200 t; up from 6,800 t in 1995
Sample summary
1994-1995 sampling improved over 1993, but low re: landings
1996 much improved
Catch at Age
Reduction in proportion of older 9>7 yr) ages and few fish >9 yr after 1990
1992 year class 62% by number, 57% by weight in 1996
Commercial LPUE
LPUE declined in 1993 to pre-1989 level; not used in 1994-1996
Survey Indices
Low number and weight per tow persist through autumn 1996
Low recruitment indices in NEFSC and Massachusetts DMF surveys in 1995 and 1996
Survey Zx 1.1 in 1991-1993 and 1994-1996
VPA Calibration
Unusual F pattern in 1994 for fully recruited ages 4 and 5
Record low recruitment of 1994 and 1995 year classes <1 million fish
Gulf of Maine Cod Assessment Issues — II Quality of CAA
Commercial CAA
Catch at Age
Majority of catch at ages 3 and 4 (by number) and ages 4 and 5 (by weight)
Reduction in proportion of older (>7 yr) ages and few fish > [Text incomplete in source] yr after 1990
1992 year class 62% by number, 57% by weight in 1996
High mean wts. at age in 1995 at ages 5 and 6 ==> Low Numbers may have influenced high F at age 4 and 5 in 1994
Sampling Intensity
Poor sampling in 1993
1994-1995 sampling improved, but low for older ages (Large market category)
Overall improvement in 1996
Recreational CAA
Catch at Age
Length composition indicates higher proportion of smaller fish compared to commercial catch
Majority of catch at ages 2 and 3 (by number) and ages 3 and 4 (by weight)
Note: Commercial age/length key used to distribute number at length to numbers at age
Sampling Intensity
Generally fewer than 1,000 (often <500) fish measured per year
Length data (and age) samples pooled on annual basis
Gulf of Maine Cod Assessment Issues—III Alternative Runs
Six alternative assessment models using Stock Synthesis Approach (Fournier and Archibald, 1982)
Employed same survey indices as ADAPT
Included commercial CAA alone and commercial and recreational CAA
Lognormal, multinomial, and robust error structure assumptions
Lognormal model results
Log-normal error structure most closely approximated ADAPT/VPA
1996 and 1997 Fs for fully recruited ages were estimated to be approximately 1.0
Recent recruitment (1994 and 1995 year classes) poorest ever in both analyses
SSB declining sharply since 1989, remaining lowest ever through 1997
Multinomial model results
Better fit to older ages and slightly lower Fs
Lower Fs at older ages in earliest years
Slightly lower Fs in recent years at all ages
Slightly better recruitment of 1994 and 1995 year classes
Marked increase in catchability by the fishery over time
Robust likelihood results similar to multinomial, but with very high Fs at older ages since 1988
Conclusions
All model formulations produce results similar to ADAPT/VPA:
Sharp decrease in SSB since 1989
Poorest recruitment on record for 1994 and 1995 year classes
F on fully recruited ages has remained at or above 1.0 since early 1980s
Gulf of Maine Cod Assessment Issues — IV Sensitivity Runs
Four Sensitivity Runs (including final)
Two with commercial CAA alone
Two including recreational CAA
VPA results
1996 terminal F for fully recruited ages ranged from 0.96 to 1.04 (essentially 1.0)
Recruitment estimates slightly higher when recreational CAA included
Recent recruitment (1994 and 1995 year classes) poorest ever in all runs
Retrospective patterns in recruitment not persistent
SSB remains low in all runs
Final VPA calibration used commercial CAA alone due to
poor sampling of recreational CAA
uncertain allocation of recreational cod catch between Gulf of Maine and Georges Bank
Gulf of Maine Cod Assessment Summary
Current landings (1996) = 7,200 t
LPUE declined sharply in 1992, remained low in 1993-1996
Survey Indices remain close to record-low levels in 1995-1996
VPA results
current F(1996) = 1.04
current SSB(1996) = 9,200 t
Yield and SSB per Recruit Model
F0.1 = 0.16
Fmax = 0.29
F20% = 0.37
Projections
At status quo F, SSB declines to unprecedented record low
Landings decline in 1998 under all F scenarios
SSB increases over the medium term at Fmax (0.29) to 13,000 t
CONCLUSIONS
The stock is overexploited, current F(1996) is well above Fmax and about 3X F20%
Spawning stock biomass is at a record low level and is projected to decline further in 1998 and 1999
Gulf of Maine Cod Research Recommendations
Further investigation of the changes in effort and LPUE in the VTR data set is required before LPUE can be used to calibrate VPA.
Further investigation of the basis for deriving the recreational component of the cod catch, specifically the effect of sampling levels in the party and charter categories, is required before the recreational landings at age can be used to augment the commercial landings at age in the VPA.
Further examination of discard rates in years prior to 1989 is required before discard data can be incorporated into the catch at age.
SNE Yellowtail Flounder Assessment Issues
Commercial Landings 1973-1996
Collect data for quarterly estimation
Per capita sampling adequate 1973-1996
Commercial Discards 1973-1996
Need adequate sea sampling
VTR discard ratios
Survey Indices 1973-1996:Spring, Autumn, Scallop
SNE Yellowtail Flounder Assessment Summary
Fishing Mortality:F0.1=0.27, F96=0.12, below reference point in 1996
Spawning Stock Biomass:SSB-threshold=10,000 mt, SSB97=5,000 mt, below threshold, but increasing
Short-term:stock improving, could reach 8,000 mt SSB by 1999 at F=0.12
Medium-term:stock should rebuild if fishing rate remains low
SNE Yellowtail Flounder Research Recommendations
Improve sea sampling coverage on trawl and scallop vessels.
Increase sampling frequency on research surveys.
Improve commercial length and age samples.
Examine VTR data for mesh-specific discard ratios.
Evaluate changes in maturity at age in recent years.
Evaluate performance of the scallop survey as a tuning index.
Evaluate winter survey as a tuning index.
Georges Bank Yellowtail Flounder Issues in the Assessment
Data in the assessment:1973-1996 U.S. and Canadian commercial landings and discards (recreational catch is negligible), U.S. spring and fall trawl survey indices, U.S. scallop survey indices, and Canadian trawl survey indices.
Quality of Catch at Age:
Age composition by quarter and statistical area not available 1994-1996. Catches characterized semiannually for the entire stock area.
Sexually dimorphic growth not considered in estimates of catch at age.
Sensitivity Runs:Log-transformed survey indices and removal of uncertain age-1 discard estimates. Results and diagnostics similar among all sensitivity runs.
Alternative Methods:Biomass dynamics model (ASPIC) using total catch (1963-1996), U.S. spring and fall survey indices, and the Canadian survey index of biomass. Magnitude and temporal pattern of mean biomass and F similar to those from VPA.
Georges Bank Yellowtail Flounder Assessment Summary
F and SSB Trends:
F averaged 1.2 during 1973-1994 and decreased to 0.1 in 1996
SSB was 21,000 mt in 1973, declined to less than 4,000 mt during 1984-1988, fluctuated below 6,000 mt from 1989 to 1994, and increased to 11,700 mt in 1996
Probability Distributions for F and SSB in 1996:
80% chance that F was between 0.08 and 0.14, and nearly 0% probability that F exceeded F0.1 (0.25)
80% chance that SSB was between 9,800 and 14,600 mt, and 12% probability that SSB was below the rebuilding threshold of 10,000 mt
Projections:
At F0.1, landings and SSB will continue to increase in the next three years. At F96, landings will decrease slightly in 1997, then increase in 1998 and 1999, and SSB will continue to increase in the next three years.
At F0.1, landings will increase to 8,400 mt in 2006, and SSB will increase to 46,200 mt in 2006. At F96, landings will increase to 5,500 mt in 2006, and SSB will increase to 71,600 mt in 2006.
Georges Bank Yellowtail Flounder Research Recommendations
Extending the VPA back to the 1960s should be explored.
Changes in maturity should be closely monitored.
The NEFSC winter survey should be modified to ensure coverage of Georges Bank.
Evaluate the feasibility of sex identification in all field sampling to estimate catch at age and survey indices by sex.
The number of ages in the VPA should be expanded.
|
|
| STOCK LEVEL |
|
| |
| ||||||
|
|
| LOW | MEDIUM | HIGH |
|
|
| OVER EXPLOITED | REDUCE EXPLOITATION REBUILD STOCK | REDUCE EXPLOITATION AGE DISTRIBUTION | REDUCE EXPLOITATION, INCREASE YIELD PER RECRUIT |
|
EXPLOITATION STATUS |
|
| ||||
|
| FULLY EXPLOITED | REDUCE EXPLOITATION, REBUILD STOCK LEVEL | MAINTAIN EXPLOITATION RATE AND YIELD | MAINTAIN EXPLOITATION RATE AND YIELD |
|
|
| UNDER EXPLOITED | MAINTAIN LOW EXPLOITATION WHILE STOCK REBUILDS | INCREASE EXPLOITATION SLOWLY | INCREASE EXPLOITATION, REDUCE STOCK LEVEL |
|
| ||||||
Stock Status Summary
| ||||
| Current Fishing Mortality | 1994-1996 Recruitment | 1994-1996 SSB | Biomass Threshold |
Gulf of Maine Cod | Well Above Target | Low | Low/ Declining | Threshold Not Defined |
Georges Bank Cod | Near Target | Low | Low/ Increasing | Well Below |
Georges Bank Haddock | Below Target | Low | Low/ Increasing | Well Below |
Georges Bank Yellowtail | Below Target | Average | Low/ Increasing | Near |
SNE Yellowtail | Below Target | Low | Low/ Increasing | Below |
Sarc 24 Advisory Overview
The Situation for Georges Bay Cod, Haddock & Yellowtail, and SNE Yellowtail Has Improved; Gulf of Maine Cod is Unchanged
Except for GM Cod, F Has Been Reduced BELOW Overfishing Reference Points & is NEAR Rebuilding Fs
Except for GM Cod, Some Rebuilding of SSB has Occurred. GB Yellowtail is near SSB Threshold, but SSB for all Stocks is LOW relative to Historical Levels & BMSY
Recruitment in Recent Years Remains LOW Relative to Historic Levels
Short-Term Projections Indicate Maintenance or Modest Increases in SSB at Current Fs, Except for GM Cod
Strong Management Measures Are Warranted for GM Cod to Reduce the Risk of Stock Collapse
Continued Rebuilding of Four Stocks Will Be Jeopardized if Fishing Mortality Rates Are Allowed to Increase
Efforts to Reduce F for GM Cod Should NOT Come at the Expense of Other Heavily Exploited Stocks in the Gulf of Maine or Elsewhere


