Operational and Service Factors When Integrating or Consolidating ADA Paratransit and On-Demand Services (2025)
Chapter: 3 Survey Results

CHAPTER 3
Survey Results
This chapter contains the results from the survey of transit agencies about their own integrations or consolidations of ADA or coordinated paratransit and on-demand microtransit services. The research team assembled a list of 58 total transit agencies or governmental entities identified through the industry scan as either potentially having or confirmed as having commingling of paratransit and general public trips in on-demand microtransit service. The identified agencies included a range of agency sizes and geographic settings (including 7 located in Canada) as well as a variety of microtransit software platform partners. The research team sent an initial outreach email on the upcoming survey research to the identified agency contacts, upon which the list was trimmed down to 55 after 3 agencies confirmed they were not currently or not commingling trips and would not be able to complete the survey.
Invitations and instructions for the survey were then sent to the trimmed-down list and follow-ups were conducted by the research team to ensure completion by as many recipients as possible. A total of 34 responses to the survey were received; of these, 2 were either invalid or not eligible, 2 more provided partial responses but not enough information for further analysis, and 6 were duplicative responses by the same agency (in which cases either the latest or most complete response was selected for further analysis). This data cleaning process left a total of 24 usable responses (22 fully complete, 2 partial but mostly complete) for the analysis of survey results detailed in this chapter.
Introduction
In the introduction section of the survey, respondents were provided with information about the research project and a preview of the types of topics and questions they would expect to see regarding paratransit and commingling trips in microtransit service. Once the respondent agreed to participate, the survey confirmed their name and affiliation. The respondents were then provided further background information about the research projectʼs areas of interest and clarifications on what types of integrations or consolidations counted as commingled trips (namely, that two different trip types may be served in the same vehicle simultaneously rather than in separate vehicles). The introduction also provided further definitions of terms to be used in the following survey sections and examples of what types of services were not considered to be providing commingled trips.
The survey then questioned the respondents on whether their agency currently has or previously had any integration or consolidation of paratransit with on-demand microtransit service as described earlier; 17 respondents indicated they currently did and 1 other respondent indicated they previously had done an integration or consolidation. The other 6 respondents indicated they did not have integrated or consolidated services, meaning that they would be taken to the
end of the survey and not asked any additional questions. This left 18 remaining respondents whose survey answers are discussed in the analysis in this chapter.
Service Designs and Parameters
Respondents clarified whether their services were consolidated or integrated according to the following definitions:
- Consolidated service is when one uniform fleet (using the same vehicle type [broadly, as opposed to specific make/model] for the entire fleet), one set of drivers (all ADA paratransit–certified), and the same scheduling software is used to serve both ADA paratransit and microtransit service.
- Integrated service is when the services use either different vehicle fleets, different sets of drivers, and/or different software platforms from each other, but some trips are commingled together.
Consolidated services were represented by 11 respondents while integrated services were represented by the remaining 7 respondents; of the integrated services, 4 used different sets of vehicles, 3 used different sets of drivers, and 2 used different software platforms between the paratransit and microtransit services.
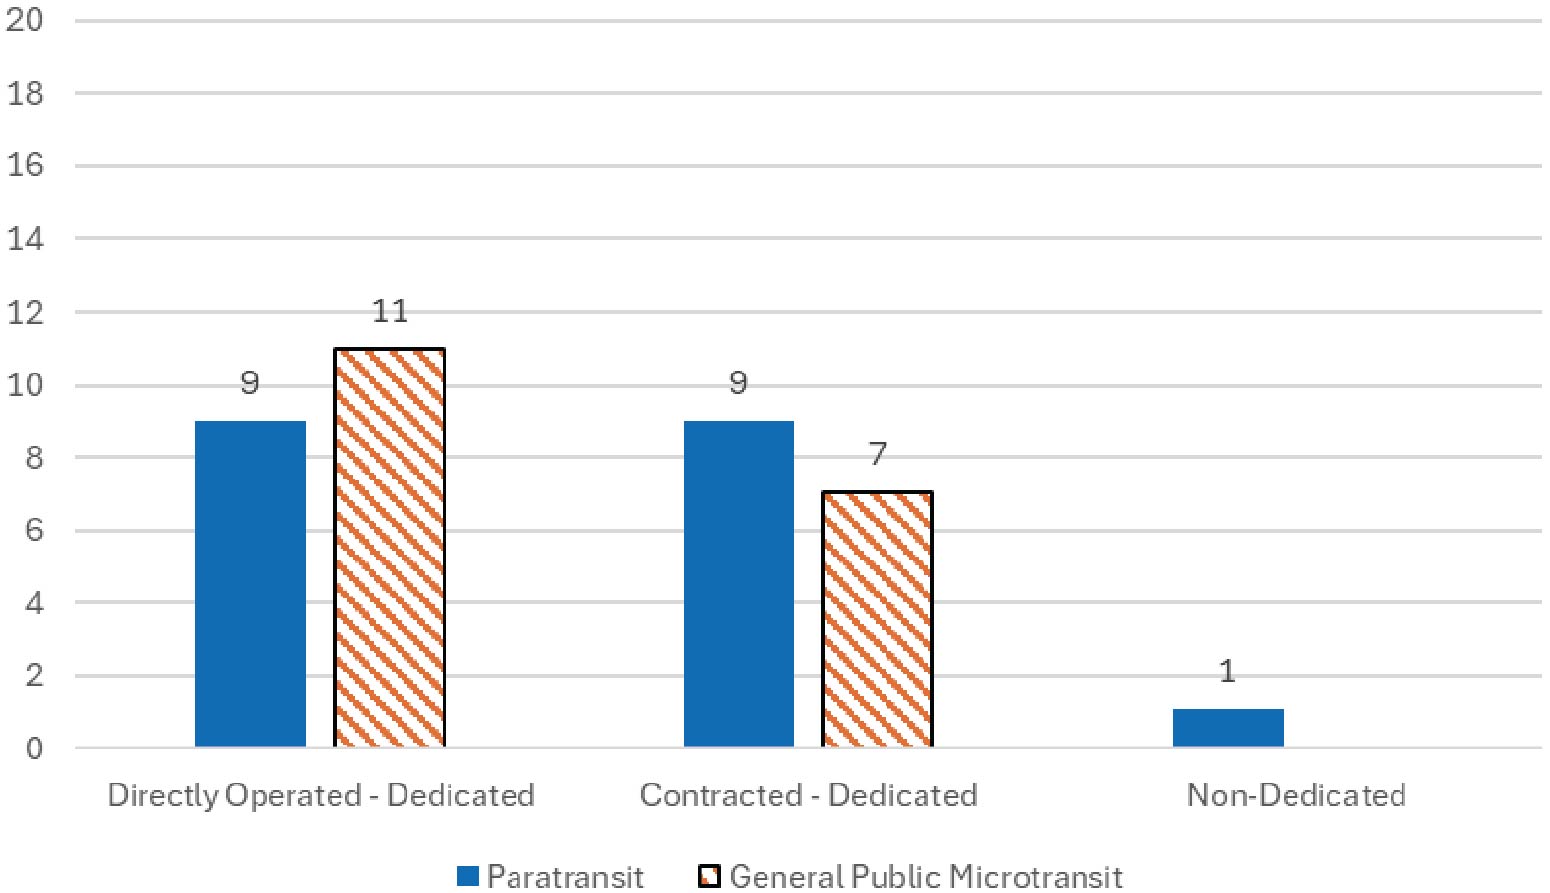
Respondents next clarified the names of the service operators involved in paratransit and/or microtransit service, whether their dedicated service used contracted providers, whether non-dedicated service providers were involved in the service design, and what the roles and responsibilities of these other providers were. Respondents provided the names of the service operators in a table format; Figure 4 shows the consolidated results from the set of 18 relevant agencies. Directly operated and contracted-dedicated services were frequently used for paratransit and general public microtransit service, while non-dedicated providers were used by one paratransit service (6 percent).
Long Description.
The horizontal axis shows three sets of two bars. The three sets represent types of service operators. In each set, the bars represent Paratransit and General public microtransit, respectively. The vertical axis shows the number of questionnaire responses from 0 to 20 in increments of 2. The data given in the graph are as follows: Set 1, Directly Operated-Dedicated: 9, 11. Set 2, Contracted-Dedicated: 9, 7. Set 3, Non-dedicated: 1, 0.
Long Description.
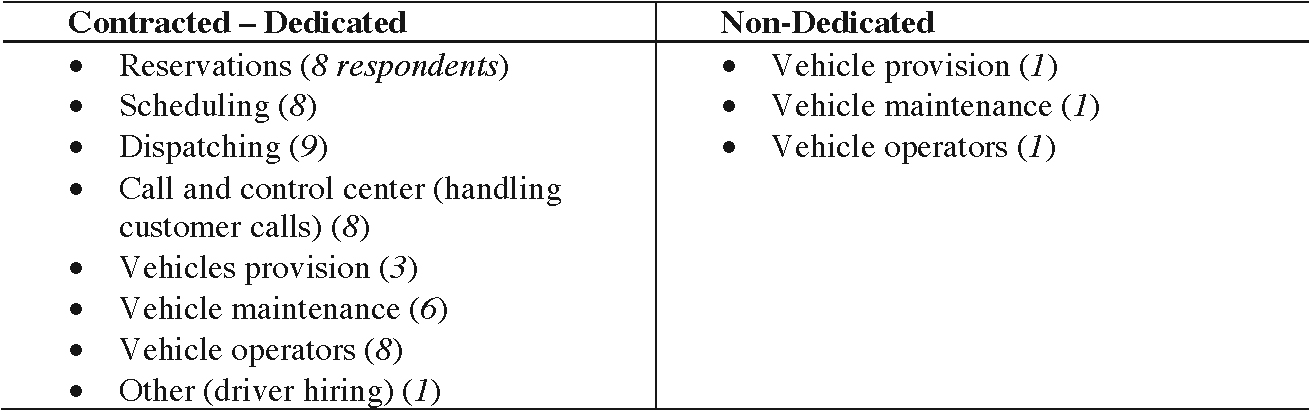
The table has two sections. The left section is titled 'Contracted – Dedicated' and lists the following: Reservations (8 respondents); Scheduling (8; Dispatching (9); Call and control center (handling customer calls) (8); Vehicles provision (3); Vehicle maintenance (6); Vehicle operators (8); Other (driver hiring) (1). The right section is titled 'Non-Dedicated' and lists the following: Vehicle provision (1); Vehicle maintenance (1); Vehicle operators (1).
Responsibilities of contracted-dedicated service providers and non-dedicated service providers in these services as indicated by respondents is show in Table 1. Dispatch, reservations, scheduling, call and control center, and vehicle operators were selected by 8 to 9 respondents with contracted dedicated services. The respondent using a non-dedicated service provider for paratransit indicated that the provider is responsible only for vehicle provision, vehicle maintenance, and vehicle operators. The implication is that any roles and responsibilities not fulfilled by the partners or providers are handled by the agency themselves.
The survey next asked respondents about the names of the software platforms they use for paratransit and/or general public microtransit services, and whether these platforms were applicable to directly operated-dedicated, contracted-dedicated, or non-dedicated service provision. The software platform companies named included RideCo, Routematch, The Routing Company, Spare Labs, Trapeze, TripShot, and Via.
Goals for Commingling Trips
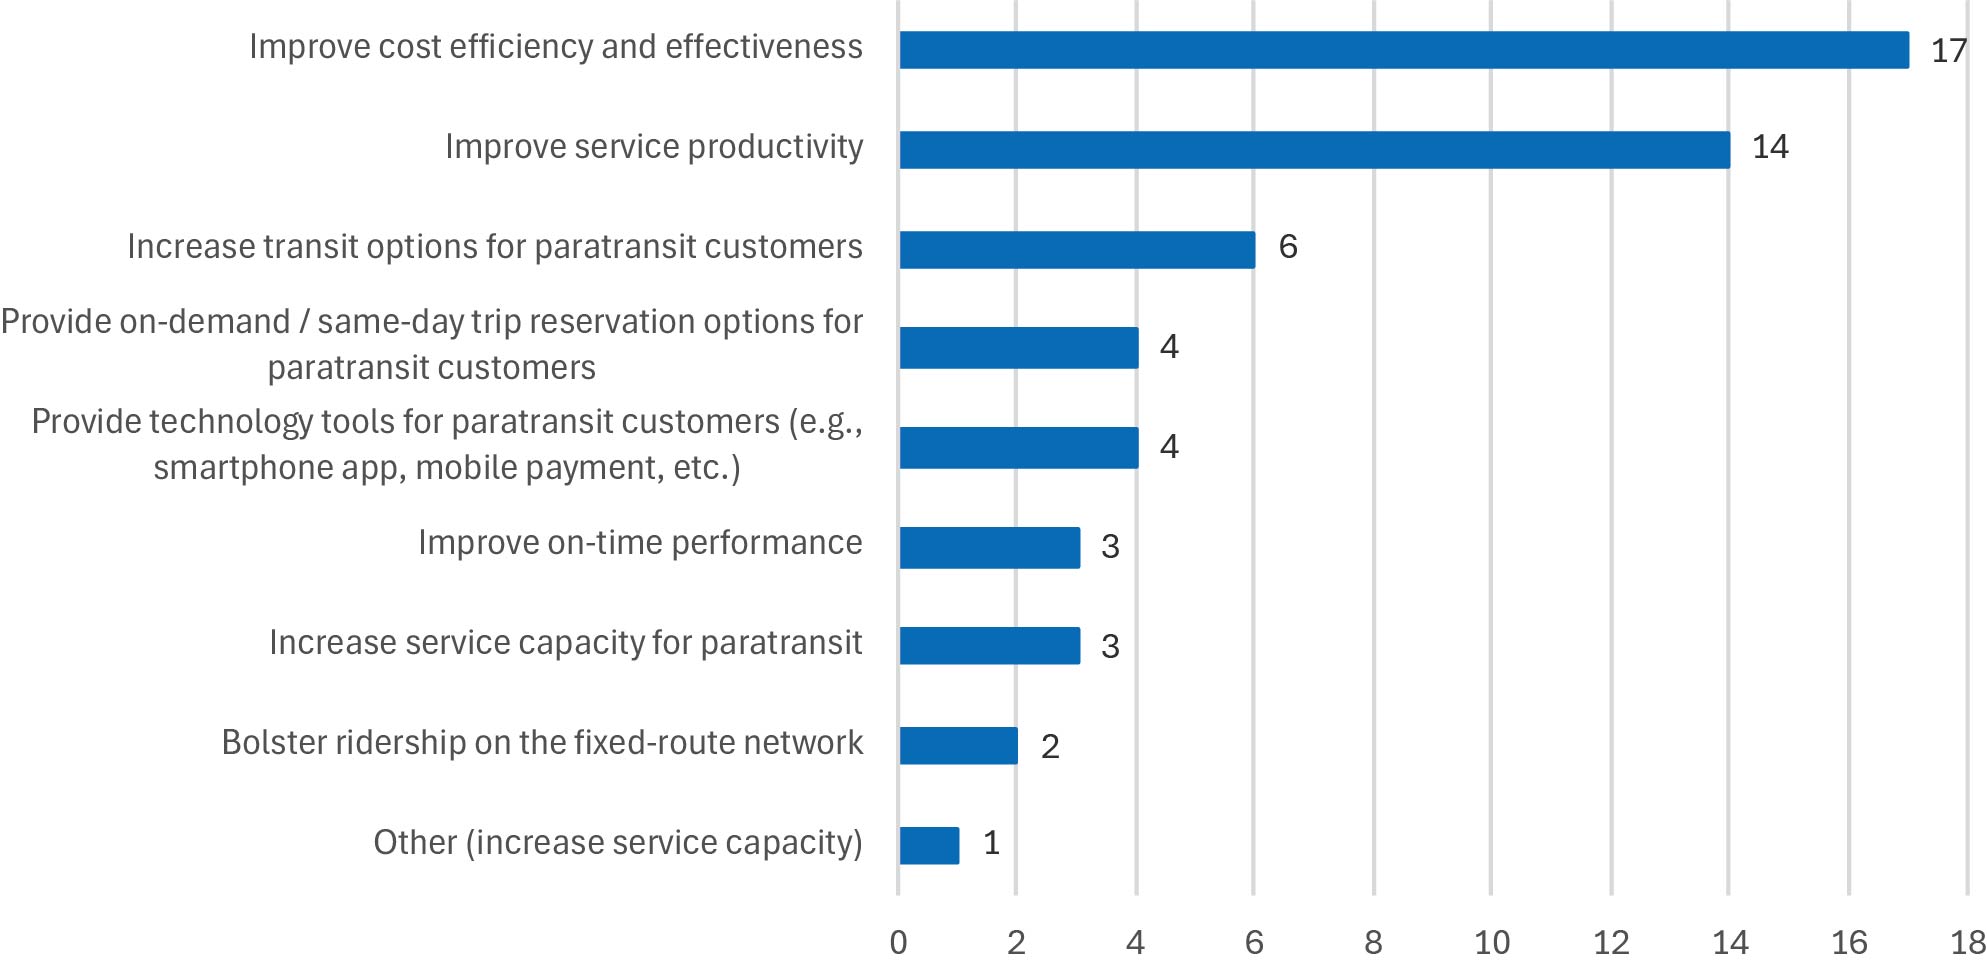
Figure 5 shows the respondentsʼ primary goals in commingling trips together according to the top 3 options (the percentages are shown according to the set of 18 relevant agencies). Most
Long Description.
The horizontal axis shows the number of questionnaire responses from 0 to 18 in increments of 2. The vertical axis shows the primary goals of the transit agency in commingling the ADA or coordinated paratransit and microtransit services. The data given in the graph are as follows: Improved cost efficiency and effectiveness: 17. Improved service productivity: 14. Increase transit options for paratransit customers: 6. Provide on-demand or same-day trip reservation options for paratransit customers: 4. Provide technology tools for paratransit customers: 4. Improve on-time performance: 3. Increase service capacity for paratransit: 3. Bolster ridership on the fixed-route network: 2. Other (increase service capacity): 1.
Long Description.
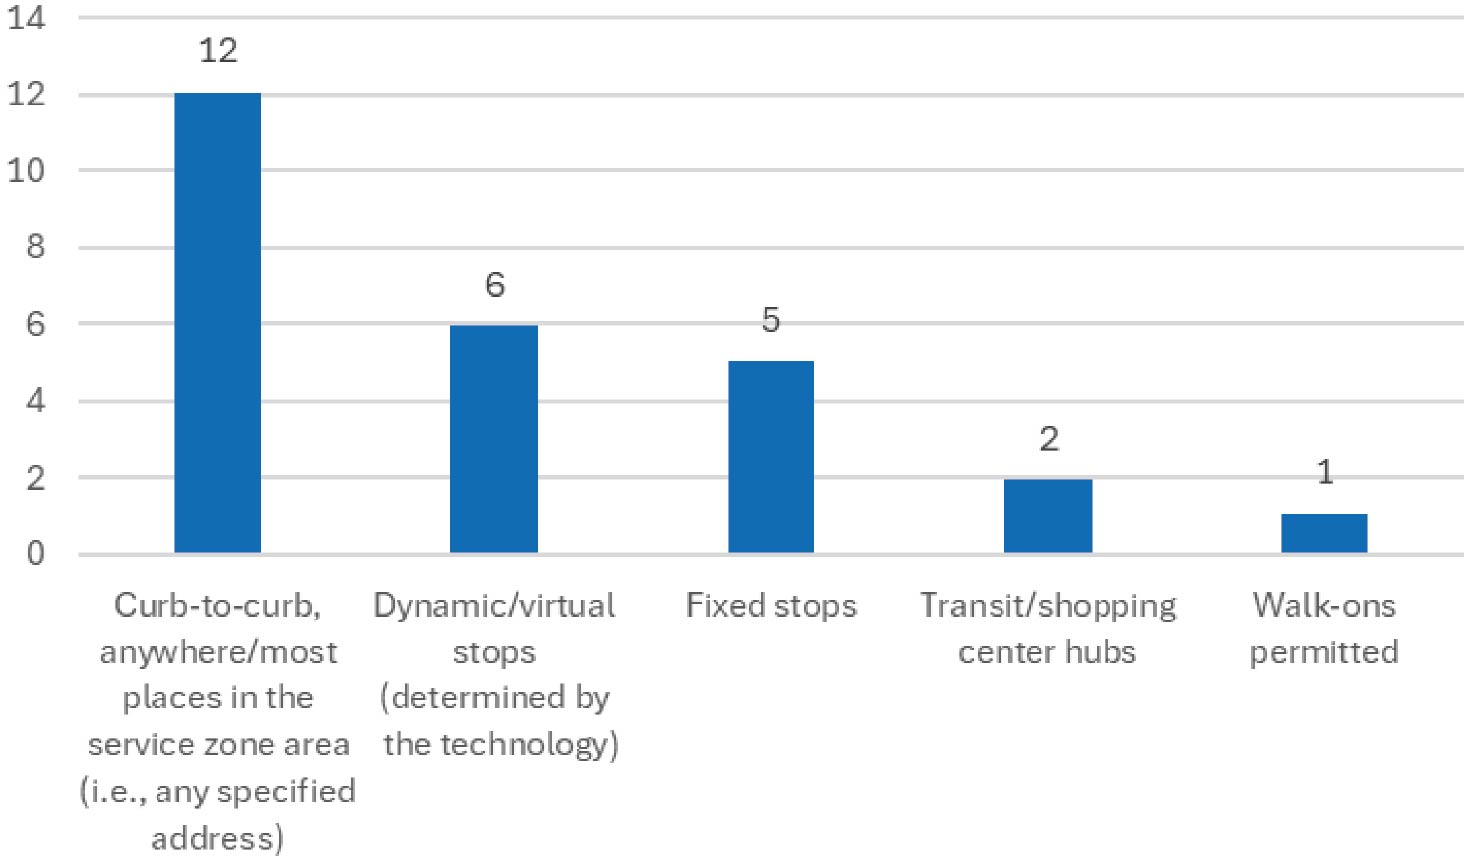
The horizontal axis shows five types of stop design. The vertical axis shows the number of questionnaire responses from 0 to 14 in increments of 2. The data given in the graph are as follows: Curb-to-curb, anywhere or most places in the service zone area (i.e., any specified address): 12. Dynamic or virtual stops (determined by the technology): 6. Fixed stops: 5. Transit or shopping center hubs: 2. Walk-ons permitted: 1.
of the respondents (17, or 94%) aimed to decrease operating costs, thereby improving cost efficiency and cost effectiveness through commingling, while 14 (78%) also desired to improve service productivity. A third of these respondents (6, or 33%) also aimed to increase transit options for paratransit customers.
Service Parameters
The survey next presented a series of questions about the geographic coverage, service times, eligible destinations, and stop types relative to paratransit and general public microtransit trips. Regarding geographic coverage, the option most selected was having the microtransit zone and paratransit service area partially overlap (7 respondents), while others had the paratransit service area entirely within the microtransit zone (6). Many agencies set their service times between two trip types at the same service hours (10 respondents). Figure 6 shows the types of stops used for general public microtransit trips by the relevant agencies; two-thirds of these respondents (12) allowed curb-to-curb trips for general public riders, while other options used less frequently were dynamic/virtual stops (6) or fixed stops (5).
Questions about trip booking between paratransit and general public trips on microtransit yielded interesting results. Three respondents indicated that their service allows paratransit customers to schedule a paratransit trip for immediate fulfillment, while 8 respondents allowed same-day scheduling of paratransit trips but not for immediate on-demand fulfillment. Conversely, two-thirds of the relevant set of agencies (12 respondents) allowed general public customers to schedule microtransit trips in advance.
Booking, Scheduling, and Communication
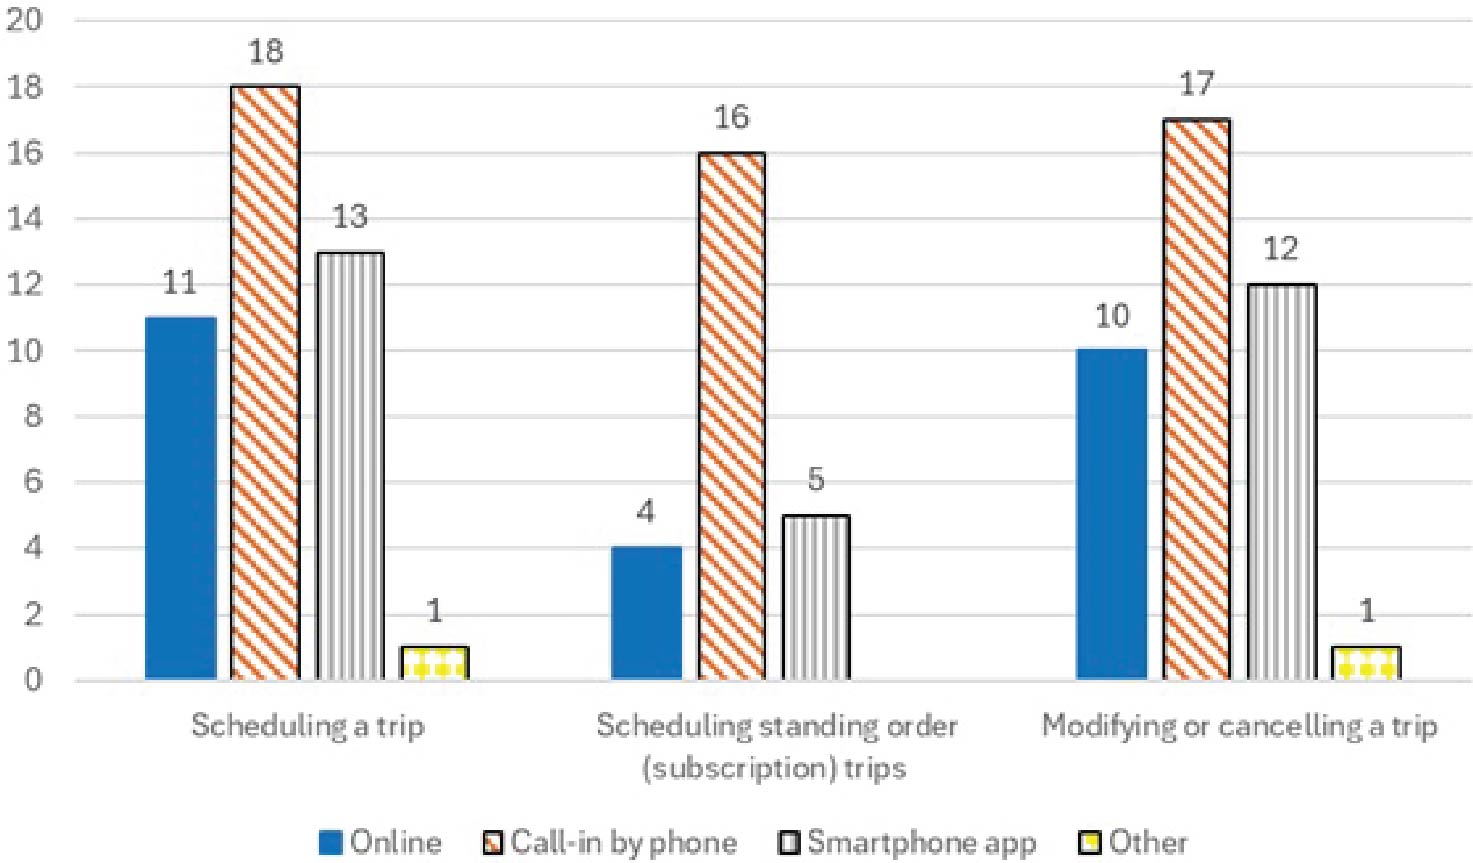
The survey next presented respondents with several questions on processes and tools available for booking different kinds of trips in the integrated or consolidated service as well as on communication to customers that occurs when previously confirmed trip times change. Figure 7 shows the communication options available to paratransit customers to schedule or modify their trip reservations, with a separate category of standing order/subscription trips. Nearly all respondents indicated that calling by phone was available in all 3 categories. Smartphone apps were
Long Description.
The horizontal axis shows three sets of four bars, which represent four types of trip scheduling: Online, Call-in by phone, Smartphone app, and Other, respectively. The vertical axis shows the number of questionnaire responses from 0 to 20 in increments of 2. The data given in the graph are as follows: Set 1, Scheduling a trip: 11, 18, 13, 1. Set 2, Scheduling standing order (subscriptions) trips: 4, 16, 5, 0. Set 3, Modifying or canceling a trip: 10, 17, 12, 1.
typically available for scheduling or modifying single trips (at least 67% of respondents) but less frequently available for subscription trips. Online websites/web portals had similar availability as smartphone apps for these purposes. One respondent also allowed email requests for scheduling or modifying paratransit trips (recorded under Other). The survey did not ask which communication channels/methods were used with which specific customer groups on the microtransit service.
For schedule changes and modifications where the estimated time of arrival would no longer be in the originally scheduled pick-up window, respondents use a variety of methods for communicating back to paratransit customers. Most respondents (16) will call the customer by phone; other options used include text messages (9 respondents), smartphone app notifications (8), and interactive voice response (IVR) systems communication (6).
Commingling Decisions
Regarding decisions on whether or not to commingle certain paratransit trips with general public trips in microtransit service, respondents indicated a variety of approaches. The majority of agencies from the relevant set of respondents commingle all trips together without exception (11 respondents, or 61%). For agencies that do make exceptions, the following responses were provided:
- Based on available capacity in dedicated vehicles (6 respondents)
- Trips that do not require additional assistance (e.g., door-to-door, etc.) for the customer (1)
- Trips that are going to certain destinations (1)
- Trips that do not have rider compatibility concerns (e.g., intellectual and developmental disabilities) (1)
- Trips are scheduled onto separate designated vehicles in the fleet.
- Other (3)
Responding agencies also had different approaches to whether they reviewed commingling decisions. 11 respondents did not review commingling decisions made by the software, while
the other 7 respondents have the software automatically commingle trips and then check the decisions made by the software (4 of these respondents monitoring decisions in real time). None of the responding agencies manually made commingling decisions without the assistance of the software.
Continuous Dynamic Optimization
The survey presented respondents with information about CDO in the software and whether the agency used the software to apply CDO on commingled paratransit trips. Most respondents (14) do apply CDO on these paratransit trips, while a few respondents only apply CDO depending on the specific trip and/or customer type for the trip. CDO was applied by these agencies both before the service day and on the service day itself for the trip.
Trip Confirmations and Changes
Respondents were asked to provide information on how paratransit customers with commingled paratransit trips learn about confirmations and any subsequent changes to their trip times. For originally confirmed pick-up and drop-off windows, most respondents (13, or 72%) have the software platform send out smartphone app notifications, while text messages (10, or 56%), calls by phone (8, or 44%), and IVR systems (8, or 44%) are also deployed frequently. Conversely, when the original pick-up and drop-off times are changed by the software platform, text messages are most frequently used (by 12 respondents, or 67%) followed by smartphone app notifications (9, or 50%) and calls by phone (8, or 44%).
Fare Payment
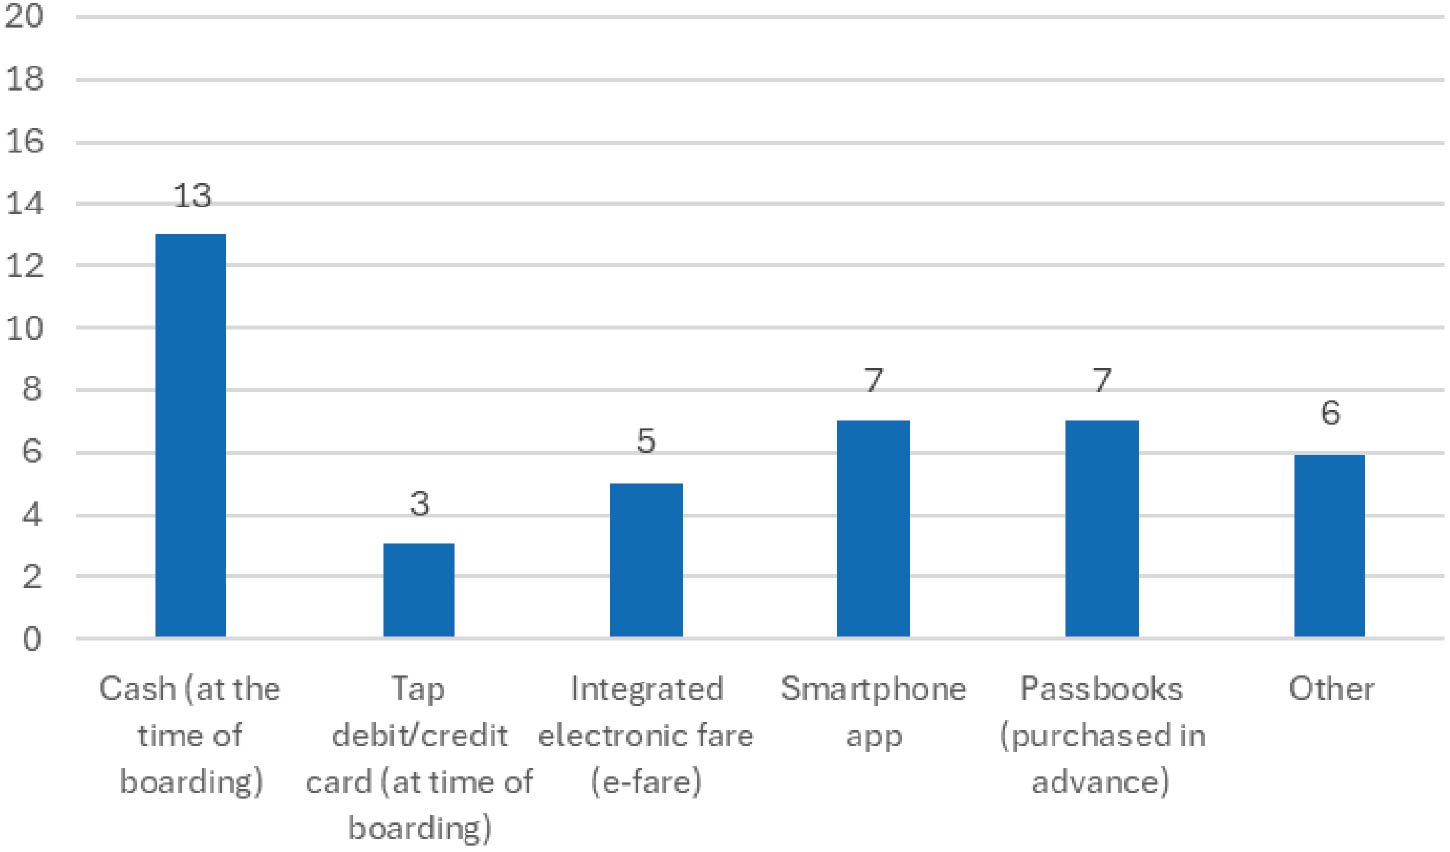
Figure 8 shows the payment options available for paratransit customers to pay fares for their commingled trips on microtransit service. Cash payment at the time of boarding is the most common option available (from 13 respondents, or 72%), while payments through smartphone
Long Description.
The horizontal axis shows six types of integrated or consolidated services. The vertical axis shows the number of questionnaire responses from 0 to 20 in increments of 2. The data given in the graph are as follows: Cash (at the time of boarding): 13. Tap debit or credit card (at the time of boarding): 3. Integrated electronic fare (e-fare): 5. Smartphone app: 7. Passbooks (purchased in advance): 7. Other: 6.
apps or passbooks purchased in advance (7, or 39%) were the next most common. The cash payment option was likely not selected by all respondents because 5 respondents indicated their paratransit service was fare free (recorded under Other). For smartphone app payments, most agencies (8 out of 9 respondents) employ the same app for both trip reservations and fare payments.
Customer Considerations and Accommodations
The next section of the survey presented respondents with further questions about any additional accommodations made for paratransit customers on microtransit. Most microtransit software platforms used (by 11 respondents, or 61%) include information on emergency contacts for paratransit riders in the system.
Agencies take different approaches to adjusting dwell/wait times for customers. Eight respondents adjust these times automatically in the software based on defined trip or customer parameters. Conversely, another eight respondents adjust these times on an individual trip basis, and two respondents have the same waiting times for paratransit customers as defined for general public riders regardless of the circumstances.
Similarly, agencies were split on whether the software platform would provide additional or extra notification time concerning imminent vehicle arrival to paratransit customers relative to general microtransit public customers. Eight (44%) respondents did not have the software platform provide any additional time, 7 (39%) of other respondents did provide earlier notification based on the customer type, and 3 (17%) provided earlier notification as part of the customerʼs profile settings.
Fleet Mixture and Dispatching
The survey next moved to questions on dispatching and vehicle operations procedures in the integrated or consolidated microtransit service for staff and dedicated or non-dedicated providers. Directly operated dedicated vehicles for paratransit trips in microtransit were used by 8 respondents, while dedicated vehicles from contractors were used by 7 respondents. The survey did not ask questions about vehicle fuel/energy sources used in service.
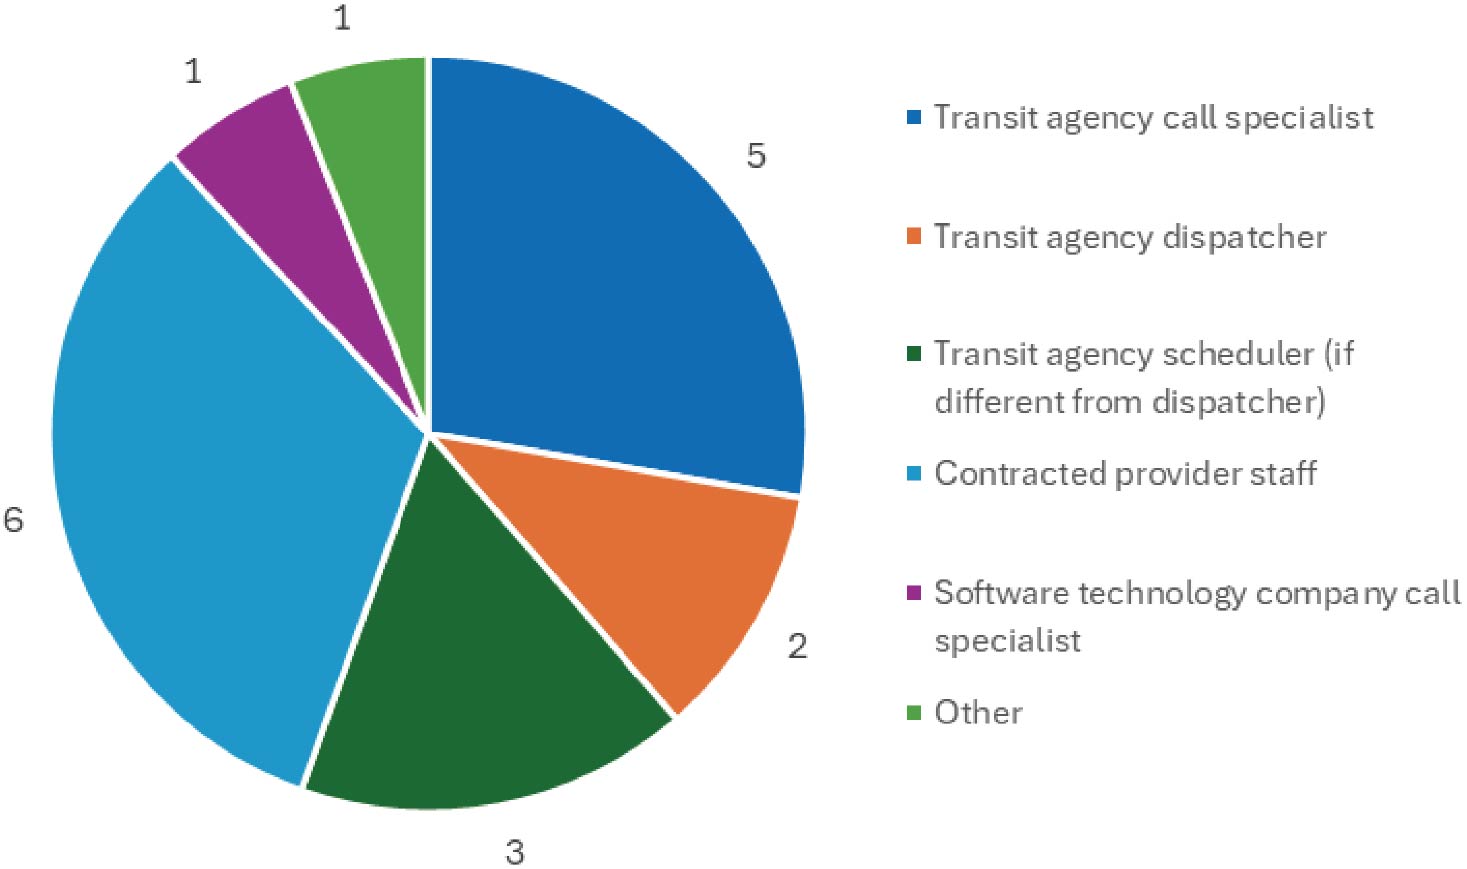
Figure 9 shows respondentsʼ answers on the staff and party responsible for handling customer service calls on the day of service for commingled paratransit trips. The most common staff type with this responsibility was either contracted staff from the service provider (6 respondents) or call specialists from the transit agency themselves (5 respondents). Other transit agency staff types commonly used in this function included either the scheduler (3 respondents) or the dispatcher (2 respondents). All but one respondent did not utilize a call center specialist contracted through the software platform company for this role.
Most of the respondents had consistent orders of service response for responding to vehicle breakdowns on the road and fulfilling the paratransit trip on the microtransit service. The first priority choice indicated was using another vehicle dispatched from the same provider as the one serving the trip originally (11 respondents). A vehicle driven by a road supervisor (either from the transit agency or service contractor) was the secondary choice (10 respondents).
Original Paratransit Times
Responding agencies used various methods for choosing to communicate (or not) the originally scheduled pick-up and drop-off times to the microtransit vehicle driver in the event that
Long Description.
The pie chart is divided into six sections with each section represented by a color. The number of questionnaire responses given in the chart are as follows: Transit agency call specialist: 5. Transit agency dispatcher: 2. Transit agency scheduler (if different from dispatcher): 3. Contracted provider staff: 6. Software technology company call specialist: 1. Other: 1.
CDO in the software platform had changed those originally scheduled times. Most respondents indicated that the original times were communicated through the tablet or smartphone app used by the vehicle operator (15 respondents), while other agencies would instead, or also, communicate these times over the radio or phone through the dispatcher (7 respondents).
Determination of Actual Times
Respondents were asked whether the vehicle operator themselves input the actual arrival times of paratransit trip pick-up and drop-off events into their tablet or smartphone app, or if these were calculated automatically by the software itself. Fifteen respondents have these times automatically calculated, while three respondents rely on drivers to record the accurate vehicle arrival times.
Benefits and Impacts
Respondents were next asked questions about measured outcomes and impacts from their integration or consolidation of paratransit with general public microtransit service. Several agencies reported total paratransit ridership and trip requests going up after implementation, either at moderate (3 respondents) or significant (6) rates; no respondents indicated that paratransit trip requests went down as a result. From a cost efficiency perspective (measured by cost per passenger trip), nine indicated that costs moderately decreased while another two respondents said costs significantly decreased.
Respondents were asked to provide an estimated (or actual) percentage of paratransit trips which are commingled in the microtransit service relative to total trips on the service. Two respondents indicated that less than 5% of trips on microtransit are commingled paratransit trips, while two additional respondents said around 12% are commingled paratransit trips. Four respondents indicated between 25% and 35% of their trips are commingled paratransit trips, and an additional respondent reported 41%.
Some respondents provided information on measured productivity levels for their microtransit service. The average productivity on weekdays (out of 13 responses) was 2.84 trips per hour, with a maximum of 5.1 and minimum of 1.5 trips per hour reported. On weekends (12 responses), the productivity average was 2.58 trips per hour with a high of 4.7 and a low of 1.0 trips per hour from the respondentsʼ information provided.
Measurement Capabilities
Respondents were asked about how data and reports are made available to them from the software platform and/or company as well as what measures they have difficulty assessing (if any). Some respondents indicated that the agency has access to a live online dashboard with the capability to generate exportable reports as desired. Other respondents are either provided with raw data files from the company (either regularly or on request) or are sent prepared reports on a recurring basis.
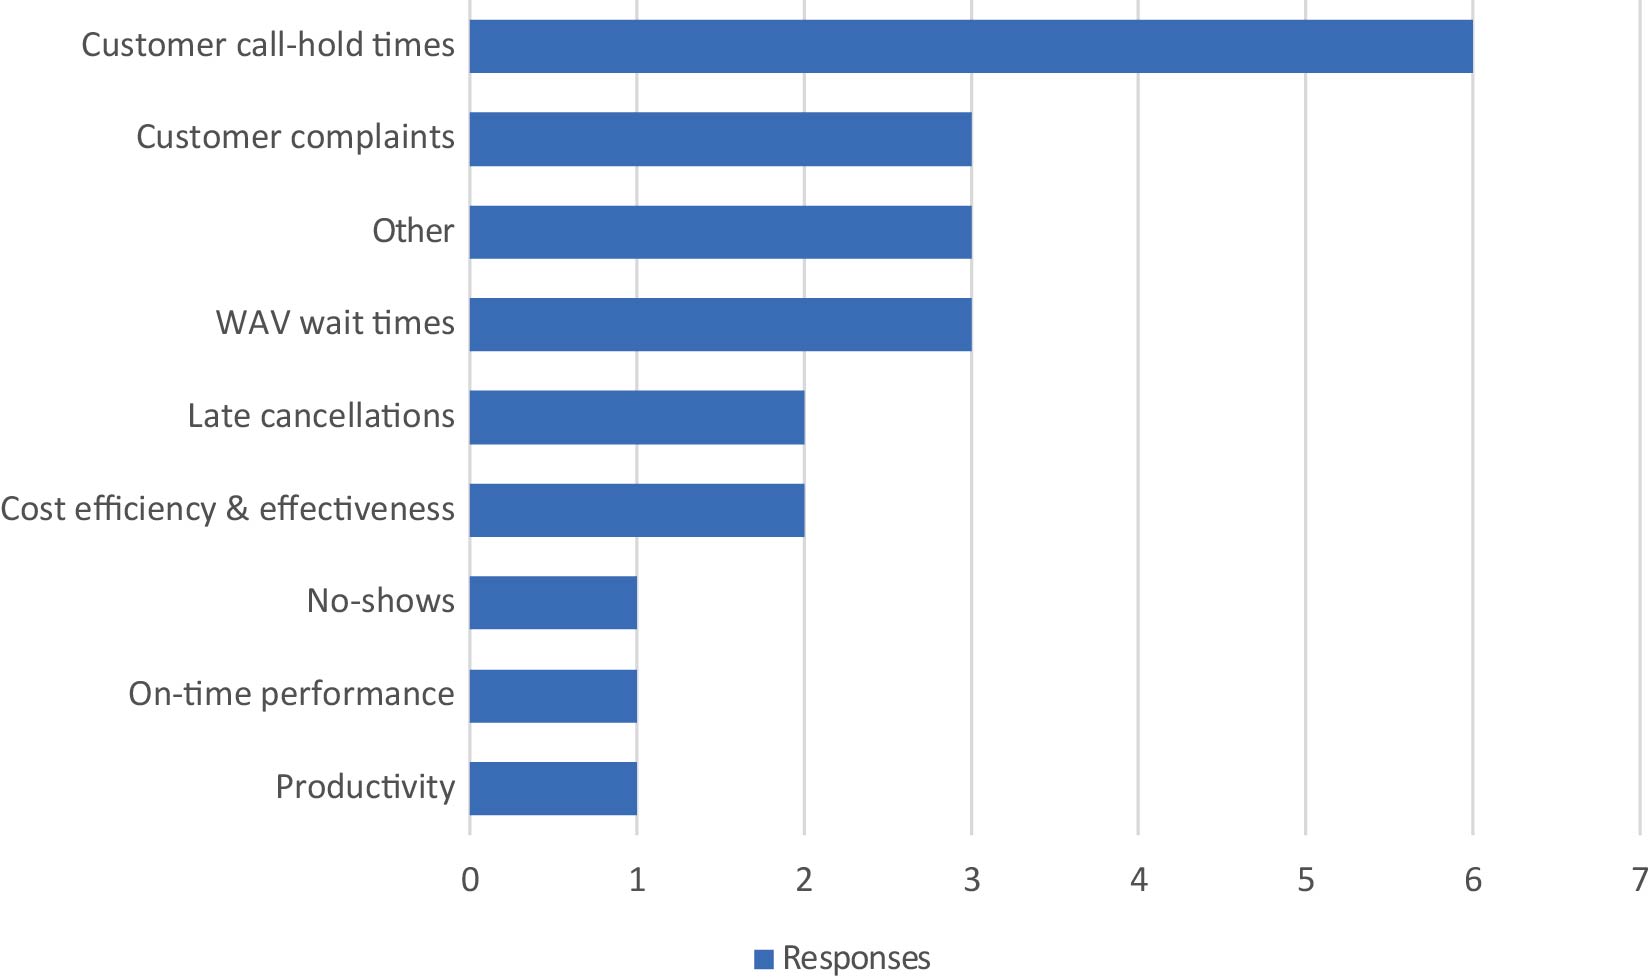
Figure 10 shows the number of responses for performance indicators that the survey respondents are not able to measure through the microtransit software platform. The most common predefined option selected was customer hold times (6 respondents); along with customer complaints (3 respondents), these selections appear to be due to this type of information being captured by other systems instead. A few respondents (3) indicated trouble with measuring wait times for wheelchair-accessible vehicles (WAVs) when providing service to commingled paratransit trips. For responses under the Other category, one respondent clarified that the agency is not able to track the travel purpose for the trips in the microtransit software platform and therefore cannot tell which trips are ADA paratransit versus general public trips in the data.
ADA Compliance
Respondents were next asked a few questions specifically about ADA compliance measures and capabilities of the software platform. The survey asked how OTP is measured by the software platform in cases where CDO is applied toward commingled paratransit trips. Twelve respondents
Long Description.
The horizontal axis shows the number of questionnaire responses from 0 to 7 in increments of 1. The vertical axis shows the performance factors that are not measured specifically for ADA within the microtransit service. The data given in the graph are as follows: Customer call-hold times: 6. Customer complaints: 3. Other: 3. WAV wait times: 3. Late cancellations: 2. Cost efficiency and effectiveness: 2. No-shows: 1. On-time performance: 1. Productivity: 1.
indicated that the originally scheduled pick-up and drop-off times were used to measure OTP for paratransit trips, while 4 respondents were not sure which times were used by the software in this measurement.
Seven respondents have a software platform that generates a report containing ADA compliance information about commingled paratransit trips. The remaining respondents were either not sure whether this type of report existed in their system (7 respondents) or knew that the system did not have such a report (3 respondents). One respondent reported having issues with meeting reporting and compliance requirements following the implementation of commingled paratransit trips in their service design.
Lessons Learned and Challenges
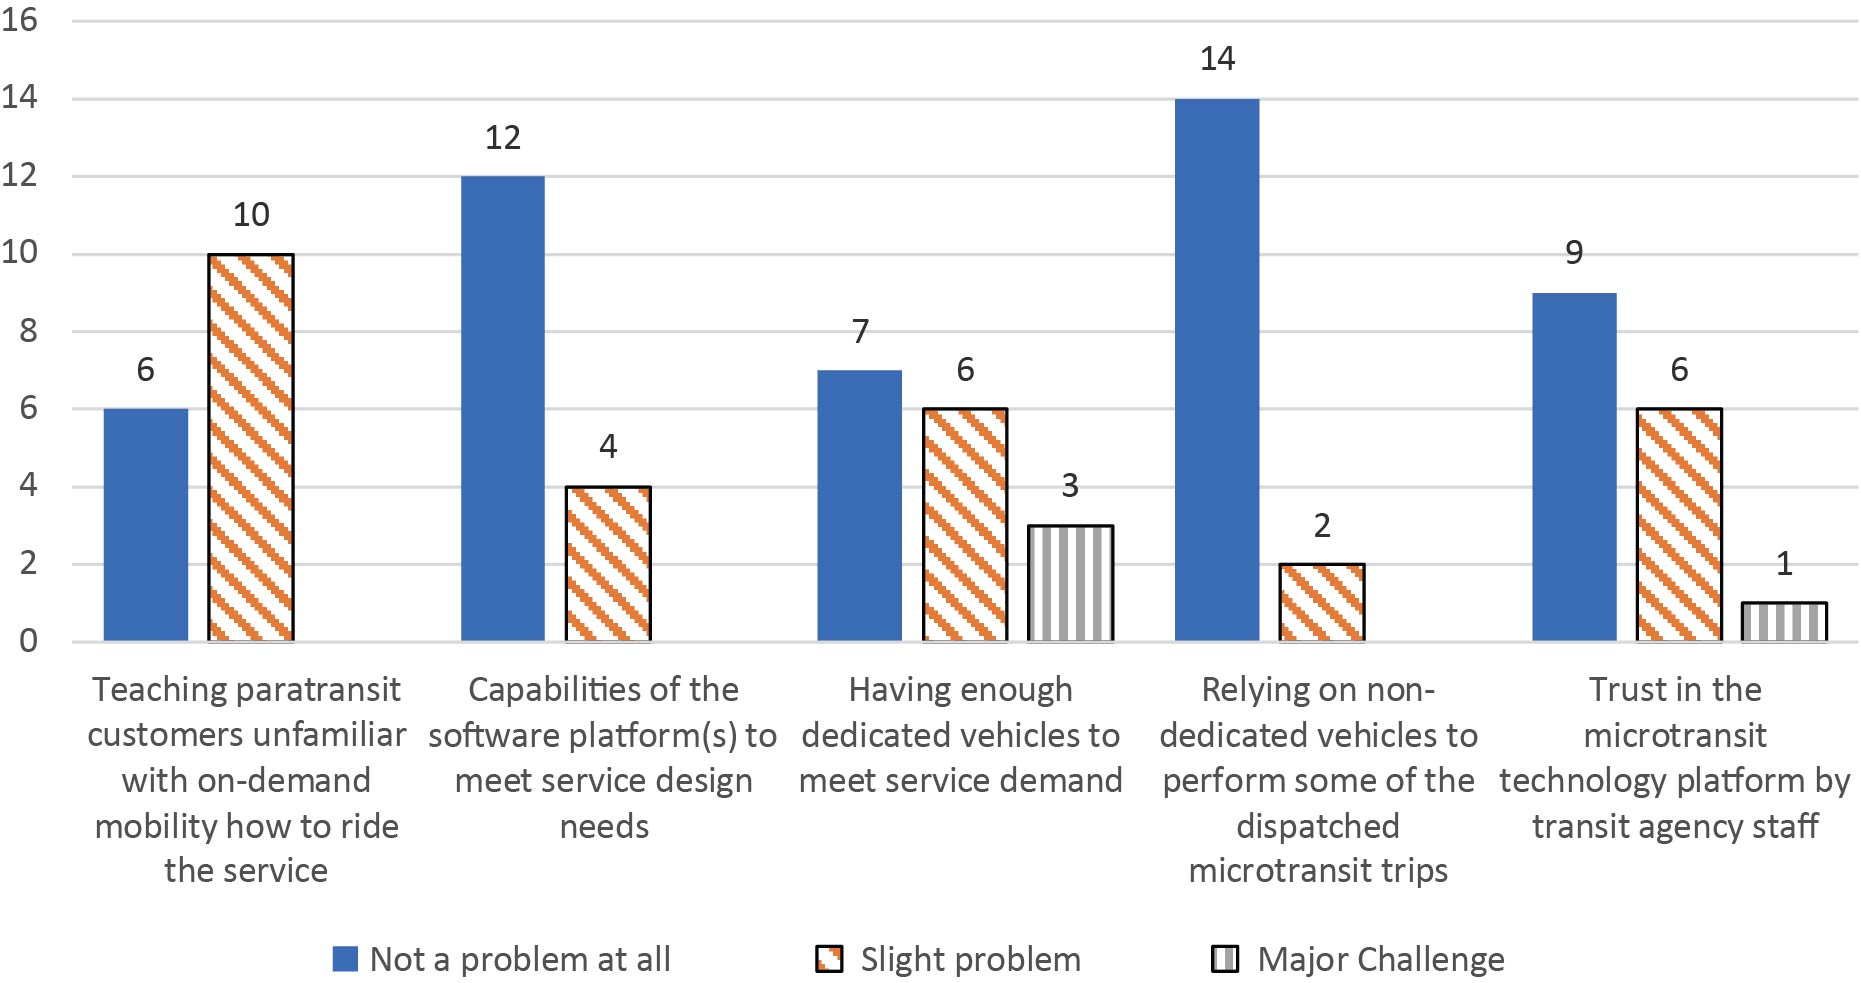
The survey concluded with a few questions on lessons learned by the agency respondents from their experience in commingling paratransit trips with general public trips in on-demand microtransit service. Figure 11 shows the number of responses on whether a particular issue was seen as a major challenge, a slight problem, or not a problem at all in the integrated or consolidated service design and implementation.
- Teaching paratransit customers about the service was indicated as a slight challenge by about half of the survey group (10 respondents).
- Software platforms meeting the service design needs was indicated as not a problem by most of the group (12 respondents).
- Responses were mixed on whether their agency had enough dedicated vehicles to meet demand; 7 respondents did not indicate having an issue, while 6 respondents have slight problems and 3 saw this aspect as a major challenge.
- Relying on non-dedicated service providers to provide trips was not seen as a challenge by most respondents. However, earlier in the survey only one respondent indicated that their agency dispatched paratransit trips to non-dedicated service providers.
Long Description.
The horizontal axis shows five sets of three bars. The five sets represent the agency's experience with service delivery. In each set, the bars represent Not a problem at all, Slight problem, and Major challenge, respectively. The vertical axis shows the number of questionnaire responses from 0 to 16 in increments of 2. The data given in the graph are as follows: Set 1, Teaching paratransit customers unfamiliar with on-demand mobility how to ride the service: 6, 10, 0. Set 2, Capabilities of the software platform(s) to meet service design needs: 12, 4, 0. Set 3, Having enough dedicated vehicles to meet service demand: 7, 6, 3. Set 4, Relying on non-dedicated vehicles to perform some of the dispatched microtransit trips: 14, 2, 0. Set 5, Trust in the microtransit technology platform by transit agency staff: 9, 6, 1.
- Perception of agency staff trust in the software platform was somewhat mixed; half of respondents (9) said this was not a problem, while 6 respondents indicated it was a slight challenge and 1 reported it as a major challenge.
Respondents were also asked to provide open responses on any lessons learned in integrating or consolidating their paratransit service with microtransit. Responses provided included the following:
- “We are very happy with the [software platform] and [their] staff. A big reason for our delay in going live has been challenges with the third-party operator learning and properly using the system, although not because the system is difficult to use.”
- “Spend more time and money than you think on internal change management with staff.”
- “We see a measured 20 [percent] increase in the number of trips we serve using commingled service.”
- “Critical to have paratransit client data embedded.”
- “The prioritization can be challenging to get right, especially given we have a large number of subscription workforce riders. Writing the weekly operator schedule is always a balancing act, with limited resources. We may sometimes prioritize peak ADA request hours for staffing, for example, rather than overall peak hours, which can lead to some very tight scheduling at those other times.”
- “Ensure every staff person that has a hand in that the software process understands what the software can and canʼt do, and walk through concerns, issues and resolutions.”
- “It is rough going for the first few weeks as staff and drivers adapt to a new system but overall, the transition has worked well.”
- “Having ADA options on all [microtransit] vehicles.”


