Defining Contractual Risk Profiles to Increase Competition on Alternative Project Delivery Methods (2025)
Chapter: Appendix D: Raw Survey Results
Appendix D: Raw Survey Results
D1: Owner Survey Results
APDM: Owner - Dashboard
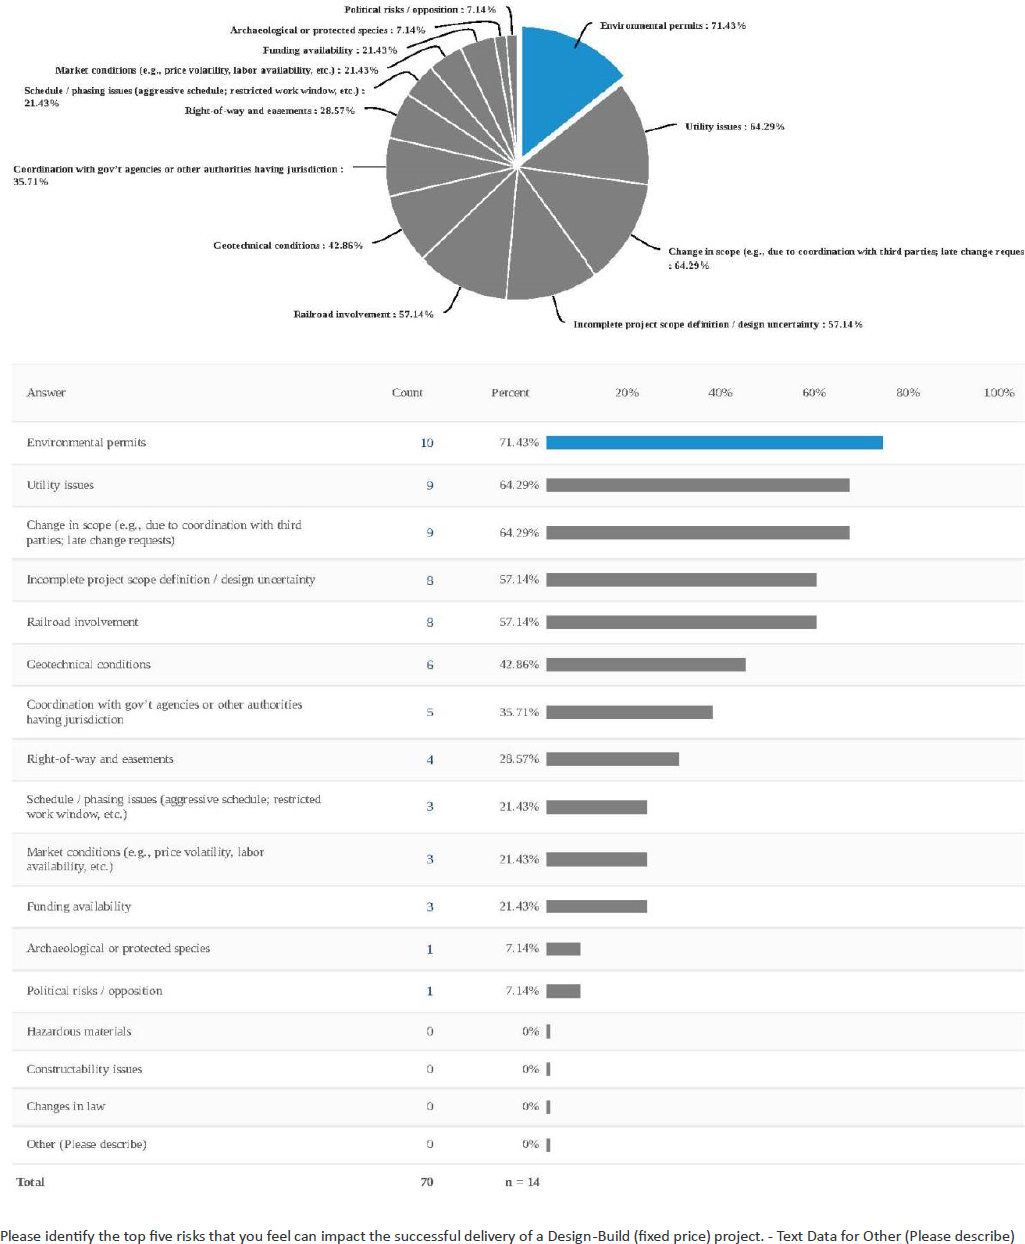
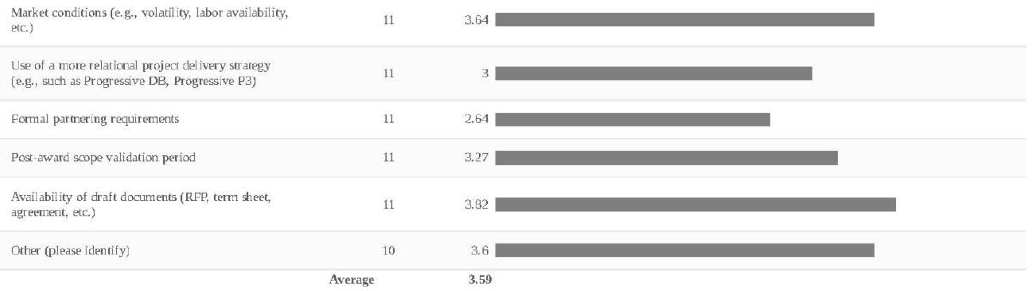
Please identify the top five risks that you feel can impact the successful delivery of a Design-Build (fixed price) project.
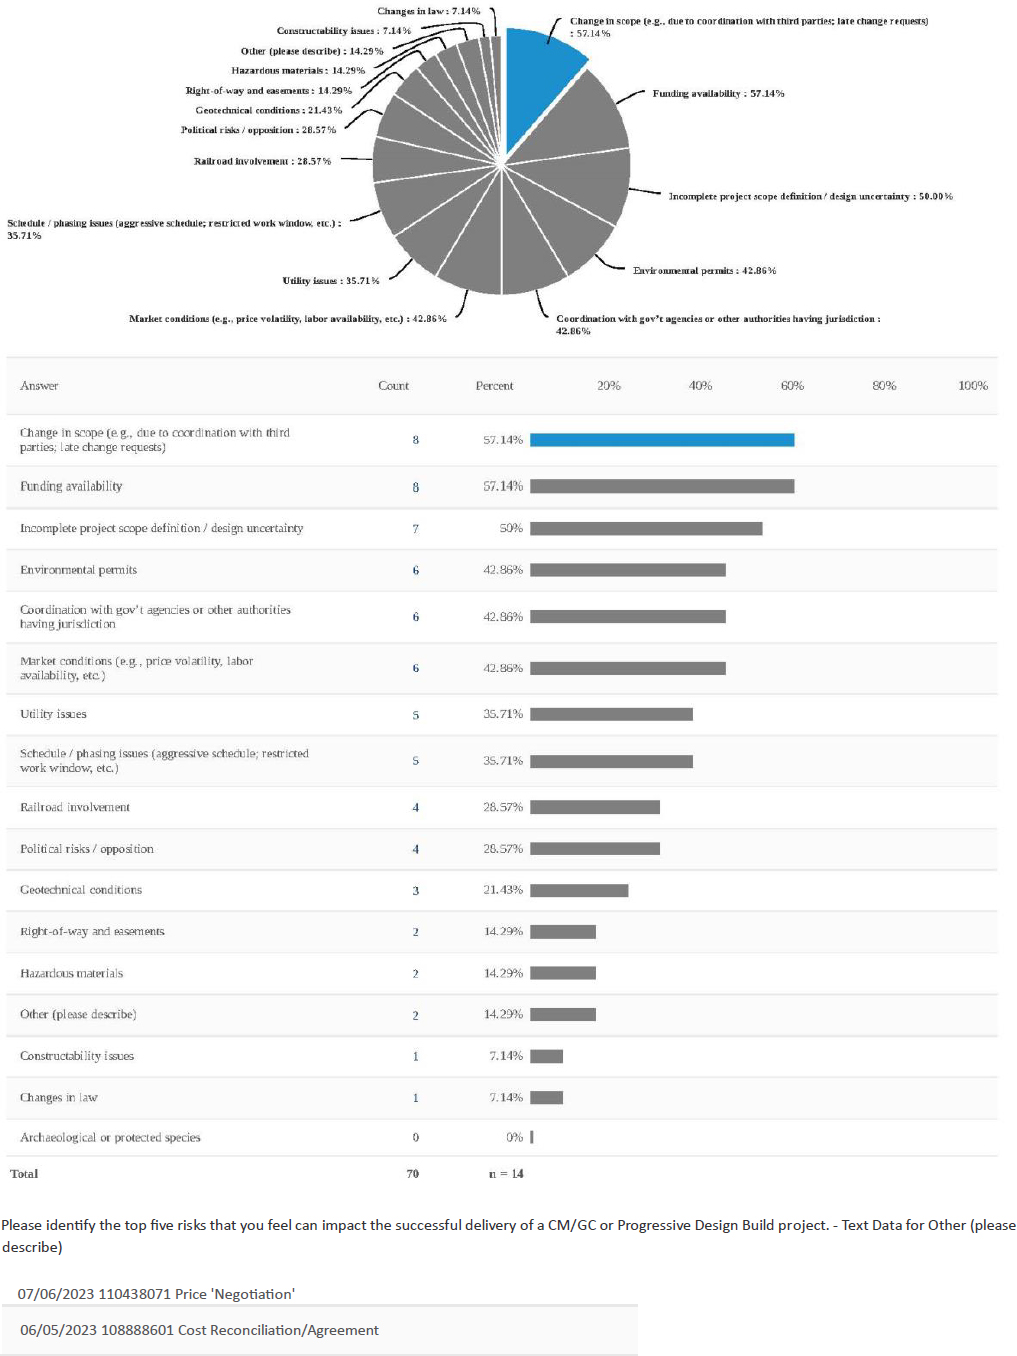
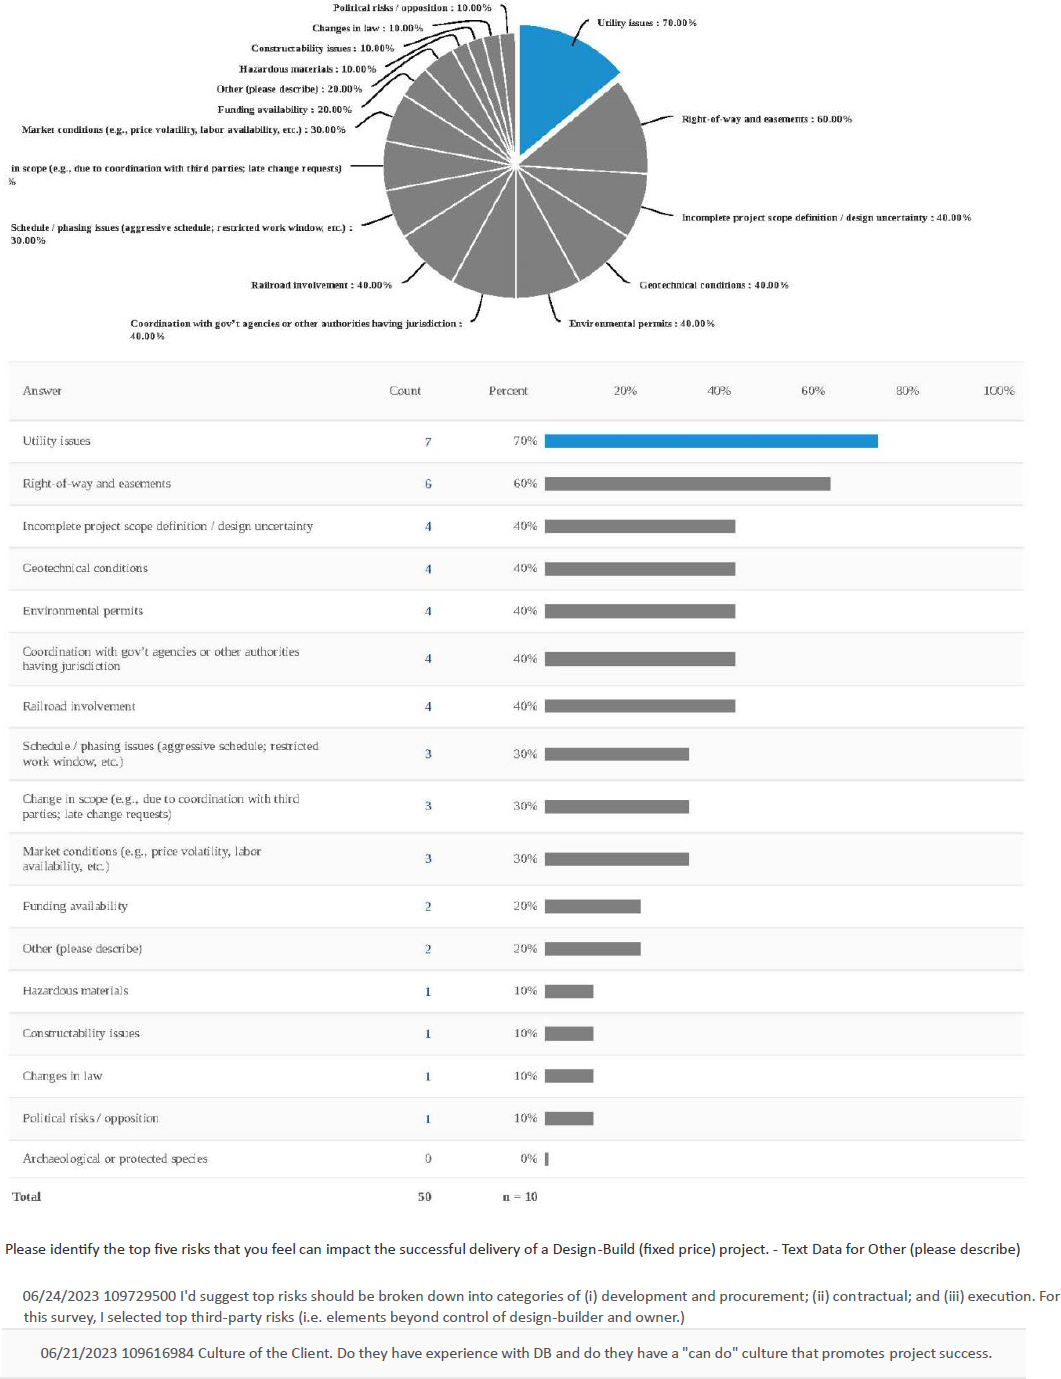
Please identify the top five risks that you feel can impact the successful delivery of a CM/GC or Progressive Design–Build project.
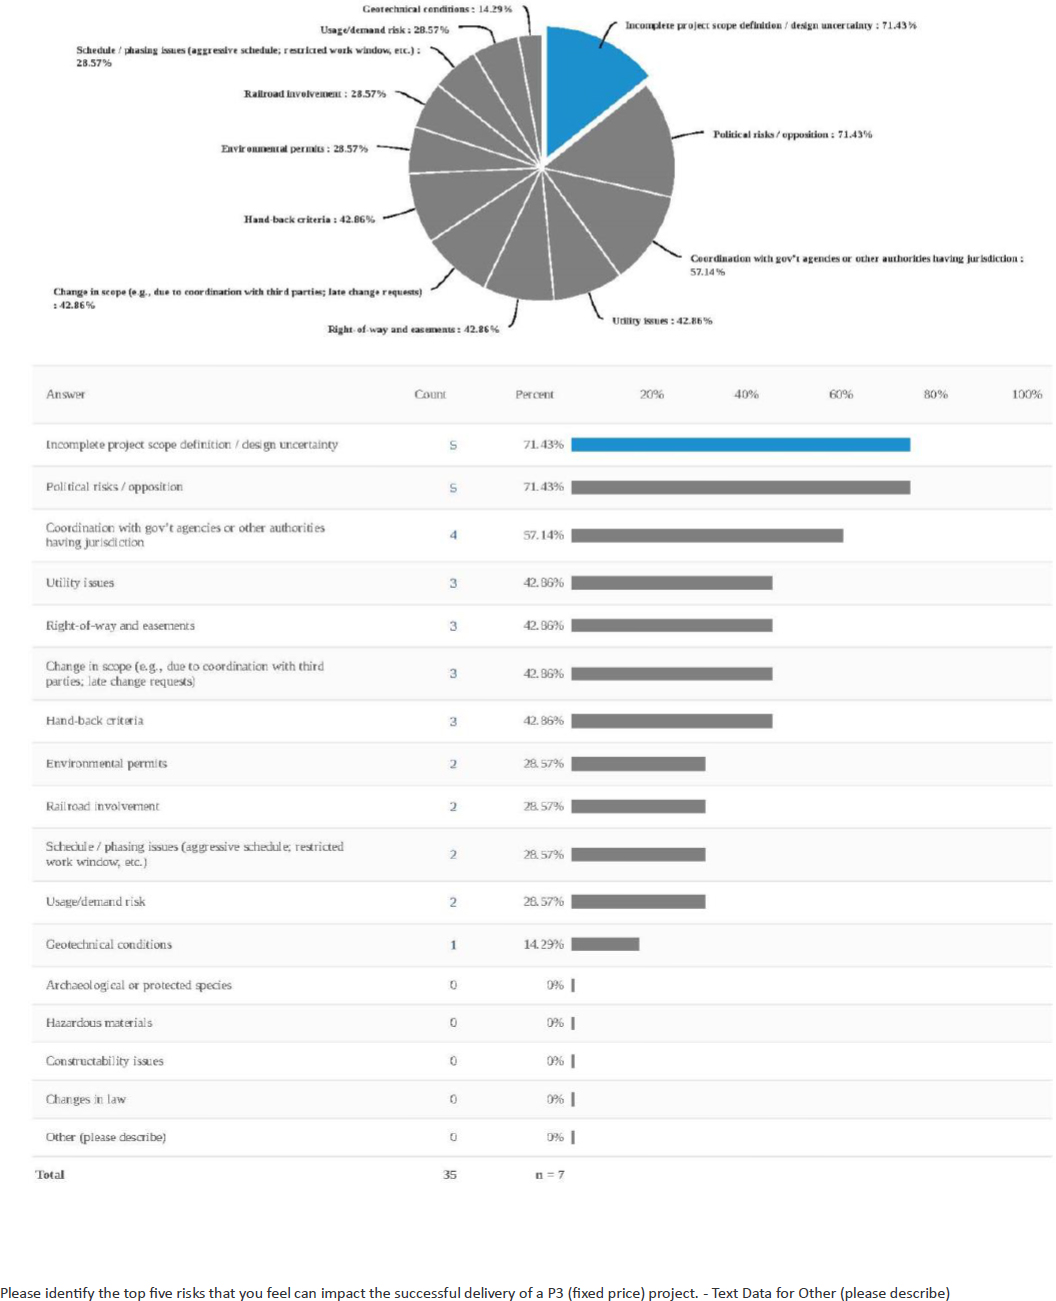
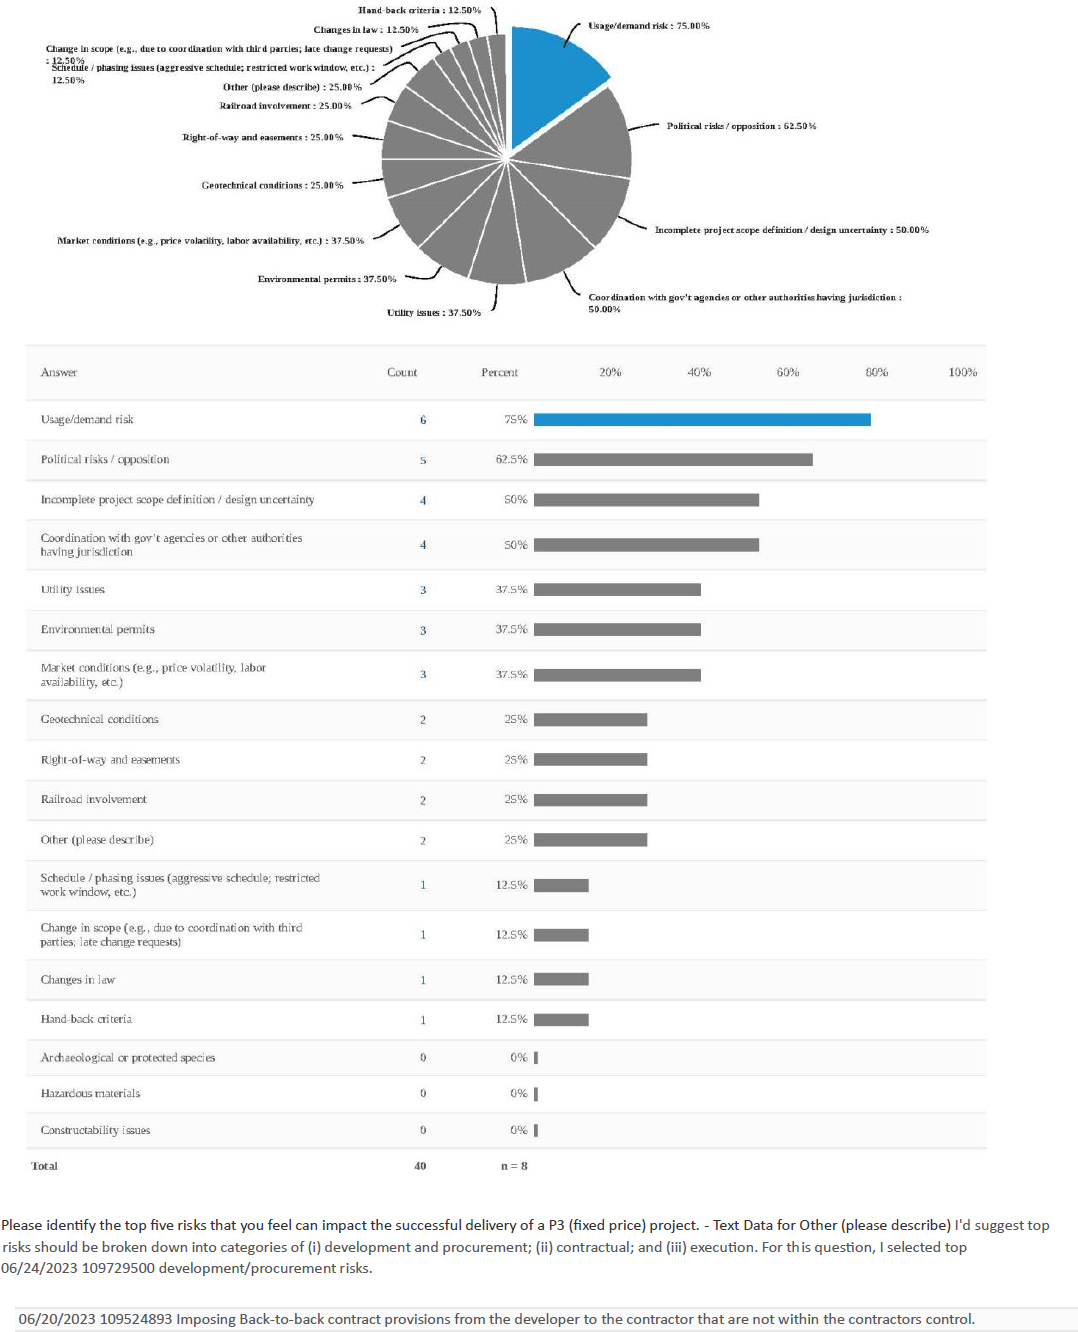
Please identify the top five risks that you feel can impact the successful delivery of a P3 (fixed-price project).
Assessing and Allocating Project Risk
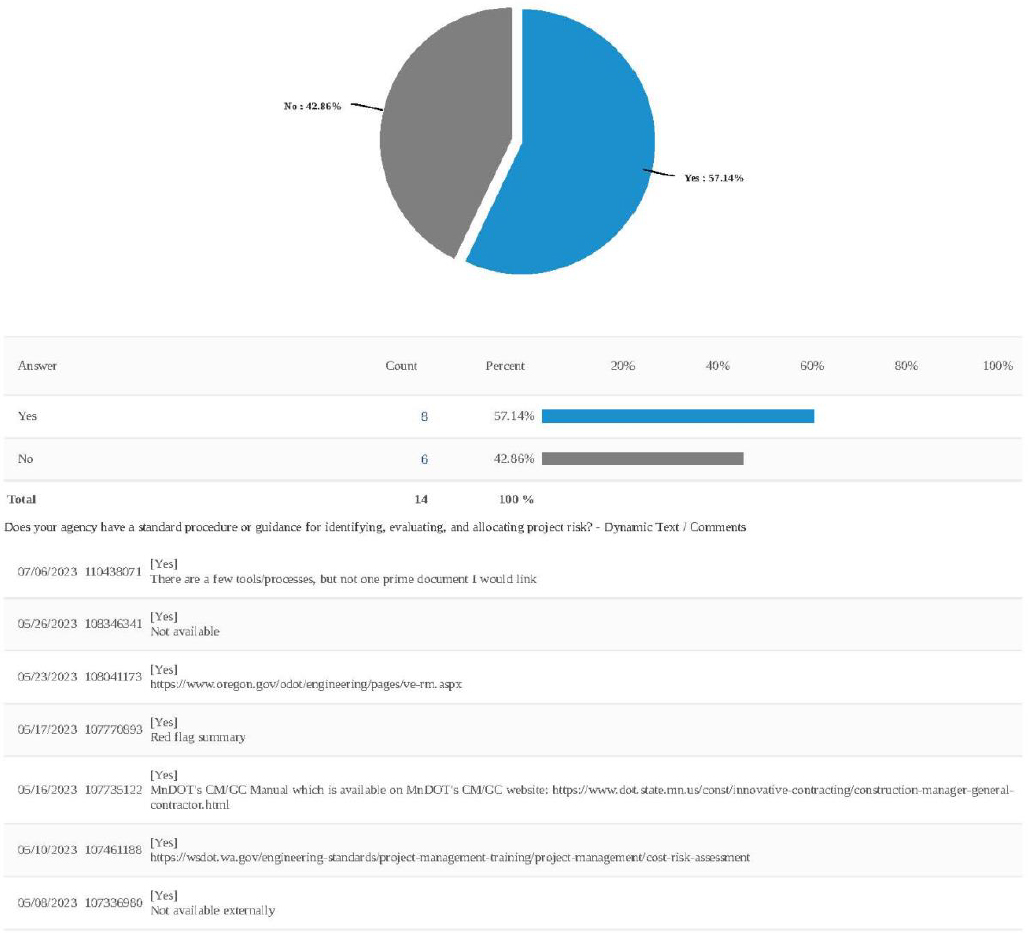
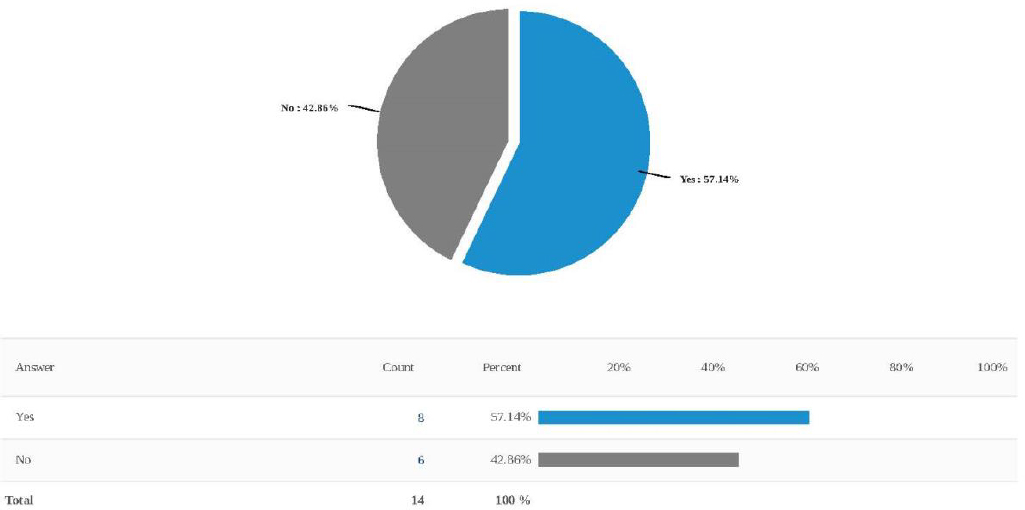
Does your agency have a standard procedure or guidance for identifying, evaluating, and allocating project risk?
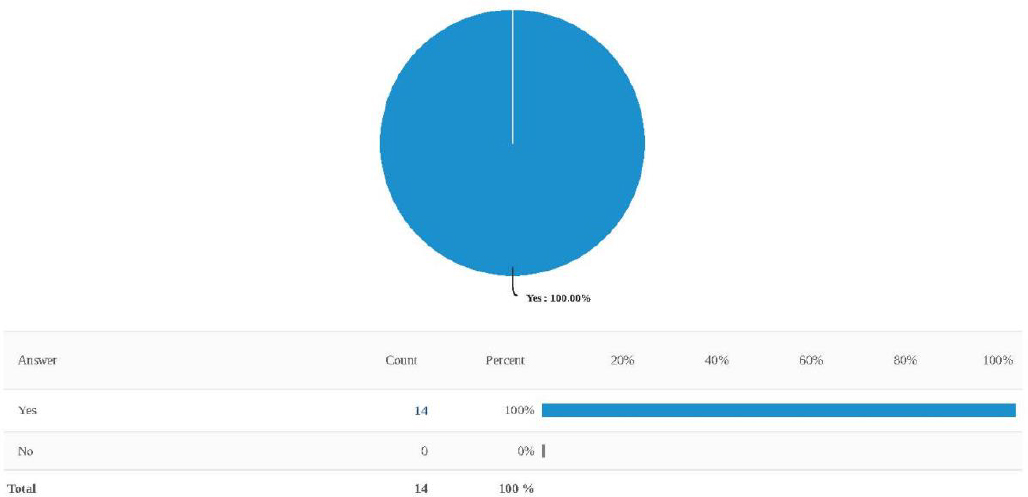
Do your cost estimates involve a quantitative analysis of risk?
Is project risk considered when selecting a project delivery method?
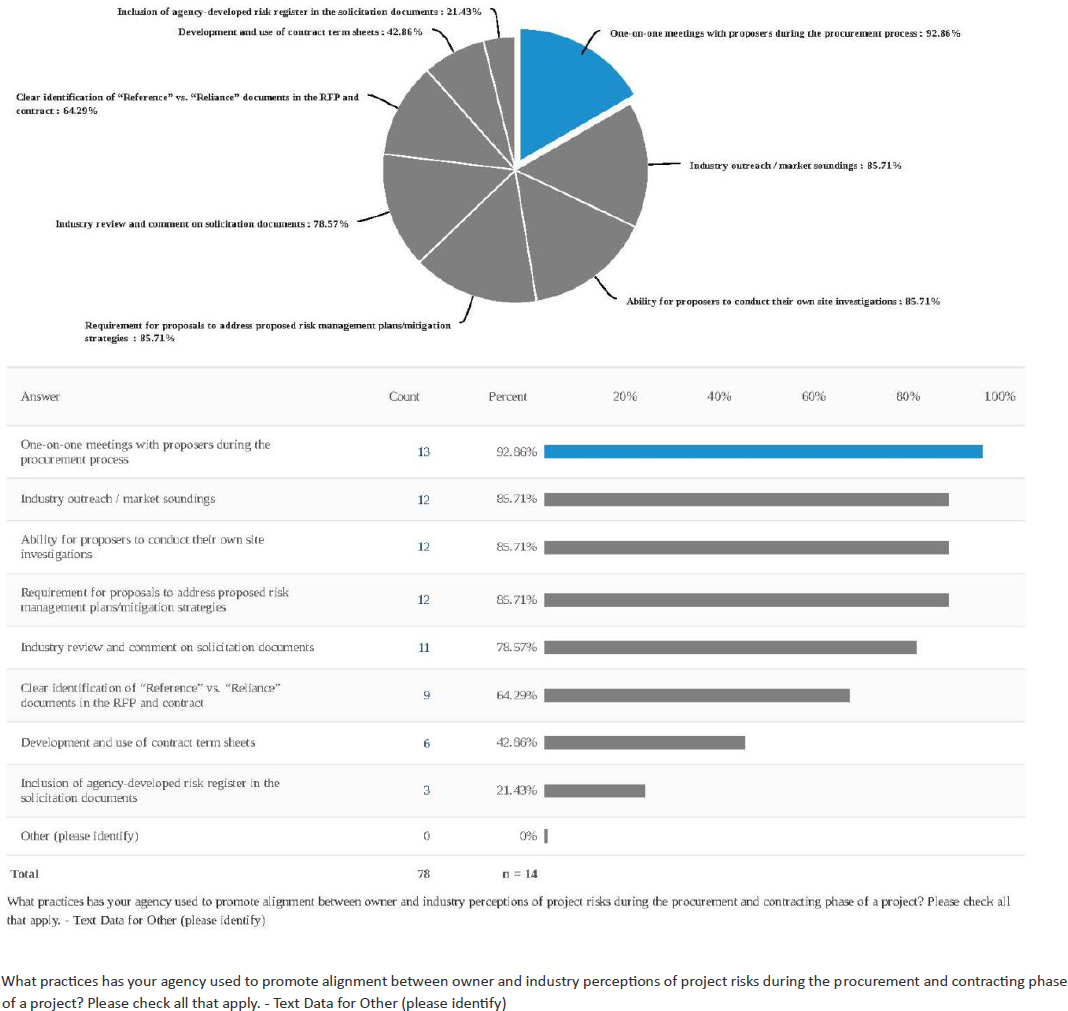
What practices has your agency used to promote alignment between owner and industry perceptions of project risks during the procurement and contracting phase of a project? Please check all that apply.
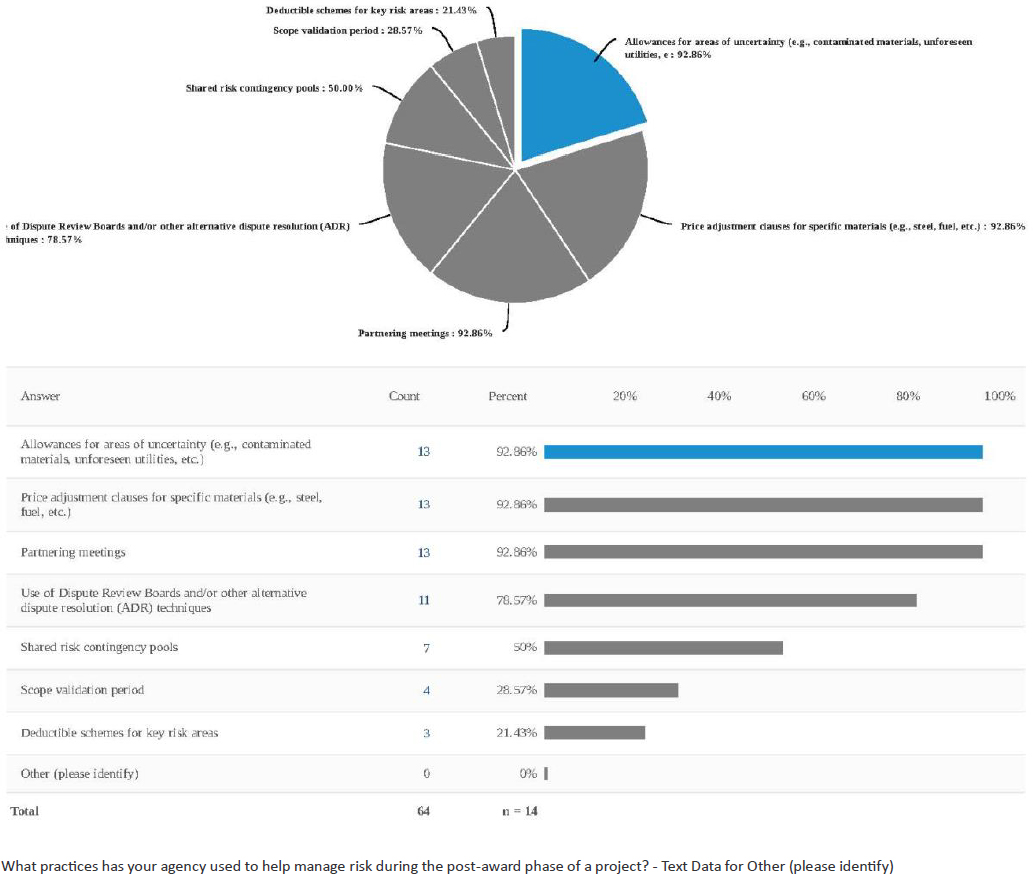
What practices has your agency used to help manage risk during the post-award phase of a project?
D2: Industry Survey Results
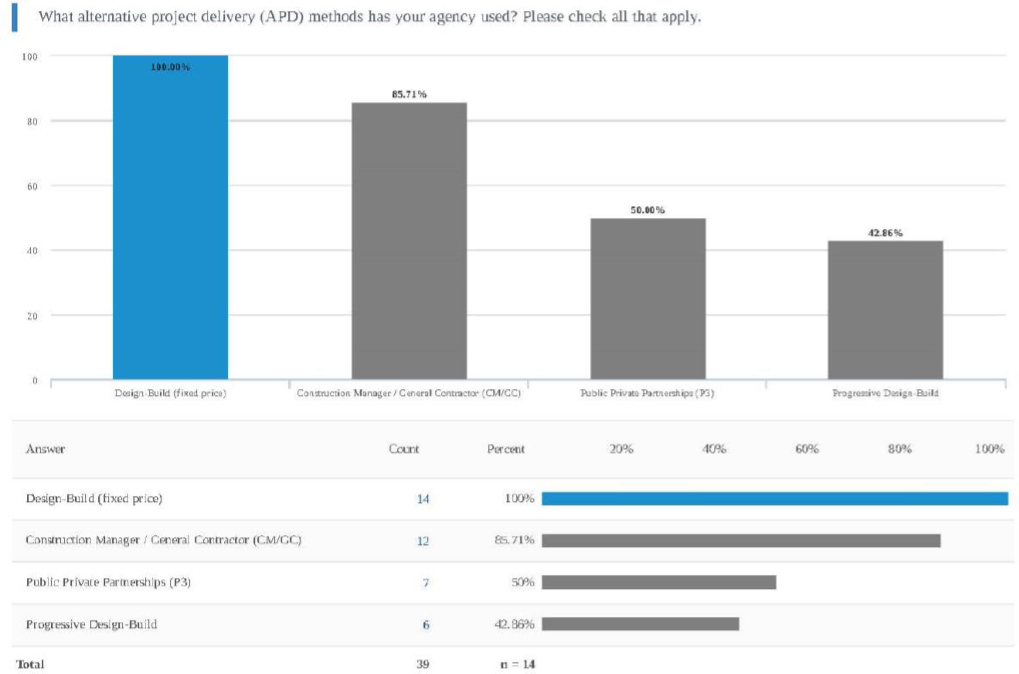
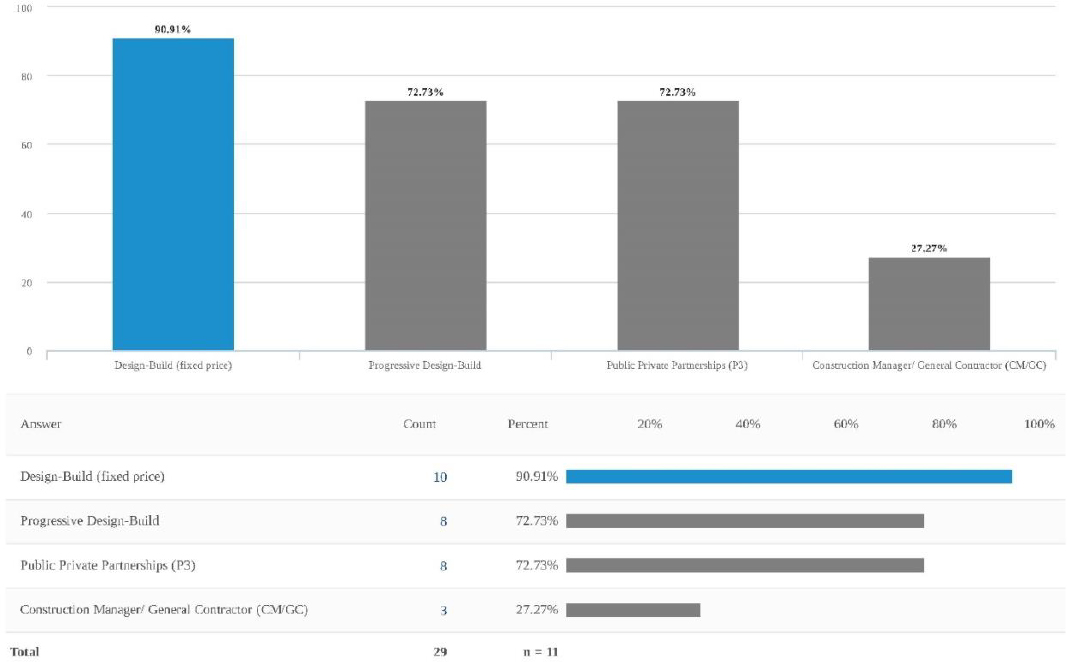
What alternative project delivery (APD) methods do you have experience with? Please check all that apply.
Assessing and Allocating Risk: Industry Survey – Dashboard
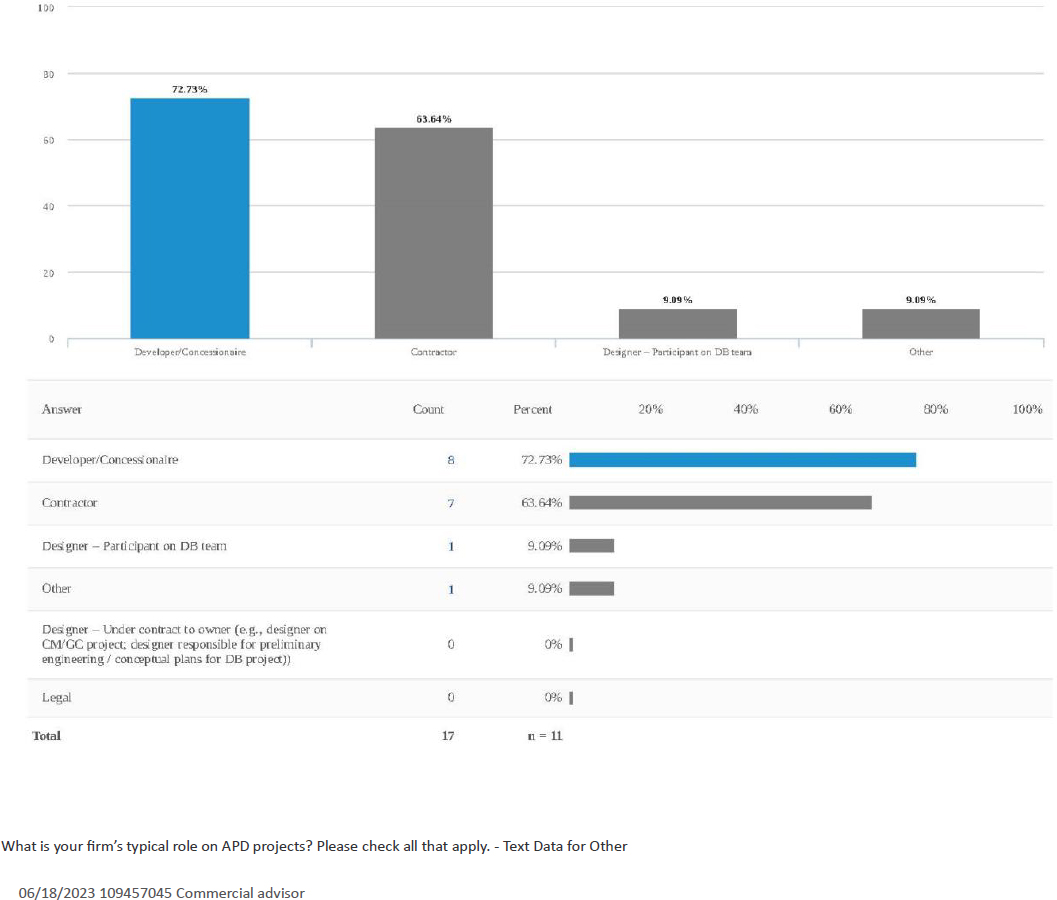
What is your firm’s typical role on APD projects? Please check all that apply.
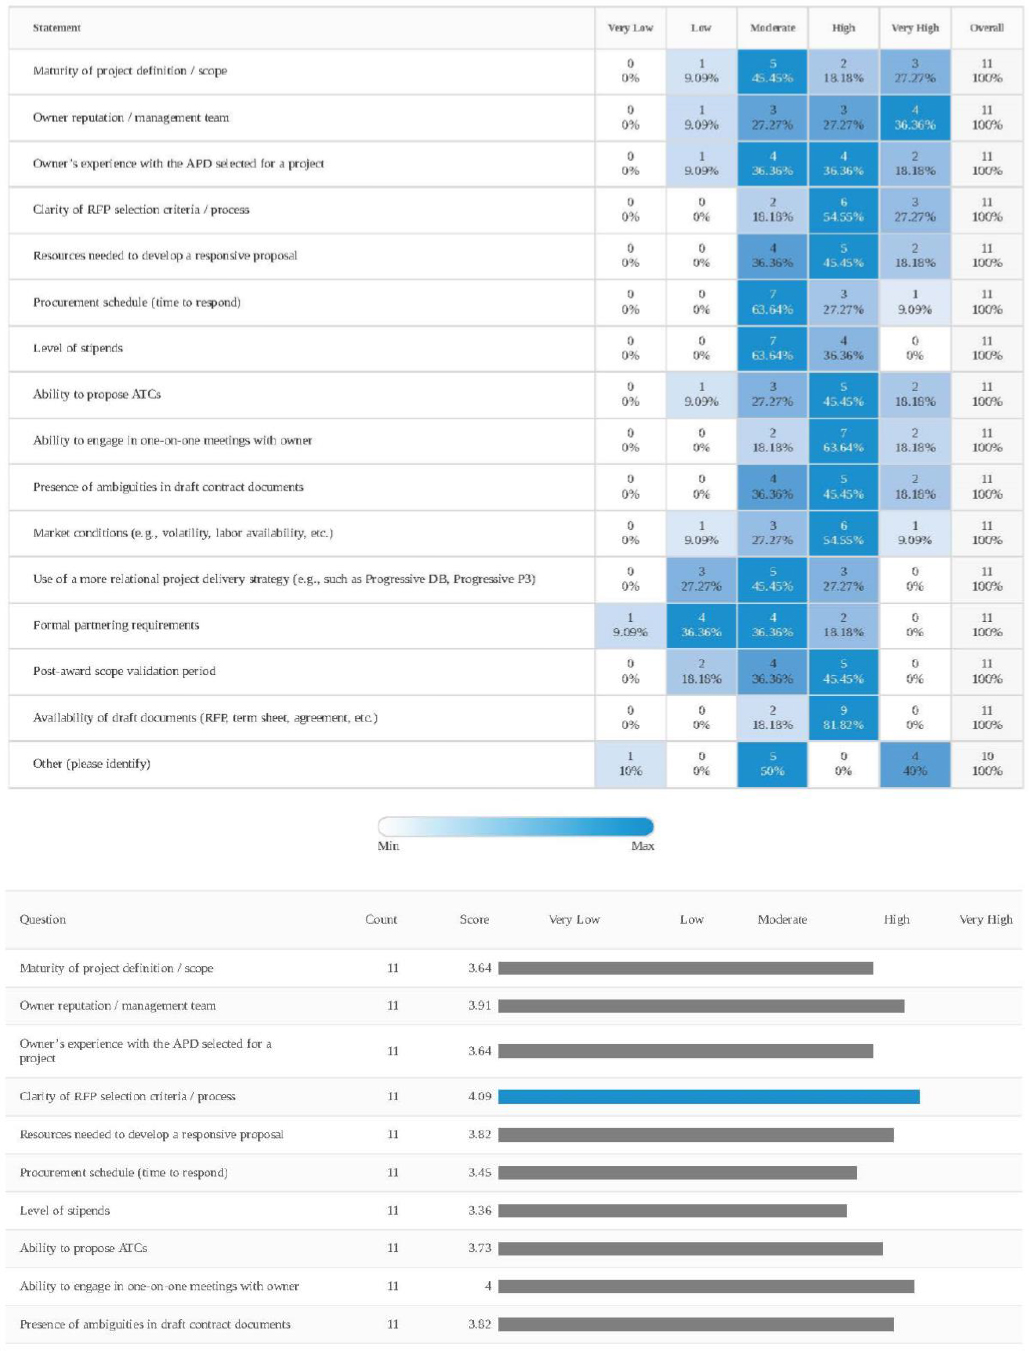
Please rate the extent to which the following could impact your decision to pursue an APD project opportunity.
Please identify the top five risks that you fee
Please identify the top five risks that you feel can impact the successful delivery of a CM/GC or Progressive Design Build project.
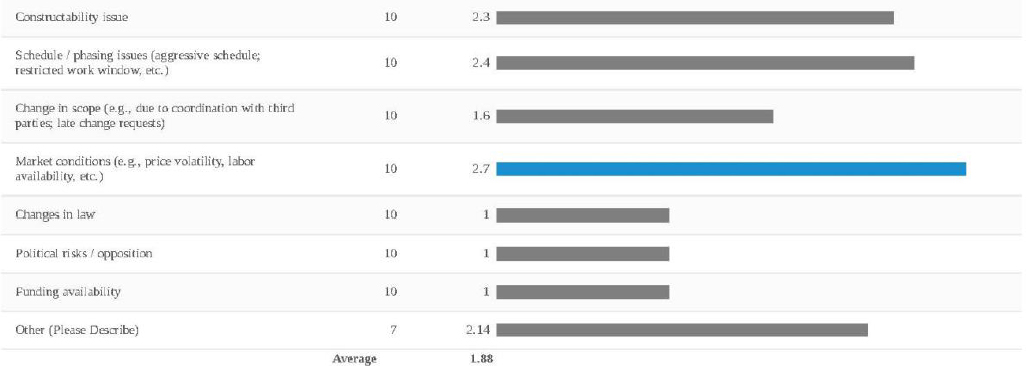
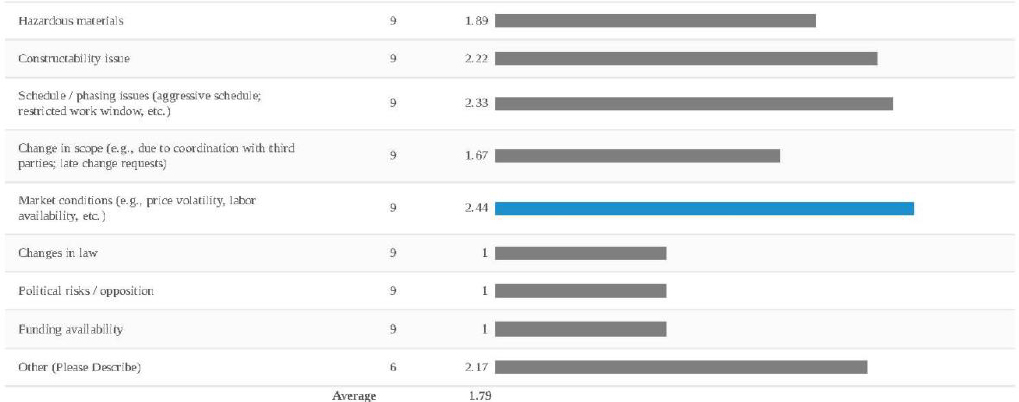
Please identify the top five risks that you feel can impact the successful delivery of a P3 (fixed price) project.
Please identify how risks should be allocated on your Design–Build (DB) projects.
Please identify how risks should be allocated on your Progressive Design–Build or CM/GC method projects.

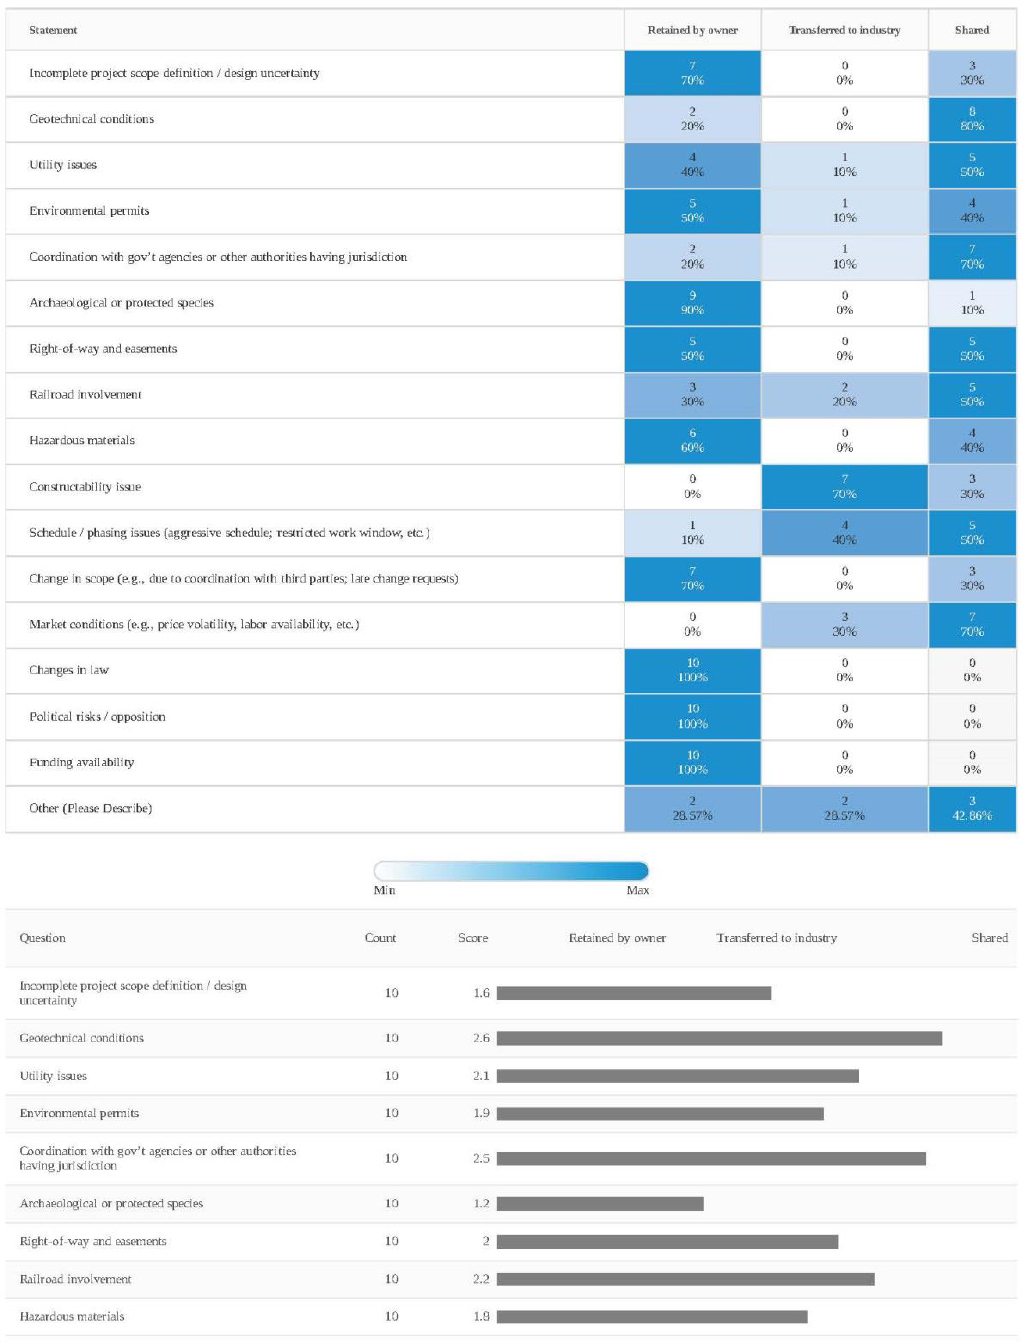
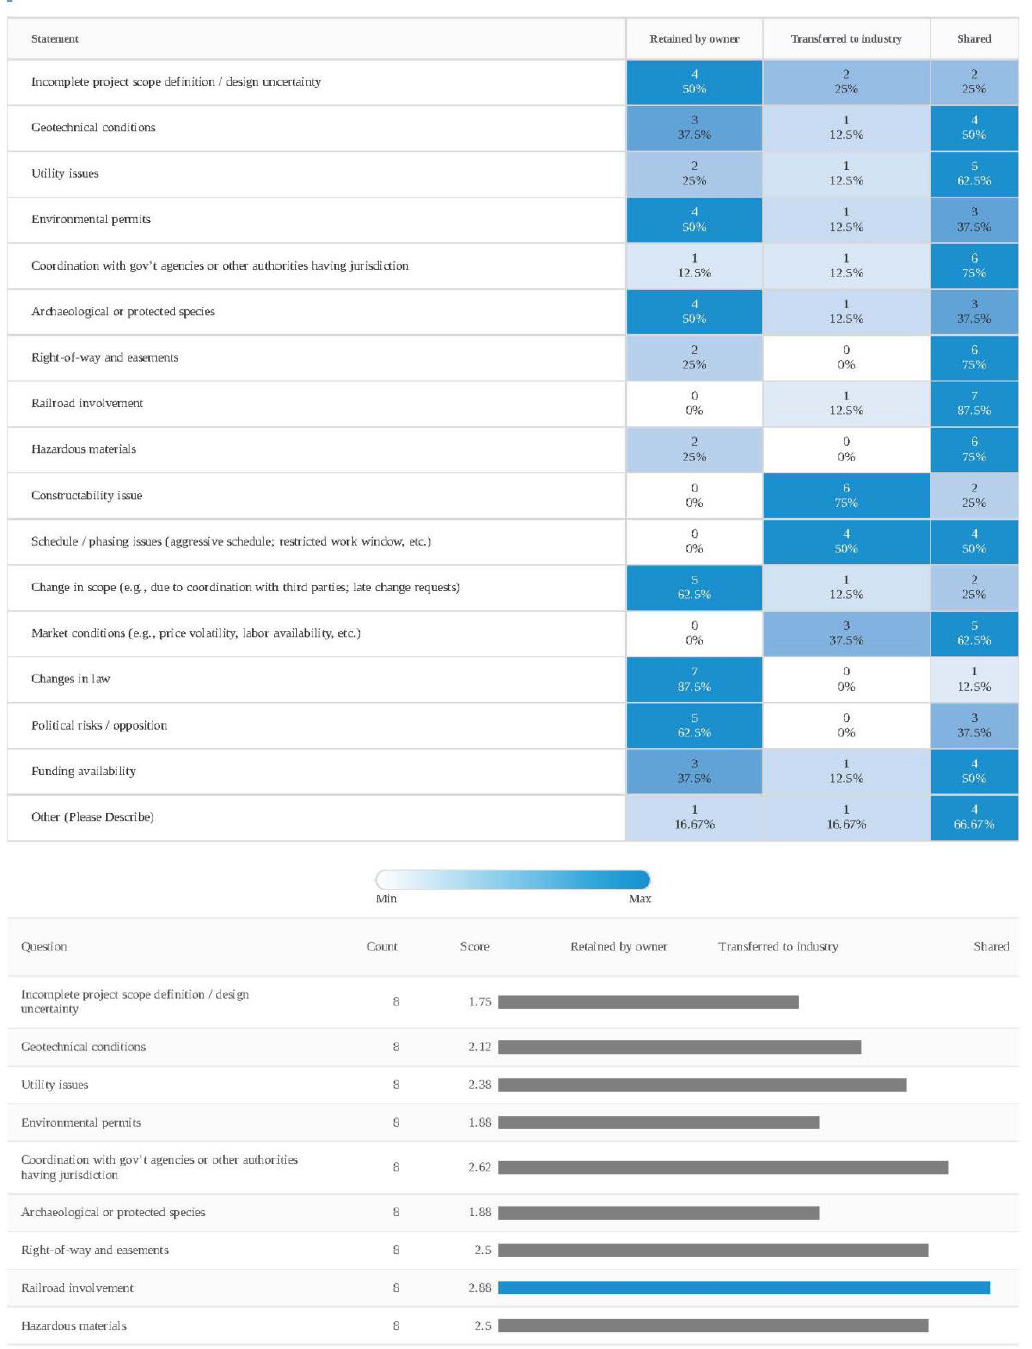
Please identify how risks should be allocated on your P3 projects.
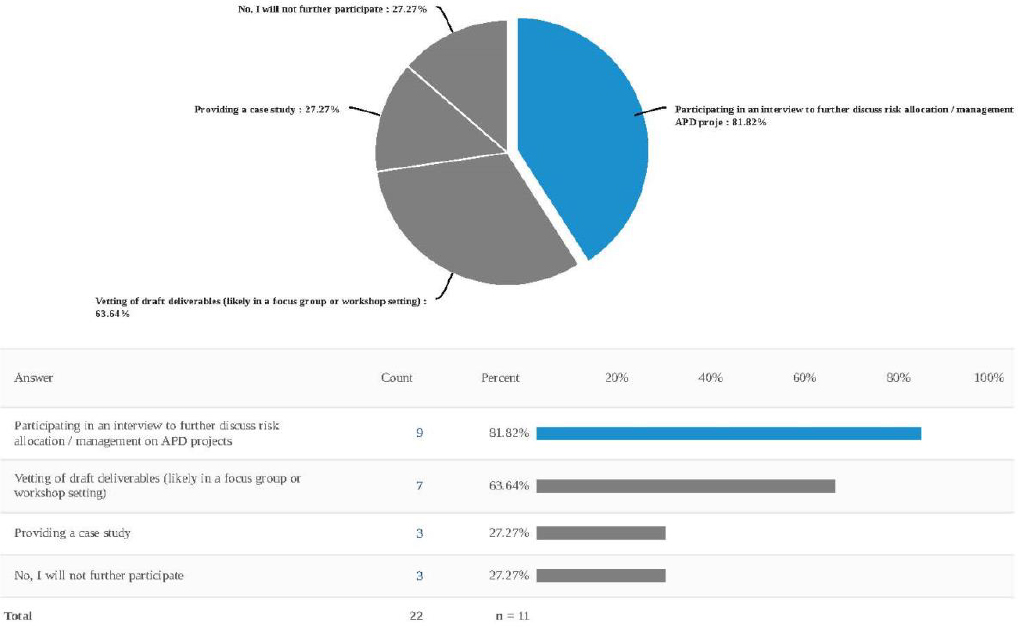
Please identify if you would like to remain involved with any of the following aspects of this research study.