Review of the SBIR and STTR Programs at the Department of Defense (2026)
Chapter: 3 The Landscape of DOD SBIR/STTR Awardees
3
The Landscape of DOD SBIR/STTR Awardees
This chapter focuses on the landscape of funding and awardees for the Department of Defense’s (DOD’s) Small Business Innovation Research (SBIR) and Small Business Technology Transfer (STTR) programs. The objective is to provide descriptive data with which to answer basic questions about the characteristics and geographic locations of firms receiving DOD SBIR/STTR awards. Analysis of the distribution of funding and awards covers the fiscal year (FY) 2012–2023 timeframe. The chapter reviews the distribution of awards across the different components and services within DOD and the geographic distribution of awards across states, drawing comparisons with other DOD spending and venture capital funding.
METHODOLOGY AND SAMPLING
The principal source for this chapter is award data accessed through the Small Business Administration (SBA) website,1 supplemented by data from the National Center for Science and Engineering Statistics’s Survey of Federal Funds for Research and Development, data from USASpending.gov, and data on private-sector funding from Crunchbase and Pitchbook. The focus is on the FY2012–2023 timeframe to take into account changes following the 2011 reauthorization of the SBIR/STTR programs2 and to cover a long enough period to show trends.
DOD made a total of 34,704 SBIR/STTR awards to 6,093 small businesses during the FY2012–2023 timeframe, including Phase I and Phase II awards, Fast-Track awards, Direct to Phase II awards, and Phase IIB awards. The total amount awarded was $17.7 billion over the 12-year period in nominal dollars, or $20.7 billion in 2023 inflation-adjusted dollars. Ending the analysis at FY2023 enabled the committee to consider certain subsequent award outcomes, such as follow-on funding from DOD sources and from angel and venture capital.
___________________
1 https://www.sbir.gov/awards.
2 U.S Congress, National Defense Authorization Act for 2012, P.L. 112-81 (December 31, 2011).
Unfortunately, the SBA award database does not definitively connect later-phase awards with those made earlier to the same company for the same project, which inhibited the committee’s ability to determine the cumulative effects of program funding. Complicating the ability of the committee to match Phase I awards and Phase II awards is the lack of consistent identifiers between Phase I and Phase II awards. Additionally, the titles of the Phase I award and its associated Phase II may differ, and DOD has Direct to Phase II awards, which do not have an associated Phase I award.
PROGRAM STRUCTURE AND PARTICIPATION
SBA oversees the SBIR/STTR programs and provides overall guidelines for implementing the programs across 11 federal agencies. DOD accounts for the largest SBIR/STTR programs, at $2.3 billion, with the next largest being those of the Department of Health and Human Services, at $1.2 billion.3 The SBIR/STTR programs are congressionally mandated set-asides that currently allocate 3.2 percent of a participating agency’s extramural research and development (R&D) budget to SBIR and 0.45 percent to STTR. These percentages represent an increase from the FY2012 allocations of 2.6 percent for SBIR and from 0.35 percent for STTR (see Table 3-1).
DOD’s SBIR and STTR programs are designed to “encourage domestic small businesses’ engagement in research and development, scientific excellence, and technological innovation through federal research fund investment in critical American priorities to build a strong national economy and accelerate Warfighter capabilities” (OSBI, n.d., para. 2). The Office of the Under Secretary of Defense for Research and Engineering (OUSD[R&E]) serves as the Secretary of Defense’s point of contact for Congress, SBA, the Government Accountability Office, and the interagency SBIR/STTR community.4 This SBIR/STTR central oversight and policy organization also seeks technology partnerships within DOD and other federal agencies.
| Fiscal Year | ||||||
|---|---|---|---|---|---|---|
| 2012 | 2013 | 2014 | 2015 | 2016 | 2017 | |
| SBIR | 2.6 | 2.7 | 2.8 | 2.9 | 3.0 | 3.2 |
| STTR | 0.35 | 0.35 | 0.40 | 0.40 | 0.45 | 0.45 |
NOTE: Minimum expenditures for subsequent years remain at fiscal year 2017 levels.
SOURCE: 15 U.S.C., Section 638(f)(1), and 15 U.S.C., Section 638(n)(1)(B).
___________________
3 See https://www.sbir.gov/participating-agencies.
4 USD(R&E) is tasked with leading the program by DOD directive (USD[R&E], 2020).
SBIR and STTR are competitive award programs that typically operate in three phases (SBA, 2023). Phase I awards provide funding for researching the scientific and technical merit, as well as the feasibility, of an idea; this phase is also known as proof of concept. Award amounts vary by agency component, averaging $150,000 with a 12-month duration, although the SBA (2023) Policy Directive currently allows for Phase I awards that exceed $300,000.5 The SBIR Phase I program is highly competitive, with approximately 20 percent of applications receiving funding.6 While venture capital investors operate with far greater selectivity than the SBIR program—screening hundreds of potential opportunities for every investment—firms that apply for DOD SBIR funding must first satisfy statutory eligibility criteria, have the internal capabilities to perform early-stage R&D for defense needs, and in most cases be able to respond to a specific DOD solicitation. This means that the applicant pool is drawn from a substantially narrower, more self-selected set of technology-oriented firms than the population of ventures encountered by venture capital firms.7
Phase II allows successful Phase I awardees to receive further funding for the development, testing, and validation of their innovation. The typical amount of Phase II awards is $1 million, with a 24-month duration, although SBA currently allows for awards up to nearly $2.1 million.8 Many DOD components slightly modify this typical program structure to meet organizational needs; as an example, Figure 3-1 provides an overview of the OUSD(R&E) SBIR/STTR application and award process.
The final phase of the SBIR/STTR programs is Phase III. Phase III activities are not funded with SBIR/STTR funds. Instead, agency components and services or private-sector entities seeking to use the technology developed in earlier phases fund its further development and implementation to address their needs. The transition to Phase III can vary in style and speed and is not guaranteed. A benefit to companies funded by DOD’s SBIR/STTR programs is that if a DOD service or component needs the technology, the company can transition it directly to DOD without competition, saving several months typically spent on
___________________
5 AFWERX currently limits Phase I open topic awards to $75,000. SBA reported that in FY2022, DOD as a whole had 1,172 new Phase I SBIR awards with an obligation of $185,784,181, which corresponds to an average award of $159,000.
6 SBA’s SBIR/STTR Annual Report for Fiscal Year 2022 shows a DOD SBIR Phase I selection rate of 18 percent for DOD as a whole, varying from 9 percent (Army) to 27 percent (other defense agencies) (see SBA, 2022, Table 6, p. 16).
7 The SBIR award rate is comparable to many of the most prestigious and competitive mechanisms in U.S. science funding. In the past decade, R01 grants from the National Institutes of Health typically have had around 20 percent success rates, and the National Science Foundation’s overall proposal success rate ranged between 24 and 26 percent. Though the missions differ, these programs are widely viewed as highly selective. See https://report.nih.gov/nihdatabook/category/10 and https://tableau.external.nsf.gov/views/NSFbyNumbers/Trends?%3AisGuestRedirectFromVizportal=y&%3Aembed=y&%3Alinktarget=_blank&%3Atoolbar=top.
8 SBA’s SBIR/STTR Annual Report for Fiscal Year 2022 shows a Phase II SBIR success rate of 28 percent with 1,334 awards and total obligations of $1,709,252,049, corresponding to an average award of $1.3 million (see SBA, 2022, Table 6, p. 16).
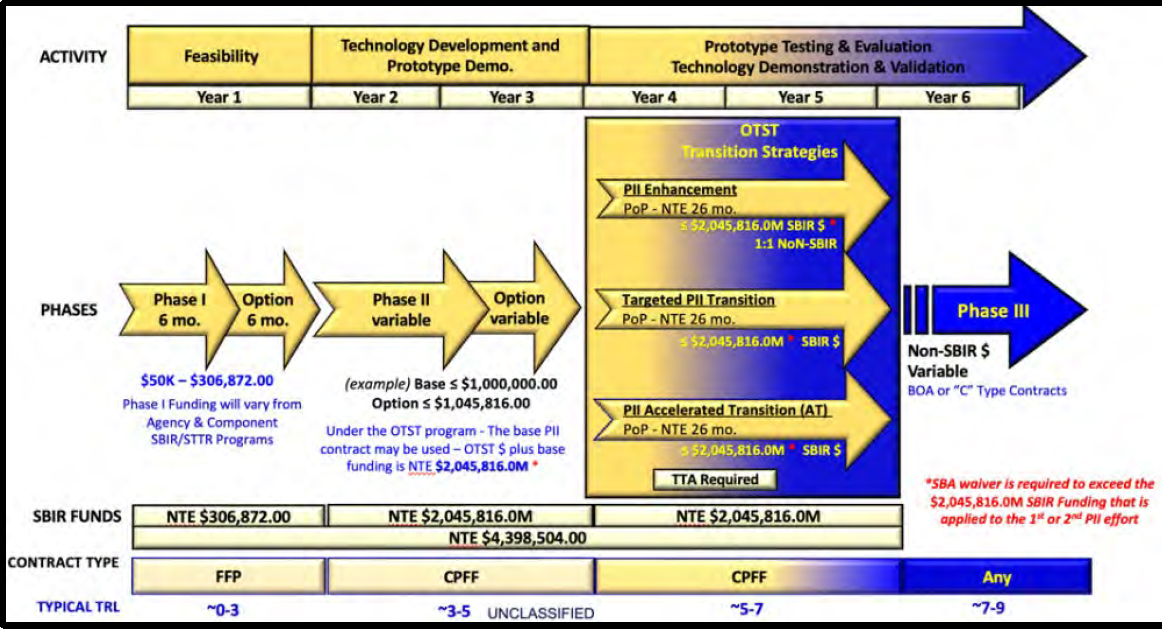
NOTE: Contract Types: CPFF = cost-plus-fixed-fee contract; FFP = Firm Fixed Price. OTST = Office of the Secretary of Defense Transitions SBIR/STTR Technologies Program. TRL=Technology Readiness Level.
SOURCE: Presentation to the committee by Matthew Williams, Department of Defense, December 6, 2023, Washington, DC.
proposal writing and source selection processes. Tracking the transition to Phase III awards is complicated given the many ways in which Phase I/II innovations can mature within the defense acquisition system, including through follow-on R&D awards, contracts for procurement of products or services, subcontracting activity executed by defense prime contractors, or direct commercial-sector investment.9 These Phase III awards, especially those resulting from subcontracting and direct commercial investment, are not easily tracked using current government data sources and reporting systems.
Table 3-2 provides detail on each of the DOD services and components that offered Phase I and II SBIR/STTR awards in FY2023, including the number of awards, the service’s or component’s articulated mission, and the amount of money associated with the awards.10 As discussed above, SBIR and STTR budgets are a percentage of extramural R&D. Detail on DOD R&D funding is shown in Figure 3-2.
Award Amounts
Each DOD service and component participating in the SBIR/STTR programs provides its own guidance on maximum award amounts within the maximum amounts established by SBA based on congressional legislation. SBA allows Phase II awards to exceed the maximum amounts by 50 percent without a waiver. From 2011 to 2021, most of DOD’s Phase I funding amounts were either $100,000 or $150,000,11 and most Phase II awards hovered around $1 million, with smaller peaks at around $1.5 million and above, indicating some variation in funding amounts. Looking at specific DOD services and components, the Assistant Secretary of the Army (Acquisition, Logistics and Technology) SBIR program, for example, issues Phase I awards with amounts up to $250,000 and Phase II awards up to $2 million (U.S. Army, n.d., para 2), whereas the Missile Defense Agency, a component much smaller than the Army, advertises lower maximum award amounts of $100,000 for Phase I and $1 million for Phase II (MDA, 2017). Until recently, AFWERX Phase I open topic proposals were limited to $50,000 (now $75,000) and its specified topics are eligible for Phase I awards of up to $150,000 (2F, 2022). In general, the majority of awards issued by DOD SBIR/STTR programs have been below the SBA threshold. As shown in Figures 3-3 and 3-4, the median award (indicated by the solid black line within each shaded rectangle) in many years is far below the maximum award size
___________________
9 See Chapter 8 for additional discussion.
10 Because the SBA database does not distinguish between Air Force and Space Force awards, these services are combined in the table. Additionally, the Office of Strategic Capital within OUSD(R&E) has recently started making awards.
11 The SBIR/STTR Reauthorization Act of 2011 increased the limit on Phase I awards from $100,000 to $150,000 and on Phase II awards from $750,000 to $1,000,0000, indexed annually for inflation. As of October 2024, the adjusted amounts were up to $314,363 for Phase I awards and $2,095,748 for Phase II awards (including modifications) without a waiver being required (SBA, n.d., para 3).
TABLE 3-2 Overview of DOD Services and Components (Fiscal Year 2023)
| Service/Component | Mission | SBIR/STTR Spending | Count of Phase I SBIR/STTR Awards | Count of Phase II SBIR/STTR Awards |
|---|---|---|---|---|
| Air Force (including Space Force) | To defend the United States and protect its interests through air and space power. | $1,198,302,906 | 997 | 669 |
| Army | To deploy, fight, and win our nation’s wars by providing ready, prompt, and sustained land dominance by Army forces across the full spectrum of conflict as part of the joint force. | $277,905,174 | 175 | 159 |
| Navy | To maintain, train, and equip combat-ready naval forces capable of winning wars, deterring aggression, and maintaining freedom of the seas. | $255,349,990 | 412 | 200 |
| Defense Advanced Research Projects Agency (DARPA) | To make pivotal investments in breakthrough technologies for national security. | $170,941,959 | 7 | 105 |
| Missile Defense Agency | To develop and deploy a layered Missile Defense System to defend the United States, its deployed forces, allies, and friends from missile attacks in all phases of flight. | $84,731,009 | 37 | 52 |
| Defense Health Program | To develop future technologies to improve warfighter health and survival. | $64,186,240 | 20 | 47 |
| Special Operations Command | To provide rapid and focused acquisition, technology, and acquisition logistics support to Special Operations Forces Warfighters. | $43,231,780 | 23 | 26 |
| Defense Logistics Agency | To drive and sustain Warfighter readiness by delivering unmatched global support as the Nation’s Logistics Combat Support Agency. | $37,715,626 | 40 | 33 |
| Office of the Secretary of Defense (OSD) | The OSD Transitions SBIR/STTR Technologies Program (OTST) may fund Phase II awards from other components. | $15,453,510 | 9 | 13 |
| Defense Threat Reduction Agency | To deter strategic attack against the United States and its allies; to prevent, reduce, and counter weapons of mass destruction (WMD) and emerging threats; and to prevail against WMD-armed adversaries in crisis and conflict. | $13,832,899 | 24 | 9 |
| Office for Chemical and Biological Defense | To anticipate and deter future threats by developing and delivering timely chemical and biological (CB) defense capabilities that enable a resilient Joint Force to prevail in CB-contested environments and protect the nation. | $13,830,926 | 19 | 18 |
| National Geospatial-Intelligence Agency | To provide geospatial intelligence in support of national security objectives. | $7,868,511 | 0 | 7 |
| Defense Microelectronics Activity | To deliver microelectronics solutions to meet DOD needs. | $7,588,105 | 12 | 4 |
| Unlisted | $28,305,922 | 0 | 23 | |
| Total | $2,219,244,557 | 1,775 | 1,365 |
SOURCE: SBIR/STTR spending and counts from U.S. Small Business Association’s SBIR/STTR Awards database (SBIR.gov).
![Defense total extramural research, development, test, and evaluation (fiscal years [FY] 2016–2023)](https://www.nationalacademies.org/index.php/read/29329/assets/images/img-82.jpg)
NOTES: The Space Force was established in December 2019. DARPA = Defense Advanced Research Projects Agency; DHA = Defense Health Agency.
SOURCE: Based on data from National Science Foundation, National Center for Science and Engineering Statistics. Survey of Federal Funds for Research and Development. See https://ncses.nsf.gov/surveys/federal-funds-research-development.
(indicated by the dashed red line) allowed by SBA without a waiver (programs are eligible to ask for a waiver from the SBA maximum). Award amounts have shown more variation in recent years, indicating tailoring of award sizes to actual small business and project requirements.
Contract Types
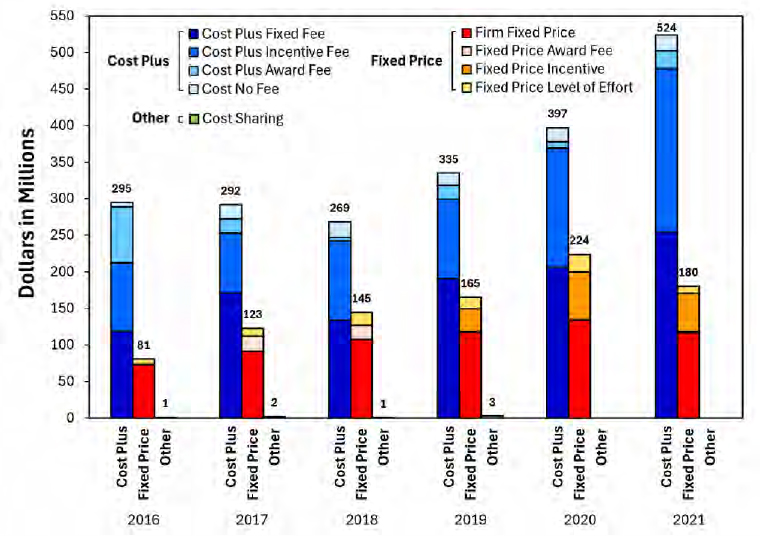
Different DOD services and components use different cost-based or fixed-price contract types but not other mechanisms, such as cooperative agreements and grants, for their SBIR/STTR awards (Figure 3-5). Each service uses a primary contract type for SBIR/STTR awards. In FY2021, for example, the Air Force used primarily cost-plus-fixed-fee contracts (79 percent of SBIR/STTR awards) to fund SBIR/STTR awards. The Army used cost-plus-fixed-fee (47 percent) and firm-fixed-price contracts (27 percent), while the Navy used cost-plus-incentive-fee contracts (64 percent). Some components, such as the Defense Threat Reduction Agency (DTRA), use purchase orders for Phase I awards to speed up the process. The Defense Advanced Research Projects Agency (DARPA) plans to adopt this practice as well. Figure 3-5 aggregates the data for all services and components and shows the variety of contract types used to fund SBIR/STTR awards.
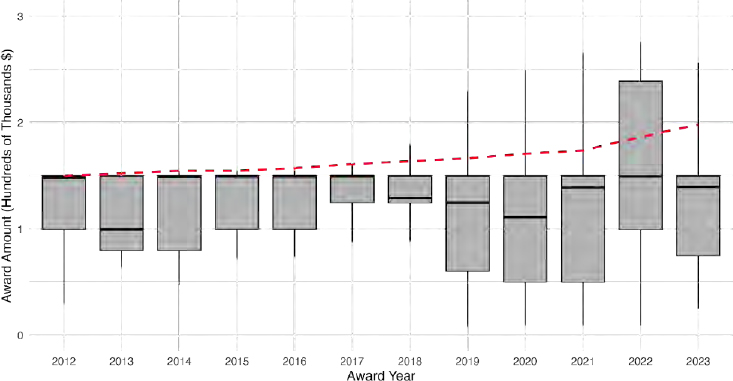
NOTES: Boxes depict the 25th–75th percentiles; solid line indicates the median; whiskers show 1.5x the interquartile range. Red dashed line depicts the maximum award amounts.
SOURCES: Committee calculations based on U.S. Small Business Association’s (SBA’s) SBIR/STTR Awards database (SBIR.gov). Maximum award amounts from SBA, SBIR/STTR policy directives (SBA, 2023, and earlier).
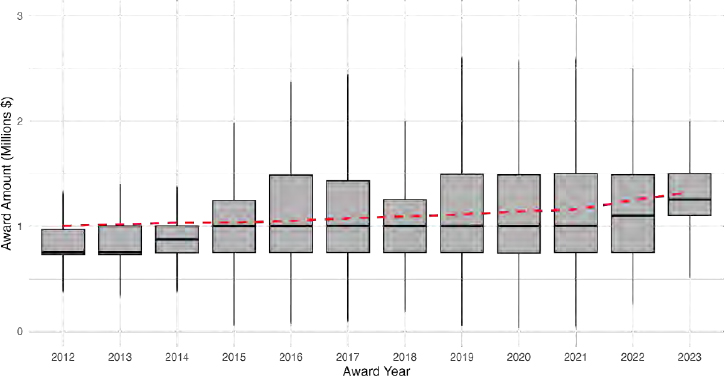
Cost contracts are typically used when the technical risk for contractors and project uncertainty and complexity are higher. Fixed-price contracts are more typically used when the scope and complexity of the work are well understood, and both the government and the contractor have a clear understanding of expectations and deliverables. Because typical Phase I and Phase II awards are limited in size and less complex than large defense systems acquisition programs, the reason for such frequent use of cost contracting methods is unclear, especially given the additional bureaucratic burden such contracts can create related to the delivery of cost and price data to the government, and the auditing of contractor activities. DOD, like most federal agencies, is congressionally mandated to issue awards no more than 180 days after the proposal submission deadline. The complexity of contracting may be limiting participation by small businesses that lack the dedicated staff to deal with the data reporting associated with federal contracts or limiting participation by research institutions that are more accustomed to paperwork involved with government grants.
DISTRIBUTION OF SBIR/STTR FUNDING AND AWARDS
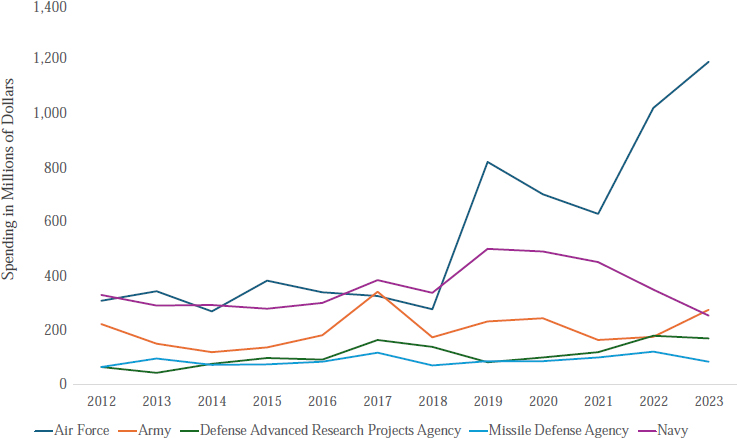
Figure 3-6 shows SBIR/STTR spending for the five largest DOD services or components for the period FY2012–2023. The percentage set-asides
SOURCE: Committee calculations based on Federal Procurement Data System data (accessed via USASpending.gov).
have remained the same since FY2017, but increases or decreases in extramural R&D budgets have led to changes in spending on SBIR/STTR awards. The upward trend for the Air Force after FY2019 can be attributed in part to the creation of the Space Force, which SBA does not distinguish from the Air Force, and in part to increases in the Air Force’s R&D budget; however, the committee was unable to determine whether the increase in FY2019 and decrease in FY2020 were due to a timing issue, a data integrity issue between DOD and SBA, or some other cause.
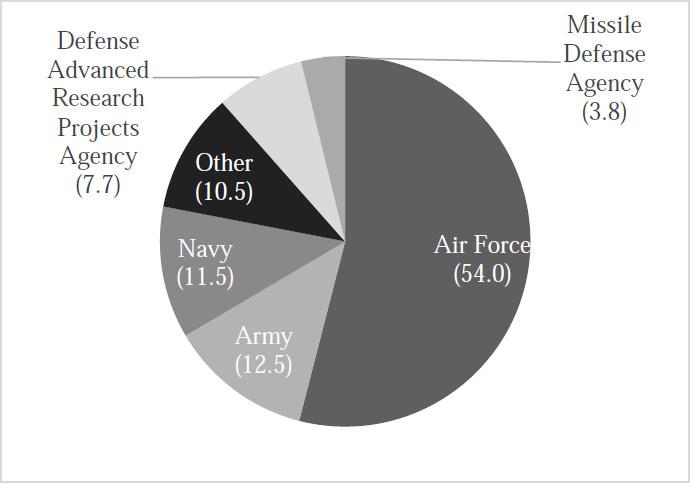
In FY2023, the Air Force and Space Force combined accounted for 54 percent of the total DOD SBIR/STTR funding, and the Army and Navy accounted for 12.5 percent and 11.5 percent, respectively (see Figure 3-7). DARPA represented another 7.7 percent and the MDA 3.8 percent, with the other DOD components collectively accounting for 10.5 percent.12 Although DARPA has a
___________________
12 According to DOD’s SBIR/STTR website, 12 DOD services and components participate in the SBIR/STTR programs. In addition to the five mentioned, they are the Defense Health Agency, United States Special Operations Command, Defense Logistics Agency, Chemical and Biological Defense, Defense Microelectronics Activity, DTRA, and Office of the Secretary of Defense. See https://www.defensesbirsttr.mil/About-Us/History/#Components. Application data from DOD also includes applications from National Geospatial-Intelligence Agency and the Office of Strategic Capital as well as applications to Space Force.
NOTE: All dollar amounts are adjusted to 2023 dollars using the Consumer Price Index (https://www.bls.gov/cpi/).
SOURCE: Committee calculations based on SBA’s SBIR/STTR Awards database (SBIR.gov).
relatively small overall budget compared with the three services (Army, Navy, and Air Force), the bulk (90 percent) of its spending was dedicated to extramural R&D, which is the basis for the SBIR/STTR spending allocation (Gallo, 2021).
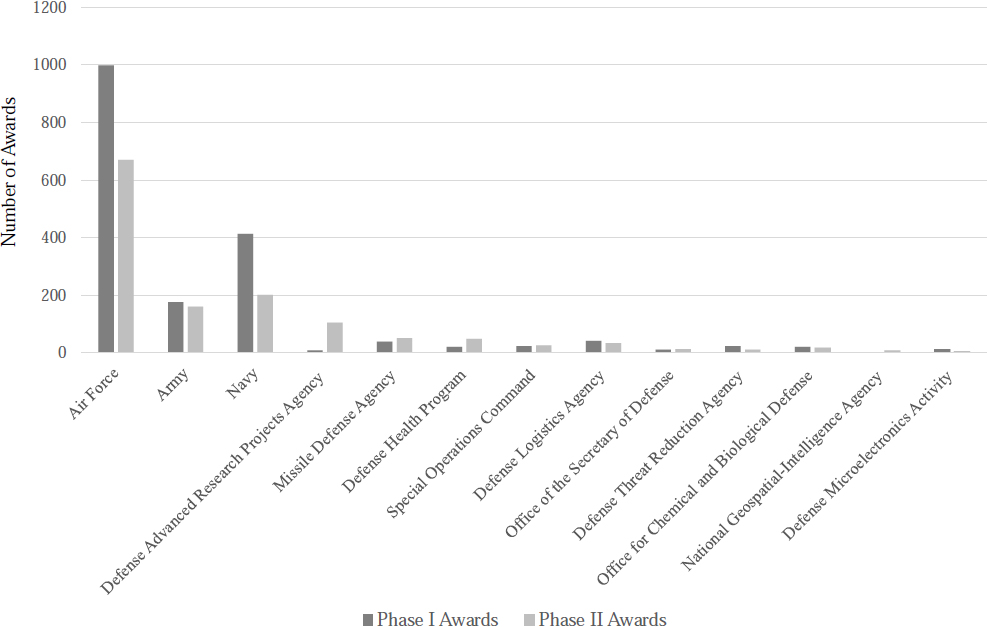
Figure 3-8 shows the distribution of Phase I and Phase II awards across DOD services and components for FY2023. The Air Force accounts for the largest share of awards, issuing approximately 1,000 Phase I and more than 650 Phase II awards during that year. The Navy and Army follow, though at a substantially lower scale, with each issuing fewer than half the number of Phase I awards issued by the Air Force. Other DOD agencies, including DARPA, MDA, and the Defense Health Program, account for a much smaller share of total awards, each issuing fewer than 150 Phase I awards and proportionally fewer Phase II awards.
SOURCE: Committee calculations based on SBA’s SBIR/STTR Awards database (SBIR.gov).
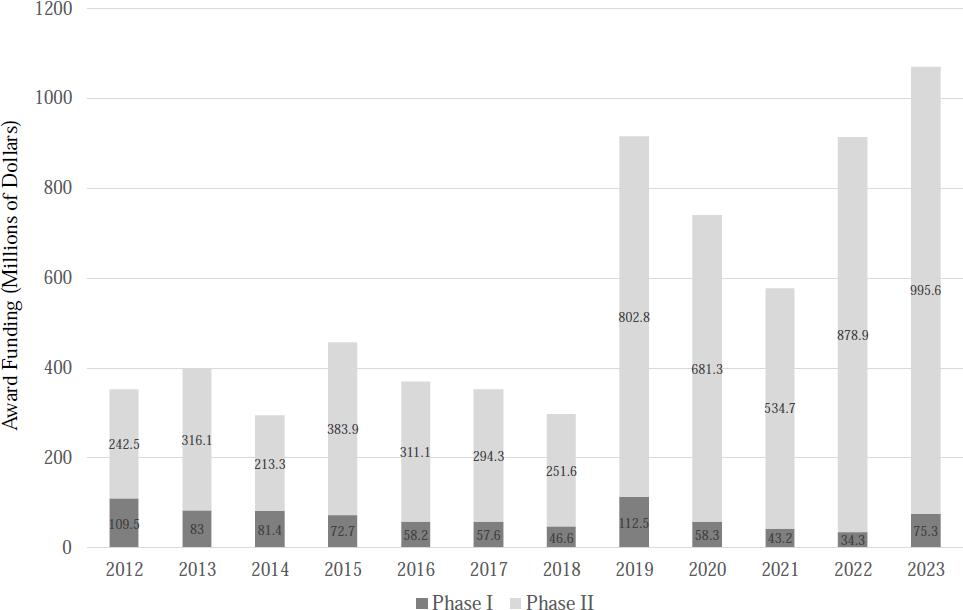
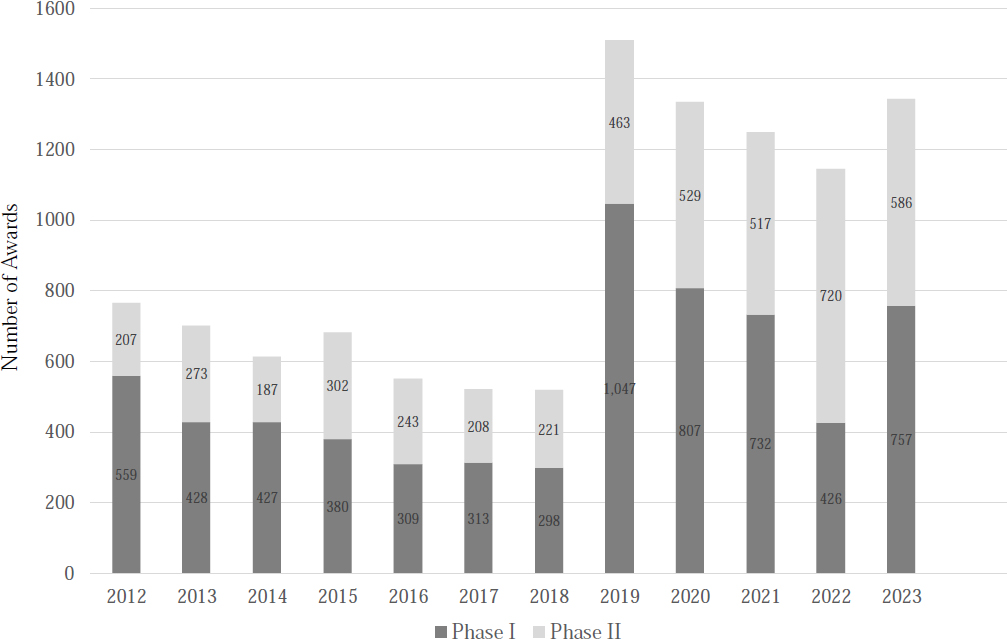
Because of the size of the Air Force SBIR/STTR program and recent programmatic changes favoring open topics, Figures 3-9 and 3-10 take a close look at the Air Force programs, presenting trends in award amounts and number of awards over the FY2012–2023 period. As shown in Figure 3-9, Air Force Phase I funding ranged from $109.5 million in FY2012 to $75.3 million in FY2023. In FY2019, Phase I funding increased to $112.5 million, while Phase II funding rose sharply, from $251.6 million in FY2018 to $802.8 million in FY2019. Phase II funding eventually climbed to $995.6 million in FY2023.
Figure 3-10 presents the number of Phase I and Phase II awards in the Air Force SBIR/STTR programs during the FY2012–2023 period. Although the number of awards remained relatively stable between FY2012 and FY2018—with Phase I awards outnumbering Phase II awards—there was a sharp inflection point in FY2019. The Air Force introduced an open topic model for Phase I awards in FY2018, with small (originally $50,000 and now $75,000) awards. This change corresponded to a substantial increase in the number of Phase I awards offered by the Air Force and a decrease in the share of the Air Force’s total SBIR/STTR spending going to Phase I awards. Phase I awards surged to 1,047 in FY2019, nearly tripling over the previous year. Although the number of Phase I awards declined somewhat in subsequent years, it remained high from FY2020 through FY2023. Phase II awards also increased, rising from 221 in FY2018 to 586 by FY2023.
NOTE: Air Force includes Space Force awards.
SOURCE: Committee calculations based on SBA’s SBIR/STTR Awards database (SBIR.gov).
NOTE: All dollar amounts are adjusted to 2023 dollars using the Consumer Price Index (https://www.bls.gov/cpi/).
SOURCE: Committee calculations based on SBA’s SBIR/STTR Awards database (SBIR.gov).
SOURCE: Committee calculations based on SBA’s SBIR/STTR Awards database (SBIR.gov).
Together, Figures 3-9 and 3-10 show a clear divergence: while the number of Phase I awards rose substantially after FY2018, Phase I funding remained low or declined, reflecting the Air Force’s decision to issue a higher number of smaller, early-stage awards. In contrast, the number and total funding of Phase II awards both increased, signaling a growing emphasis on advancing selected technologies toward later-stage development. These trends reflect the Air Force’s strategic pivot toward later-stage technology maturation and follow-on development, especially after the open topic Phase I solicitation model was introduced in FY2018. The result has been a declining proportion of total SBIR/STTR funds allocated to Phase I despite a high number of Phase I awards, signaling a reorientation of the program toward scaling promising innovations rather than expanding early-stage feasibility testing.
NEW ENTRANTS TO THE DOD SBIR/STTR PROGRAMS
New entrants to the SBIR/STTR programs play a critical role in introducing fresh ideas and novel approaches to government-sponsored innovation efforts. The committee examined differences across the largest SBIR/STTR programs within DOD to learn about their funding of firms and principal investigators that are new to the programs. The distinction between new firms and new principal investigators in the SBIR/STTR programs reflects the difference between organizational and individual entry into the innovation ecosystem. A new firm refers to a business that is funded by the program for the first time. These entrants are important for expanding the pool of innovative small businesses and enhancing competition within the program. In contrast, a new principal investigator is an individual—typically a scientist, engineer, or entrepreneur—who is serving as the lead on a proposal for the first time, even if the firm with which they are affiliated has participated in the program previously. New principal investigators bring fresh technical perspectives and help cultivate the next generation of R&D leadership. Importantly, a firm can be experienced while the principal investigator is new, and vice versa. Understanding this distinction is essential for evaluating how the program supports both organizational innovation and individual researcher development, and for designing policies that broaden participation at both levels.
Summary data for FY2012–2023 are presented in Table 3-3. The Air Force’s movement to making a larger number of smaller Phase I awards has led to a substantial share of firms being first-time SBIR/STTR awardees over this period. For all the components included in the table, the percentage of first-time principal investigators was much higher than the corresponding percentage of new awardees. In the Navy’s SBIR/STTR programs, for instance, only a small share (8 percent) of awardee firms were new to the programs, compared with more than one-third of principal investigators.
TABLE 3-3 New Entrants in the DOD SBIR/STTR Programs, by Service/Component (Fiscal Years 2012–2023)
| Service/Component | Percentage of SBIR/STTR Awardee Firms That Were First-Time Awardees | Percentage of Principal Investigators That Were First-Time Participants in SBIR/STTR |
|---|---|---|
| Navy | 8.2 | 34.4 |
| Missile Defense Agency Defense Advanced Research Projects |
5.4 | 28.0 |
| Agency | 19.7 | 43.6 |
| Army | 10.4 | 35.2 |
| Air Force | 22.4 | 41.6 |
| Average | 13.2 | 36.6 |
NOTE: Data are based on the first time that a firm or individual received any SBIR/STTR funding.
SOURCE: Committee calculations based on SBA’s SBIR/STTR Awards database (SBIR.gov).
GEOGRAPHIC DISTRIBUTION OF AWARDEES
Analyzing the geographic distribution of SBIR/STTR spending is important because it provides insight into whether the programs are broadening access to federal innovation funding beyond traditional innovation hubs. Unlike other DOD contracts, which often are concentrated in established defense regions, or venture capital financing, which is heavily skewed toward coastal urban centers, SBIR/STTR programs are explicitly designed to support small businesses across the country. By comparing SBIR/STTR funding patterns with those of other DOD contracts and private venture capital, the committee could assess whether the SBIR/STTR programs are helping to reduce geographic disparities in innovation opportunity, fostering innovation capacity in underrepresented states and regions, and ensuring that national security R&D benefits from a more diverse and distributed supplier base.
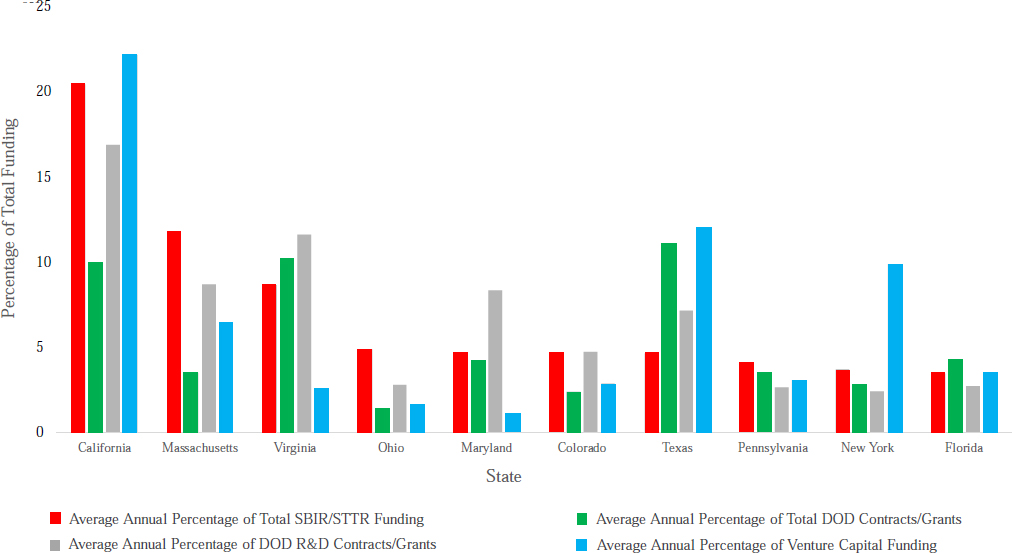
Data for the top 10 states receiving DOD SBIR/STTR funding are reported in Figure 3-11, which compares the average annual percentage of total funding allocated to each state across three categories: SBIR/STTR funding, DOD R&D contracts and grants, and venture capital financing. California leads across all three categories, receiving more than 20 percent of SBIR/STTR and DOD R&D funding, and an even higher share of venture capital investment, underscoring its dominance in both public and private innovation financing. Massachusetts and Virginia also receive substantial shares of SBIR/STTR and DOD R&D funding, though their venture capital shares (particularly that of Virginia) are comparatively lower. Notably, states such as Ohio, Maryland, and Colorado receive a greater proportion of SBIR/STTR funding relative to their
NOTE: All dollar amounts are adjusted to 2023 dollars using the Consumer Price Index (https://www.bls.gov/cpi/). R&D = research and development.
SOURCE: Committee calculations based on SBA’s SBIR/STTR Awards database (SBIR.gov), matched by firm with data from USASpending.gov and Crunchbase.
share of venture capital investment, suggesting that SBIR/STTR may play a compensatory role in regions underrepresented in private capital markets. Conversely, states such as New York and Florida receive a larger share of venture capital funding than of federal R&D support. Overall, the figure suggests that while SBIR/STTR funding is still concentrated in leading innovation states, it is more geographically distributed than venture capital and may help fill funding gaps in states less dominant in defense contracting or private investment.
DOD’s Office of Local Defense Community Cooperation produces an annual report highlighting spending in each state, but this report (Annual Defense Spending by State) does not break down SBIR/STTR spending in each state. The analysis done by the committee is based on the SBA dataset of awardees and does not reflect any subcontracting or research partnering by SBIR/STTR firms (in other words, the entirety of the SBIR/STTR award is attributed to the state in which the small business has an address). A more comprehensive picture of SBIR/STTR funding would more fully illustrate the geographic diversity of SBIR/STTR funding relative to other DOD funding or venture capital funding.
Table 3-4 presents an overview of the distribution of Phase I and initial Phase II SBIR/STTR awards and funding across U.S. states, normalized by population to reveal the relative intensity of support. Per capita metrics are especially useful for comparing innovation intensity across regions, revealing undertapped areas with potential for greater engagement in federal R&D initiatives. Nationally, nearly 30,000 Phase I and Phase II SBIR and more than 5,500 STTR awards were made, amounting to more than $1.8 billion and $2.6 billion, respectively, in 2023 inflation-adjusted dollars. On a per capita basis, this translates to about 8.7 SBIR awards and 1.6 STTR awards per 100,000 residents.
At the state level, Massachusetts was the leader by nearly every metric during the FY2012–2023 period. It had 47.4 SBIR and 8.6 STTR awards per 100,000 residents and demonstrated an extraordinarily dense concentration of federal innovation funding. Colorado, Virginia, Maryland, and New Hampshire also ranked highly on both absolute and per capita measures, reflecting strong DOD research and innovation ecosystems.
New Hampshire, despite its small size, had 34 SBIR awards per 100,000 residents—four times the national average—pointing to a highly competitive innovation sector relative to its population. In contrast, states such as Mississippi, North Dakota, and Iowa received notably fewer awards and less funding per capita. For example, Mississippi had just 0.7 SBIR and 0 STTR awards per 100,000 people, well below national averages.
Some small states and territories, such as Hawaii, Delaware, and Washington, DC, received disproportionately high levels of SBIR/STTR investment relative to their populations. For example, Washington, DC, received more than 20 SBIR awards and 2.5 STTR awards per 100,000 residents, placing it among the highest in the country on this measure.
TABLE 3-4 State Distribution of DOD SBIR and STTR Awards and Funds (Fiscal Years 2012–2023)
| 2023 Population | Total Number of DOD Awards | Total DOD Award Dollars | Number of DOD Awards Per 100,000 Capita | Total DOD Award Dollars Per Capita | |||||
|---|---|---|---|---|---|---|---|---|---|
| State | SBIR | STTR | SBIR | STTR | SBIR | STTR | SBIR | STTR | |
| AK | 736,510 | 8 | 4 | 3,653,350 | 1,444,174 | 1.1 | 0.5 | 5.0 | 2.0 |
| AL | 5,117,673 | 860 | 200 | 539,686,119 | 97,306,784 | 16.8 | 3.9 | 105.5 | 19.0 |
| AR | 3,069,463 | 36 | 13 | 21,658,125 | 4,871,818 | 1.2 | 0.4 | 7.1 | 1.6 |
| AZ | 7,473,027 | 543 | 134 | 320,350,958 | 58,009,929 | 7.3 | 1.8 | 42.9 | 7.8 |
| CA | 39,198,693 | 6,083 | 887 | 3,804,154,455 | 441,183,181 | 15.5 | 2.3 | 97.0 | 11.3 |
| CO | 5,901,339 | 1,392 | 235 | 872,271,979 | 109,845,687 | 23.6 | 4.0 | 147.8 | 18.6 |
| CT | 3,643,023 | 287 | 44 | 167,846,158 | 19,545,992 | 7.9 | 1.2 | 46.1 | 5.4 |
| DC | 687,324 | 139 | 17 | 80,425,018 | 6,104,338 | 20.2 | 2.5 | 117.0 | 8.9 |
| DE | 1,036,423 | 129 | 38 | 76,651,429 | 18,654,476 | 12.4 | 3.7 | 74.0 | 18.0 |
| FL | 22,904,868 | 1,078 | 190 | 645,574,117 | 81,662,469 | 4.7 | 0.8 | 28.2 | 3.6 |
| GA | 11,064,432 | 279 | 74 | 233,227,704 | 32,627,931 | 2.5 | 0.7 | 21.1 | 2.9 |
| HI | 1,441,387 | 256 | 34 | 197,158,749 | 17,289,846 | 17.8 | 2.4 | 136.8 | 12.0 |
| IA | 3,218,414 | 27 | 7 | 16,122,626 | 2,528,028 | 0.8 | 0.2 | 5.0 | 0.8 |
| ID | 1,971,122 | 65 | 12 | 31,750,813 | 4,158,256 | 3.3 | 0.6 | 16.1 | 2.1 |
| IL | 12,642,259 | 405 | 140 | 237,710,591 | 72,119,853 | 3.2 | 1.1 | 18.8 | 5.7 |
| IN | 6,880,131 | 219 | 54 | 142,182,184 | 24,905,708 | 3.2 | 0.8 | 20.7 | 3.6 |
| 2023 Population | Total Number of DOD Awards | Total DOD Award Dollars | Number of DOD Awards Per 100,000 Capita | Total DOD Award Dollars Per Capita | |||||
|---|---|---|---|---|---|---|---|---|---|
| State | SBIR | STTR | SBIR | STTR | SBIR | STTR | SBIR | STTR | |
| KS | 2,951,500 | 62 | 27 | 34,258,138 | 11,381,774 | 2.1 | 0.9 | 11.6 | 3.9 |
| KY | 4,550,595 | 83 | 33 | 32,668,168 | 16,214,651 | 1.8 | 0.7 | 7.2 | 3.6 |
| LA | 4,588,071 | 85 | 25 | 75,841,671 | 5,553,798 | 1.9 | 0.5 | 16.5 | 1.2 |
| MA | 7,066,568 | 3,349 | 608 | 2,144,618,237 | 303,433,417 | 47.4 | 8.6 | 303.5 | 42.9 |
| MD | 6,217,062 | 1,398 | 290 | 811,023,321 | 136,422,260 | 22.5 | 4.7 | 130.5 | 21.9 |
| ME | 1,399,646 | 29 | 4 | 21,738,892 | 514,270 | 2.1 | 0.3 | 15.5 | 0.4 |
| MI | 10,083,356 | 621 | 117 | 371,314,850 | 61,815,518 | 6.2 | 1.2 | 36.8 | 6.1 |
| MN | 5,753,048 | 238 | 36 | 136,727,268 | 14,990,500 | 4.1 | 0.6 | 23.8 | 2.6 |
| MO | 6,208,038 | 118 | 17 | 67,798,870 | 10,932,380 | 1.9 | 0.3 | 10.9 | 1.8 |
| MS | 2,943,172 | 22 | 0 | 11,138,080 | 0 | 0.7 | 0.0 | 3.8 | 0.0 |
| MT | 1,131,302 | 62 | 15 | 39,710,671 | 7,506,769 | 5.5 | 1.3 | 35.1 | 6.6 |
| NC | 10,881,189 | 528 | 103 | 329,105,648 | 52,577,445 | 4.9 | 0.9 | 30.2 | 4.8 |
| ND | 789,047 | 4 | 2 | 1,526,124 | 1,073,214 | 0.5 | 0.3 | 1.9 | 1.4 |
| NE | 1,987,864 | 31 | 5 | 26,118,868 | 3,020,741 | 1.6 | 0.3 | 13.1 | 1.5 |
| NH | 1,402,199 | 477 | 74 | 296,531,299 | 35,383,144 | 34.0 | 5.3 | 211.5 | 25.2 |
| NJ | 9,379,642 | 615 | 119 | 369,315,900 | 47,076,647 | 6.6 | 1.3 | 39.4 | 5.0 |
| NM | 2,121,164 | 401 | 102 | 250,519,511 | 54,835,752 | 18.9 | 4.8 | 118.1 | 25.9 |
| NV | 3,214,363 | 83 | 16 | 45,117,759 | 9,741,571 | 2.6 | 0.5 | 14.0 | 3.0 |
| NY | 19,737,367 | 1,075 | 219 | 652,211,410 | 113,930,138 | 5.4 | 1.1 | 33.0 | 5.8 |
| OH | 11,824,034 | 1,420 | 389 | 861,872,858 | 158,293,755 | 12.0 | 3.3 | 72.9 | 13.4 |
| OK | 4,063,882 | 88 | 38 | 47,564,447 | 13,347,672 | 2.2 | 0.9 | 11.7 | 3.3 |
| OR | 4,253,653 | 206 | 35 | 134,153,754 | 18,176,674 | 4.8 | 0.8 | 31.5 | 4.3 |
| PA | 13,017,721 | 1,112 | 170 | 794,586,511 | 72,517,884 | 8.5 | 1.3 | 61.0 | 5.6 |
| RI | 1,103,429 | 133 | 20 | 77,873,455 | 7,823,612 | 12.1 | 1.8 | 70.6 | 7.1 |
| SC | 5,387,830 | 74 | 12 | 42,969,669 | 5,661,795 | 1.4 | 0.2 | 8.0 | 1.1 |
| SD | 918,305 | 24 | 17 | 14,859,974 | 6,498,166 | 2.6 | 1.9 | 16.2 | 7.1 |
| TN | 7,148,304 | 156 | 43 | 87,212,668 | 17,269,771 | 2.2 | 0.6 | 12.2 | 2.4 |
| TX | 30,727,890 | 1,566 | 329 | 837,270,105 | 145,952,008 | 5.1 | 1.1 | 27.2 | 4.7 |
| UT | 3,443,222 | 296 | 59 | 230,441,826 | 26,731,793 | 8.6 | 1.7 | 66.9 | 7.8 |
| VA | 8,734,685 | 2,415 | 423 | 1,605,364,238 | 197,129,039 | 27.6 | 4.8 | 183.8 | 22.6 |
| VT | 648,708 | 56 | 8 | 38,207,934 | 4,986,500 | 8.6 | 1.2 | 58.9 | 7.7 |
| WA | 7,857,320 | 342 | 57 | 188,578,746 | 33,182,977 | 4.4 | 0.7 | 24.0 | 4.2 |
| WI | 5,930,405 | 77 | 34 | 42,783,592 | 19,268,693 | 1.3 | 0.6 | 7.2 | 3.2 |
| WV | 1,770,495 | 45 | 17 | 31,348,420 | 5,318,187 | 2.5 | 1.0 | 17.7 | 3.0 |
| WY | 585,067 | 49 | 7 | 30,314,579 | 2,998,159 | 8.4 | 1.2 | 51.8 | 5.1 |
| National | 336,806,231 | 29,146 | 5,553 | 18,173,111,835 | 2,613,819,142 | 8.7 | 1.6 | 54.0 | 7.8 |
NOTES: Both Phase I and Phase II SBIR and STTR awards are included. All dollar values adjusted for inflation, with 2023 as base year (https://www.bls.gov/data/inflation_calculator.htm).
SOURCES: Committee calculations based on award data from SBA’s SBIR/STTR Awards database (SBIR.gov). Population data are drawn from U.S. Census Bureau projections for 2020–2024 (https://www.census.gov/data/tables/time-series/demo/popest/2020s-state-total.html).
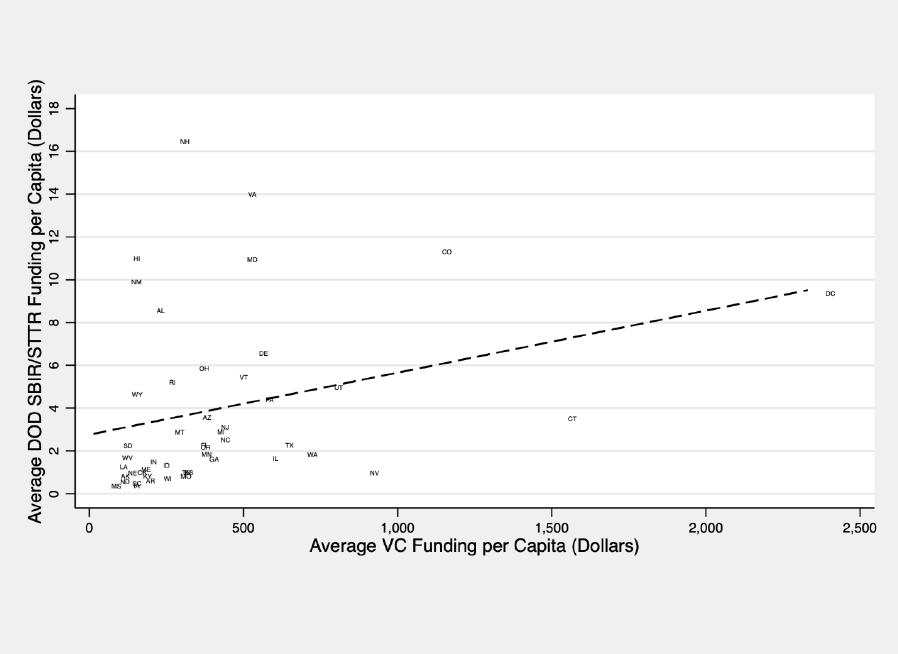
For further perspective, Figure 3-12 compares average DOD SBIR/STTR funding per capita and average venture capital funding per capita across U.S. states for FY2012–2023. Because California, New York, and Massachusetts had high levels of venture capital funding and received many DOD SBIR/STTR awards, they are omitted from the chart to show detailed information for the remaining states.
The diagonal line in Figure 3-12 serves as a reference indicating the trend relationship between venture capital and DOD SBIR/STTR funding. This line reveals a general correlation: states with higher venture capital funding per capita also tend to receive more SBIR/STTR funding per capita. This trend suggests that these programs are complementary rather than substitutes. It is likely that underlying conditions that make a state able to succeed in attracting public funding for R&D, such as having a strong science and engineering workforce or high-quality research institutions, are likely to make the state attractive to private-sector innovation funding as well. Moreover, while this analysis points out only the positive relationship between public and private innovation funding, previous research has shown that public funding can create large innovation spillovers that lead to new firm formation and growth; this, in turn, can attract follow-on private-sector investments (Gross and Sampat, 2023a).
However, this upward trend is not uniform. States above this line, such as New Hampshire, Virginia, and Maryland, receive high SBIR/STTR funding despite modest venture capital investment, suggesting that federal programs may play a more significant role in supporting innovation in those states. Conversely, states such as Connecticut and Nevada exhibit relatively high venture capital funding but lower SBIR/STTR participation. Notably, Washington, DC, stands out with both the highest per capita venture capital and SBIR/STTR funding, reflecting its high density of federal defense contractors. Overall, the figure underscores the complementary yet uneven roles of public and private capital in regional innovation systems.
Some states are clustered in the bottom left corner of Figure 3-12. These states, such as Mississippi, Arkansas, and West Virginia, receive relatively little funding from either source, highlighting persistent regional disparities in innovation finance. Others, such as Ohio and Rhode Island, stand out well above the trend line, indicating that they receive disproportionately high levels of SBIR/STTR funding relative to their venture capital funding. Similarly, Wyoming and South Dakota also perform well in terms of federal support, despite limited venture capital presence. In contrast, states such as Georgia and Minnesota fall below the line, receiving less SBIR/STTR funding than might be expected given their venture capital activity. These regional disparities in SBIR/STTR funding across states could be addressed by focusing on building capacity, improving access, and targeting support to underrepresented regions.
NOTES: Includes trend line. Chart excludes California, New York, and Massachusetts.
SOURCE: Committee calculations based on SBA’s SBIR/STTR Awards database (SBIR.gov), matched by firm with data from Pitchbook.
SUMMARY
DOD’s SBIR and STTR programs show evidence of bringing new entrants into the defense innovation system. Notably the Air Force and Space Force combined now account for more than half of DOD’s SBIR/STTR awards, and the large number of smaller Phase I awards offered by the Air Force and Space Force has increased the number of small businesses that are new to the programs. At the same time, the other services and DARPA are awarding SBIR/STTR contracts to a large proportion of principal investigators that are new to the programs, although they may be working in more experienced small businesses.
DOD’s SBIR/STTR programs do appear to help diversify the geographic base of the defense innovation ecosystem, although more transparency in reporting would help policy makers fully understand the impact of the programs in their state. Importantly, the positive relationship between per capita venture capital funding and per capita DOD SBIR/STTR funding indicates that these programs are complementary. At the same time, the committee’s analysis showed that DOD’s SBIR/STTR programs do help diversify the defense innovation ecosystem. Some states, such as Ohio, receive a relatively large share of DOD SBIR/STTR funding compared with their share of other DOD R&D funding or venture capital funding. Additionally, states such as Maryland, Virginia, and New Hampshire, which do not receive a large share of venture capital funding, do receive a larger share of DOD SBIR/STTR funding.
FINDINGS AND RECOMMENDATIONS
Finding 3-1: It is difficult to link Phase I and Phase II awards because DOD SBIR/STTR award data available through the Small Business Administration database do not provide consistent identifiers for projects across the phases.
Finding 3-2: DOD’s SBIR/STTR programs improve the geographic diversity of the defense supply chain, but more could be done to understand and diversify the geographic reach of the programs.
Finding 3-3: States underserved by venture capital markets benefit from the DOD SBIR/STTR programs.
Recommendation 3-1: The Department of Defense’s (DOD’s) Office of the Under Secretary of Defense for Research and Engineering, working with the Under Secretary of Defense (Comptroller), should develop information systems to provide greater fidelity and precision for the tracking of DOD Small Business Innovation Research/Small Business Technology Transfer (SBIR/STTR) awards, and a single, public portal to access and sort this information. This portal should link awards from Phase I to
Phase II to Phase III in a consistent, clear format. These actions would provide the foundation for improving the programs’ effectiveness and efficiency, as well as communicating the value of DOD SBIR/STTR awards.
Recommendation 3-2: The Department of Defense’s (DOD’s) Office of the Under Secretary of Defense for Research and Engineering, working with the Under Secretary of Defense (Comptroller), should ensure that the DOD Small Business Innovation Research/Small Business Technology Transfer (SBIR/STTR) awards database includes subcontracting activity to SBIR/STTR awardees, whether from prime contractors or defense subcontractors.
This page intentionally left blank.


