Small Populations, Large Effects: Improving the Measurement of the Group Quarters Population in the American Community Survey (2012)
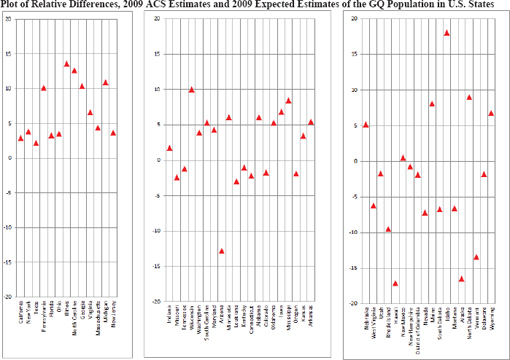
Chapter: Appendix H: Plots of Relative Differences, ACS Estimates from 2005-2009, 2007-2009, and 2009 with Expected Estimates of the Group Quarters Population in U.S. States
Visit
NAP.edu/10766
to get more information about this book, to buy it in print, or to
download it as a free PDF.
Previous Chapter:
Appendix G: The 10 Largest Federal Assistance Programs with Funds Sent Directly to Substate Areas Based on ACS Total Population Estimates, Fiscal Year 2008
 Next Chapter: Appendix I: Plots of Relative Differences, 2005-2009 ACS Estimates and 2007 Expected Estimates of the Group Quarters Population in Selected Counties by Region
Suggested Citation:
"Appendix H: Plots of Relative Differences, ACS Estimates from 2005-2009, 2007-2009, and 2009 with Expected Estimates of the Group Quarters Population in U.S. States." National Research Council. 2012. Small Populations, Large Effects: Improving the Measurement of the Group Quarters Population in the American Community Survey. Washington, DC: The National Academies Press.
doi: 10.17226/13387.
NOTE: Relative differences are defined as 100*(ACS–Interpolated estimate)/Interpolated estimate).
SOURCE: Plots generated by the panel based on data available from U.S. Census Bureau. Available: http://factfinder2.census.gov/faces/nav/jsf/pages/index.xhtml.
Suggested Citation:
"Appendix H: Plots of Relative Differences, ACS Estimates from 2005-2009, 2007-2009, and 2009 with Expected Estimates of the Group Quarters Population in U.S. States." National Research Council. 2012. Small Populations, Large Effects: Improving the Measurement of the Group Quarters Population in the American Community Survey. Washington, DC: The National Academies Press.
doi: 10.17226/13387.

Subscribe to Emails from the National Academies
Stay up to date on activities, publications, and events by subscribing to email updates.