The Future Pediatric Subspecialty Physician Workforce: Meeting the Needs of Infants, Children, and Adolescents (2023)
Chapter: 3 Pediatric Subspecialty Use Data Analyses
3
Pediatric Subspecialty Use Data Analyses
After the committee reviewed the existing literature, it learned that there are no recent data (i.e., within the past 10 years) that comprehensively describe patterns of children’s medical subspecialty physician use. To fill this gap, the committee examined data analyses that used three complementary data sources.1 The first analysis by Carelon Research (formerly HealthCore), the only analysis commissioned by the committee, examined commercially insured individuals enrolled in Elevance Health (formerly Anthem, Inc.).2 The second analysis was submitted to this committee (by multiple researchers, including three members of this committee) and examined electronic health records from individuals obtaining care from eight of the nation’s largest pediatric academic medical centers that participated in PEDSnet,3 a national pediatric learning health system. The third analysis, submitted to the committee by researchers at The George Washington University (including one member of this committee), used the Transformed
___________________
1 All three data analyses submitted to this committee can be found at https://nap.edu/27207.
2 Carelon Research contributed aggregated data on trends in the use of pediatric subspeciality care by children receiving private health insurance coverage through Elevance Health. Carelon Research was not able to confirm the National Academies’ interpretation of Carelon Research data and the accuracy of secondary analyses performed by the National Academies committee presented in this report. Statements herein do not necessarily represent the views and stance of Carelon Research or Elevance Health.
3 For more information on PEDSnet, see https://pedsnet.org (accessed May 16, 2023).
Medicaid Statistical Information System (T-MSIS),4 a national administrative dataset of beneficiaries insured by Medicaid or the Children’s Health Insurance Program (CHIP). Each of these three data sources provides a different assessment of children’s use of subspecialty care: rates for those enrolled in commercial insurance products (Elevance Health), for those who obtain care from large pediatric academic medical centers (PEDSnet), and for those enrolled in Medicaid/CHIP. Our a priori expectation was that the patterns would differ by each of these data sources, but as a collection, they provide a detailed assessment of children’s use of subspecialty care in the United States.
METHODS
The following sections provide an overview of the methods for each of the three data analyses considered by the committee.5
Data Sources
As noted above, the committee examined three separate analyses of pediatric medical subspecialty use that used different data sources.
Elevance Health Data
Elevance Health data were from the Healthcare Integrated Research Database (HIRD®), a large health plan administrative database. Claims data were submitted for payment by health care clinicians for services to individuals enrolled in Elevance Health commercial (i.e., private) plans. The HIRD contains member enrollment, medical care (professional and facility claims), outpatient prescription drug events, and outpatient laboratory test results. All medical claims have associated diagnosis and procedure codes. Claims are subject to the quality control, inspection, and validation procedures performed by the individual health plans for payment processing purposes. The analysis used enrollment files and fully adjudicated claims with service dates between January 2011 and December 2021.
___________________
4 For more information on T-MSIS, see https://www.medicaid.gov/medicaid/data-systems/macbis/transformed-medicaid-statistical-information-system-t-msis/index.html (accessed May 16, 2023).
5 More information on the methods of each data analysis can be found within the full submissions to the committee; see https://nap.edu/27207.
PEDSnet Data
PEDSnet data are imported from individual hospital electronic health record systems and standardized to a common data model. Participating institutions included: Ann & Robert H. Lurie Children’s Hospital of Chicago, Children’s Hospital Colorado, Children’s Hospital of Philadelphia, Cincinnati Children’s Hospital Medical Center, Nationwide Children’s Hospital, Nemours Children’s Health, Seattle Children’s Hospital, and Stanford Children’s Health. Within the PEDSnet database, the study cohort included patients with at least one outpatient visit where the clinician specialty was general pediatrics in one of the academic pediatric medical centers during the time period of January 2010 to December 2021, and where the patient age was less than 21 years old at the end of the calendar year. The PEDSnet data also provided information on payer and patient race and ethnicity. For analyses that examined any subspecialty use across the full study period, insurance was defined as public insurance (i.e., Medicaid or CHIP) if at any time that was their payment for outpatient visits; otherwise, if they ever listed as private/commercial insurance in their general outpatient visits, they are listed as “commercial,” and all others are listed as “unknown/self-pay.” To reduce the number of patients with missing race and ethnicity data, we used the recommended CDC approach for a combined race/ethnicity variable in which “ethnicity” was used to define the Hispanic category and race was used if non-Hispanic (Yoon et al., 2021).
T-MSIS Data
The T-MSIS is a national dataset of Medicaid and CHIP data from states, territories, and the District of Columbia. T-MSIS data included enrollment, service use, and clinician information. The first available year of T-MSIS is 2016; the analysis used data from 2016 through 2019. Data characteristics of the T-MSIS are reported by the Centers for Medicare & Medicaid Services.6 The analysis included data from 44 states, DC, and Puerto Rico, and excluded Arkansas, California, Delaware, Indiana, Minnesota, and Pennsylvania.7
Subspecialty Use Rate
To evaluate children’s use of pediatric subspecialty care, subspecialty use was defined as the annual number of children with at least one completed visit to any subspecialist in an outpatient setting per population. This
___________________
6 For more information, see https://www.medicaid.gov/dq-atlas/welcome (accessed May 4, 2023).
7 Six states were excluded due to high percentages of missing data.
measure excludes patients for whom a referral to a subspecialist was made but the visit was not completed. These use rates excluded visits to subspecialists in emergency department or inpatient settings. The PEDSnet analysis included annual rates of patients seeing multiple types of subspecialties, defined as having at least one visit with more than one subspecialty type in that year. Both Elevance Health and PEDSnet cohorts were comprised of children and youth aged less than 21 years and computed annual specialty use rates from 2011 to 2021. The PEDSnet analysis provided contrasts of children insured by Medicaid/CHIP versus children who are commercially insured children as well as differences by race/ethnicity. The subspecialty use rate calculation for these analyses was any subspecialty use across the observation period.
The Elevance Health denominators required that individuals over one year of age have at least 6 months of plan enrollment in a given year; individual calendar year denominators ranged from 4,998,694 to 5,439,618. The PEDSnet denominator included individuals with a visit to a general pediatrician and was therefore a use-based sample of primary care users at the 8 hospitals; calendar year denominators rose every year, increasing from 493,628 in 2011 to 858,551 in 2021. The T-MSIS analysis included beneficiaries less than 19 years old in calendar years 2016 through 2019 only who were insured by Medicaid/CHIP at any point in a given year. The age range for this cohort was chosen to align with the Medicaid/CHIP eligibility group—that is, children younger than 19 years. The analysis identified children insured by Medicaid/CHIP in each calendar year with any outpatient visit and computed the annual number of children less than 19 years old insured by Medicaid/CHIP with at least one visit to a subspecialist in an outpatient setting per 1,000 total children less than 19 years insured by Medicaid/CHIP using each specialty or profession in a year. For primary care physicians and advanced practice clinicians, reported in Chapter 4, a similar use rate was calculated. The T-MSIS analysis further included pediatric and adult medical subspecialties and examined subspecialist use rates by beneficiary age range (i.e., less than 1 year, 1 to 11 years, and 12 to 18 years). The calendar year denominators for total children insured by Medicaid/CHIP ranged from 32,545,218 to 33,585,419.
Subspecialties
For the commissioned analysis done by Carelon Research, the committee identified 25 pediatric medical subspecialties to be analyzed. This included 14 pediatric subspecialties for which the American Board of Pediatrics (ABP) provides board certification: adolescent medicine, pediatric cardiology, child abuse pediatrics, pediatric critical care medicine, developmental-behavioral pediatrics, pediatric emergency medicine, pediatric
endocrinology, pediatric gastroenterology, pediatric hematology/oncology, pediatric infectious diseases, neonatal-perinatal medicine, pediatric nephrology, pediatric pulmonology, and pediatric rheumatology. Pediatric critical care medicine, pediatric emergency medicine, neonatal-perinatal medicine were included in overall outpatient specialist use rates, but because these specialties provide so few outpatient services, they were excluded from specialty-specific calculations. Pediatric hospital medicine was excluded because it does not typically provide care in outpatient settings. The committee included the five subspecialties that the ABP co-sponsors for which board certification is administered by other specialty boards: hospice and palliative medicine, medical toxicology, sleep medicine, sports medicine, and pediatric transplant hepatology. Finally, the committee identified an additional six subspecialties that are included in combined training programs, have certifications by specialty boards that are not co-sponsored by ABP, or do not have formal certification programs, but are commonly recognized as pediatric medical subspecialties: pediatric allergy and immunology, child neurology, obesity medicine, pediatric dermatology, clinical genetics, and pediatric rehabilitation medicine. The PEDSnet and T-MSIS analyses examined the same 23 subspecialties. The T-MSIS analysis also examined adult medical subspecialties that corresponded to the included pediatric subspecialties, excluding those with no adult counterpart (i.e., adolescent medicine, child abuse pediatrics, clinical genetics, developmental-behavioral pediatrics, and neonatal-perinatal medicine) as well as psychiatry, family medicine, internal medicine, obstetrics and gynecology, advanced practice nurses, and physician assistants. (This chapter will focus on the T-MSIS results for pediatric subspecialty care. See Chapter 4 for analysis of other clinicians.)
RESULTS
The following sections include the committee’s analysis of the results of the three data analyses, including temporal trends, use rates by subspecialty type, subspecialist use by payer and race/ethnicity, the most common diagnoses by subspecialty, and an analysis of the adult subspecialty workforce providing care to children. It is important to note that not all of the analyses examined all of the same variables, and so the sources are indicated for each set of results.
Temporal Trends
Among children in the Elevance Health cohort, annual rates of subspecialist use rose from 7.9 percent in 2011 to 10.4 percent in 2021, an absolute increase of 2.5 percentage points and a relative increase of 31.6 percent
(see Figure 3-1). Rates of subspecialist use in the four years of T-MSIS data were slightly lower than those of the commercially insured Elevance Health population (ranging from 7.9 percent to 9.2 percent), and stable across the observation period.
Subspecialist use rates for children in the PEDSnet academic medical center cohort across the study period ranged from 18 to 21 percent, while the number of children with at least one general pediatrician visit at that center (i.e., eligible denominator for the rates) rose markedly (see Figure 3-2). Because the number of children in the denominator rose each year, the absolute number of children with a subspecialist visit increased from 97,596 to 172,104. Within the PEDSnet cohort, children with visits to two or more types of subspecialists increased by 1.2 percentage points (from 4.7 percent in 2011 to 5.9 percent in 2021), a relative rise of 25.5 percent over
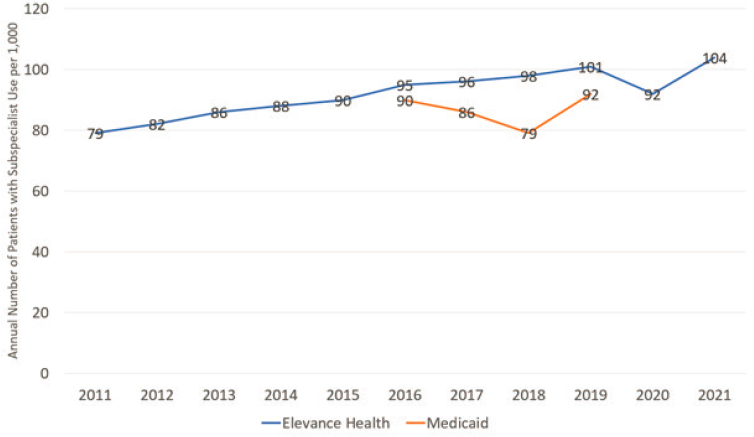
NOTES: The commercially insured data is based on the Carelon Research data analysis; the publicly insured data is based on the T-MSIS Medicaid/CHIP cohorts. The chart shows trends across an 11-year period from 2011 to 2021 for the commercially insured Elevance Health cohort and a 4-year period from 2016 to 2019 for the national Medicaid/CHIP cohort. A child was categorized as having subspecialist use if they had one or more visits in an outpatient setting with one of the 25 pediatric medical subspecialties in that year. Denominators for Elevance Health included children enrolled for at least 6 months for a given calendar year. Denominators for T-MSIS include children enrolled at any time over the course of a year.
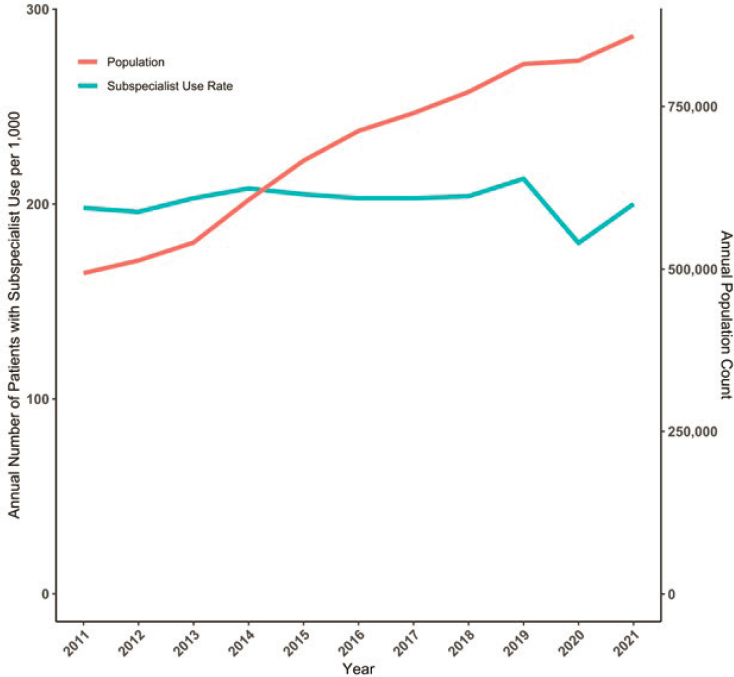
NOTES: The chart shows trends in annual subspecialty use rates and the size of the eligible population (i.e., at least one visit to a general pediatricianat the academic medical health system in the index or prior year) across an 11-year period from 2011 to 2021 for children less than 21 years in the PEDSnet academic medical center cohort. A child was categorized as having any subspecialist use if they had one or more visits in an outpatient setting with one of the pediatric medical subspecialties.
this time period. Although rates dropped in calendar year 2020 due to the pandemic, they returned to prepandemic levels in 2021.
Use Rates by Subspecialty Type
The change over time in annual subspecialist use rates varied markedly by type of subspecialist and by cohort. For the Elevance Health cohort (see Table 3-1), 20 of the 21 subspecialities with sufficient sample size for
estimation experienced an increase. In the PEDSnet academic medical center cohort (see Table 3-2), 14 of 22 subspecialties experienced increases. In both data sources, child neurology, pediatric cardiology, pediatric endocrinology, and pediatric gastroenterology were among the subspecialties with the highest use rates. In the Elevance Health data, the use rate for pediatric infectious diseases was stable until 2021 when it doubled, likely a result of care for children with COVID-19.
TABLE 3-1 Change in the Annual Outpatient Subspecialist Use Rates, 2011 versus 2021, by Pediatric Medical Subspecialty, Elevance Health Data
| Pediatric Medical Subspecialty | Subspecialty Use Rate per 1,000 Children | Percentage Relative Change | |
|---|---|---|---|
| 2011 | 2021 | ||
| Adolescent Medicine | 34.2 | 35.6 | 4 |
| Child Abuse Pediatrics | <0.1 | <0.1 | n/a |
| Child Neurology | 7.2 | 9.9 | 38 |
| Clinical Genetics | 1.1 | 1.3 | 18 |
| Developmental-Behavioral Pediatrics | 2.8 | 2.4 | –14 |
| Hospice and Palliative Medicine | 0.2 | 0.2 | –27 |
| Medical Toxicology | <0.1 | <0.1 | n/a |
| Obesity Medicine | <0.1 | <0.1 | n/a |
| Pediatric Allergy/Immunology | 2.2 | 2.5 | 14 |
| Pediatric Cardiology | 10.6 | 15.2 | 43 |
| Pediatric Dermatology | 1.8 | 2.5 | 39 |
| Pediatric Endocrinology | 6.0 | 8.9 | 48 |
| Pediatric Gastroenterology | 7.0 | 10.4 | 49 |
| Pediatric Hematology/Oncology | 2.2 | 3.7 | 64 |
| Pediatric Infectious Diseases | 0.9 | 2.3 | 144 |
| Pediatric Nephrology | 1.2 | 1.9 | 58 |
| Pediatric Pulmonology | 4.0 | 5.0 | 25 |
| Pediatric Rehabilitation Medicine | 0.3 | 0.6 | 100 |
| Pediatric Rheumatology | 0.9 | 3.6 | 300 |
| Pediatric Transplant Hepatology | <0.1 | <0.1 | n/a |
| Sleep Medicine | 0.6 | 0.7 | 17 |
| Sports Medicine | 1.2 | 2.8 | 133 |
NOTES: Carelon Research data are from beneficiaries enrolled in an Elevance Health (formerly Anthem, Inc.) health plan (i.e., commercial insurance). Annual use rates were computed as the number of children with one or more visits to a pediatric subspecialist per 1,000 beneficiaries.
TABLE 3-2 Change in the Annual Outpatient Subspecialist Use Rates, 2011 versus 2021, by Pediatric Medical Subspecialty, PEDSNet
| Pediatric Medical Subspecialty | Subspecialist Use Rate per 1,000 Children | Percentage Relative Change | |
|---|---|---|---|
| 2011 | 2021 | ||
| Adolescent Medicine | 14.5 | 17.0 | 18 |
| Child Abuse Pediatrics | 1.1 | 0.5 | –53 |
| Child Neurology | 20.9 | 24.1 | 15 |
| Dermatology | 11.0 | 17.8 | 61 |
| Developmental-Behavioral Pediatrics | 19.4 | 27.4 | 41 |
| Genetics | 4.2 | 5.7 | 36 |
| Hospice and Palliative Medicine | 0.6 | 0.4 | –35 |
| Medical Toxicology | <0.1 | <0.1 | n/a |
| Obesity | <0.1 | <0.1 | n/a |
| Pediatric Allergy and Immunology | 19.9 | 22.0 | 10 |
| Pediatric Cardiology | 28.7 | 32.1 | 12 |
| Pediatric Endocrinology | 17.6 | 22.0 | 25 |
| Pediatric Gastroenterology | 26.3 | 36.9 | 40 |
| Pediatric Hematology/Oncology | 11.4 | 12.4 | 9 |
| Pediatric Infectious Diseases | 3.2 | 2.5 | –21 |
| Pediatric Nephrology | 5.6 | 12.8 | 127 |
| Pediatric Pulmonology | 15.7 | 18.3 | 17 |
| Pediatric Rheumatology | 4.0 | 5.0 | 26 |
| Pediatric Transplant Hepatology | <0.1 | 0.6 | n/a |
| Rehabilitation | 15.1 | 10.8 | –29 |
| Sleep Medicine | 1.5 | 1.0 | –34 |
| Sports Medicine | 3.5 | 7.7 | 118 |
NOTES: PEDSnet data are from eight large pediatric academic medical centers. Annual subspecialist use rates were computed as the number of children with one or more visits to a pediatric subspecialist per 1,000 individuals with a general pediatrician visit during the index or prior calendar year.
Although the T-MSIS data are limited to 2016 through 2019 (see Table 3-3), similar to the Elevance Health and PEDSnet cohorts, child neurology, pediatric cardiology, pediatric endocrinology, and pediatric gastroenterology had some of the highest subspecialist use rates. However, pediatric dermatology and pediatric emergency medicine also experienced high rates of beneficiary use. The committee notes that these data are restricted to
TABLE 3-3 Change in the Annual Outpatient Subspecialist Use Rates, 2016 vs. 2019, by Pediatric Medical Subspecialty, T-MSIS
| Pediatric Medical Subspecialty | Subspecialist Use Rate per 1,000 Children with Medicaid/CHIP | Percentage Relative Change | |
|---|---|---|---|
| 2016 | 2019 | ||
| Adolescent Medicine | 28.2 | 26.6 | –6% |
| Child Abuse Pediatrics | 0.4 | 0.4 | –4% |
| Child Neurology | 6.4 | 7.2 | 13% |
| Clinical Genetics | 1.3 | 1.3 | –2% |
| Developmental-Behavioral Pediatrics | 3.6 | 3.7 | 5% |
| Pediatric Hospice and Palliative Medicine | 0.3 | 0.3 | –14% |
| Pediatric Medical Toxicology | <0.1 | <0.1 | n/a |
| Pediatric Obesity Medicine | 0.1 | <0.1 | n/a |
| Pediatric Allergy/Immunology | 0.8 | 1.0 | 26% |
| Pediatric Cardiology | 7.4 | 8.4 | 13% |
| Pediatric Dermatology | 8.3 | 8.7 | 5% |
| Pediatric Endocrinology | 5.8 | 6.4 | 11% |
| Pediatric Gastroenterology | 6.3 | 7.6 | 20% |
| Pediatric Hematology/Oncology | 4.2 | 4.5 | 6% |
| Pediatric Infectious Diseases | 2.2 | 2.3 | 8% |
| Pediatric Nephrology | 2.0 | 2.2 | 13% |
| Pediatric Pulmonology | 4.7 | 5.1 | 9% |
| Pediatric Rehabilitation Medicine | 0.3 | 0.4 | 5% |
| Pediatric Rheumatology | 0.7 | 0.9 | 26% |
| Pediatric Transplant Hepatology | <0.1 | <0.1 | n/a |
| Pediatric Sleep Medicine | 0.2 | 0.3 | 74% |
| Pediatric Sports Medicine | 0.8 | 1.1 | 28% |
NOTE: T-MSIS is a national dataset of Medicaid/CHIP claims. Annual subspecialist use rates were computed as the number of beneficiaries less than 19 years old insured by Medicaid/CHIP with one or more visits to a pediatric subspecialist per 1,000 beneficiaries less than 19 years old insured by Medicaid/CHIP.
outpatient clinics and excluded visits to emergency departments or inpatient care settings. The high rate of pediatric emergency medicine may be due to the inclusion of urgent care visits in the T-MSIS analysis, which are not included in the other two dataset analyses.
A few patterns of use emerge across the three cohorts. For example, children insured by Medicaid/CHIP had higher subspecialist use rates to developmental-behavioral pediatrics compared with individuals in the commercially insured Elevance Health cohort, but lower use rates compared with the academic medical center PEDSnet cohort. Pediatric cardiology rates were lower for the population insured by Medicaid/CHIP in comparison with both the Elevance Health and PEDSnet cohorts.
Subspecialist Use by Payer and Race/Ethnicity Groups, PEDSnet Data Only
On average, patients in the PEDSnet cohort were 5.5 years old on cohort entry. The cohort was 49 percent female, 13.6 percent Hispanic, 26.2 percent non-Hispanic Black/African-American, 39.6 percent non-Hispanic White, 5.7 percent Asian/Pacific Islander, 3.2 percent Multiple Race, and 11.8 percent other or unknown. The payer status was 43.3 percent commercial, 46.7 percent Medicaid/CHIP, and 10.0 percent unknown/self-pay. Across the full duration of the 11-year study period, patients averaged 4 years (SD 3.4 years) of follow-up care, and 43.3 percent of patients had at least one subspecialist visit during that time period (see Figure 3-3). This proportion varied by payer, with nearly half of patients insured by Medicaid/CHIP experiencing use of at least one subspecialist. In additional analyses (data not shown), the committee found that annual rates of subspecialist use were consistently higher for patients with Medicaid insurance versus commercial insurance. In addition, the proportion of patients insured by Medicaid/CHIP that had visits with multiple types of subspecialists was nearly twice as high as those with commercial insurance.
As seen in Figure 3-4, Hispanic, non-Hispanic Black/African-American patients and multiple-race patients were more likely than other race/ethnicity groups to have a subspecialist visit or multiple types of subspecialist visits at some point during the study period. Following patients in the other/unknown category, Asian/Pacific Islanders were least likely to use subspecialty care. The differences across the race/ethnicity groups were smaller than the differences found between the payer categories.
Most Common Diagnoses by Subspecialty, PEDSnet Data Only
For the PEDSnet analysis, diagnosis codes assigned by the subspecialists were extracted for each subspecialist visit. Clinically similar codes were aggregated into a single category to obtain a rank-ordered list of the three most common diagnoses recorded by subspecialists (see Table 3-4).
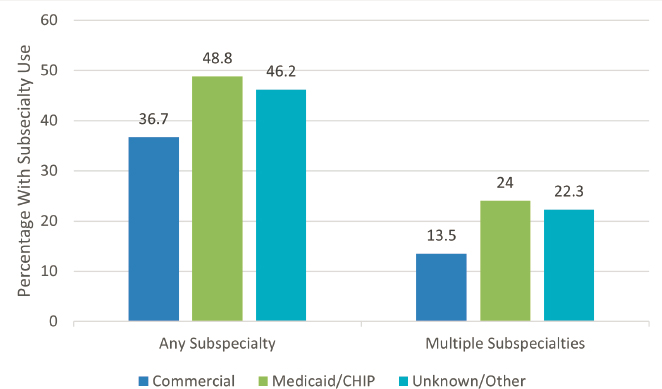
NOTES: PEDSnet data are from eight large pediatric academic medical centers. Proportions represent the share of children with at least one visit to a subspecialist during the study period. Children on average had 4 years of follow-up. Children insured by Medicaid/CHIP at any time during their follow-up period were classified as having that type of insurance.
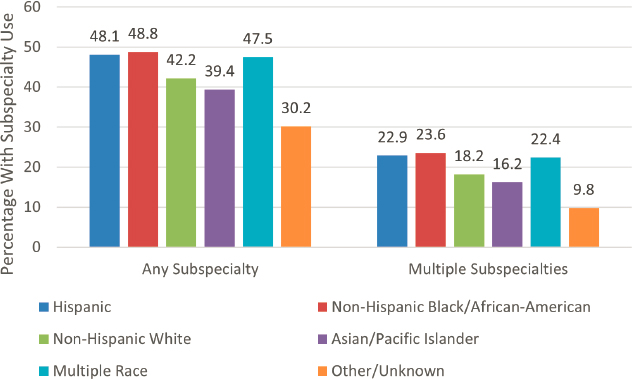
NOTES: PEDSnet data are from eight large pediatric academic medical centers. Proportions for any subspecialist use represent the share of children with at least one visit to a subspecialist across the full study period. The proportion of children with multiple subspecialties use included the share of children who saw two or more types of subspecialists across the full study period. Children on average had 4 years of follow-up. Children with Hispanic ethnicity were categorized as Hispanic race/ethnicity, otherwise their race category was used.
TABLE 3-4 Pediatric Medical Subspecialists’ Three Most Commonly Diagnosed Health Conditions in Outpatient Settings, 2011–2021, PEDSnet
| Pediatric Subspecialty | Three Most Common Health Conditions Rank Ordered |
|---|---|
| Adolescent Medicine | Obesity Sexually transmitted infection Contraception |
| Child Abuse Pediatrics | Child sexual abuse Foster care Possible victim of child abuse |
| Child Neurology | Seizure/epilepsy Headache, including migraine Developmental delay |
| Clinical Genetics | Developmental delay Autism spectrum disorder Poor muscle tone |
| Developmental-Behavioral Pediatrics | Developmental delay Autism spectrum disorder Attention deficit hyperactivity disorder |
| Hospice and Palliative Medicine | Palliative care Pain Hospice care |
| Medical Toxicology | Lead poisoning Abnormal blood chemistry Iron-deficiency anemia |
| Obesity Medicine | Obesity Obstructive sleep apnea, including snoring History of bariatric surgery |
| Pediatric Allergy/Immunology | Allergic rhinitis Allergies, including food allergies Atopic dermatitis |
| Pediatric Cardiology | Heart murmur Chest pain Palpitations |
| Pediatric Dermatology | Atopic dermatitis Warts and molluscum contagiosum Inflammatory dermatitis |
| Pediatric Endocrinology | Obesity Short stature Type 1 diabetes mellitus |
| Pediatric Gastroenterology | Constipation Gastroesophageal reflux Feeding problem |
| Pediatric Subspecialty | Three Most Common Health Conditions Rank Ordered |
|---|---|
| Pediatric Hematology/Oncology | Anemia, including iron-deficiency anemia Acute lymphoid leukemia Thrombocytopenia |
| Pediatric Infectious Diseases | Positive tuberculin test Fever Upper respiratory infection |
| Pediatric Nephrology | Hypertension Chronic kidney disease Proteinuria |
| Pediatric Pulmonology | Asthma Obstructive sleep apnea, including snoring Cough |
| Pediatric Rehabilitation Medicine | Muscle weakness Abnormal gait Developmental delay |
| Pediatric Rheumatology | Joint pain Antinuclear-antibody positive Hypermobility syndrome |
| Pediatric Transplant Hepatology | Depression, including suicidal ideation Postoperative state Liver disease |
| Sleep Medicine | Obstructive sleep apnea, including snoring Sleep disorder Trisomy 21 |
| Sports Medicine | Pain Patellofemoral stress syndrome Ankle sprain |
NOTES: All diagnosis codes were from outpatient clinics. Data from urgent care centers, emergency departments, and inpatient settings were excluded.
For example, multiple codes for hypertension (i.e., elevated blood pressure, essential hypertension, hypertensive disorder, and secondary hypertension) were combined into a single cluster. Perhaps the most remarkable result that emerges from this list is the number of diagnoses that are common conditions or health problems that are usually managed in primary care settings. It is possible that some patients with common diagnoses such as constipation on further evaluation were diagnosed with an uncommon disorder, such as congenital aganglionic megacolon. It is also possible that common diagnoses like headache represent severe cases that have been intransigent to standard primary care treatment.
Adult Subspecialty Workforce, T-MSIS Data Only
The data presented above may underrepresent use rates of subspecialty care by children, as some children may receive subspecialty care from adult clinicians. To examine the extent to which this happens, T-MSIS data were used to investigate the adult subspecialty workforce providing service to the pediatric population insured by Medicaid/CHIP. Table 3-5 provides the subspecialist use rates for 2019 by adult and pediatric medical subspecialty physicians for beneficiaries younger than 19 years old insured by Medicaid/CHIP and by age range (i.e., less than 1 year, 1–11 years, and 12–18 years).
Overall, for most subspecialties, children were more likely to have an outpatient visit to a pediatric subspecialist than an adult subspecialist. Generally, pediatric patients in the adolescent years were more likely to be treated by adult medical subspecialty physicians than those in the younger age ranges. Some additional patterns of care are also notable. For example, a high rate of outpatient pediatric patients insured by Medicaid/CHIP saw adult allergy and immunology specialists compared with pediatric allergy and immunology specialists. This may be related to the small number of pediatric allergy and immunology specialists concentrating on the smaller number of children with serious immunologic diseases.
WHAT THESE DATA MEAN
Across the data sources, approximately 10 to 20 percent of children less than 21 years saw a pediatric medical subspecialist each year. The rate estimates vary widely across and within datasets, which may be due to differences in access to subspecialty care by type of payer, geographic accessibility differences across regions of the United States, type of health system, and a range of other factors (see Chapter 2 for full discussion on access to subspecialty care). Wide variation (but consistent among datasets) in use of different types of subspecialties points to the need for subspecialty workforce development and access initiatives to analyze these trends and consider prioritizing some subspecialties over others in order to decrease disparities in access.
The analyses show weak evidence for rising rates per 1,000 population of subspecialty use from 2011 to 2021. However, the PEDSnet academic medical center data make it clear that these institutions have experienced an increase in demand for subspecialty care since 2010 due largely to an overall increased number of children receiving most of their care (primary and subspecialty) within their systems; that is, the rate per 1000 children has not increased, but the denominator has. Moreover, the need for multiple subspecialties for the same child has increased even more, pointing toward an increase in complexity among patients served.
TABLE 3-5 Adult and Pediatric Medical Subspecialty Outpatient Subspecialist Use Rates for Children Less Than 19 Years Covered by Medicaid/Children’s Health Insurance Program, T-MSIS Calendar Year 2019
| Medical Subspecialty | Use Rate per 1,000 Children Insured by Medicaid/CHIP | Use Rate per 1,000 Children Insured by Medicaid/CHIP, by Age | ||
|---|---|---|---|---|
| Age: All <19 Years | < 1 Year | 1–11 Years | 12–18 Years | |
| Adult Neurology | 2.8 | 0.9 | 2.4 | 3.9 |
| Child Neurology | 7.2 | 3.5 | 7.5 | 7.5 |
| Adult Hospice and Palliative Medicine | 0.3 | 0.4 | 0.3 | 0.3 |
| Pediatric Hospice and Palliative Medicine | 0.3 | 0.3 | 0.3 | 0.2 |
| Adult Medical Toxicology | <0.1 | <0.1 | <0.1 | <0.1 |
| Pediatric Medical Toxicology | <0.1 | <0.1 | <0.1 | <0.1 |
| Adult Obesity Medicine | 0.2 | 0.2 | 0.2 | 0.2 |
| Pediatric Obesity Medicine | <0.1 | <0.1 | <0.1 | <0.1 |
| Adult Allergy/Immunology | 10.8 | 2.3 | 11.8 | 10.4 |
| Pediatric Allergy/Immunology | 1.0 | 0.5 | 1.2 | 0.8 |
| Adult Cardiology | 0.6 | 0.4 | 0.4 | 1.0 |
| Pediatric Cardiology | 8.4 | 16.1 | 8.0 | 7.9 |
| Adult Dermatology | 1.9 | 1.4 | 1.7 | 2.3 |
| Pediatric Dermatology | 8.7 | 3.4 | 6.5 | 13.4 |
| Adult Emergency Medicine | 18.7 | 12.5 | 20.0 | 17.3 |
| Pediatric Emergency Medicine | 6.9 | 10.0 | 8.1 | 4.4 |
| Adult Endocrinology | 0.3 | 0.1 | 0.2 | 0.7 |
| Pediatric Endocrinology | 6.4 | 3.0 | 5.0 | 9.3 |
| Adult Gastroenterology | 0.4 | 0.1 | 0.1 | 0.9 |
| Pediatric Gastroenterology | 7.6 | 8.5 | 7.7 | 7.3 |
| Adult Hematology/Oncology | 0.2 | 0.1 | 0.2 | 0.3 |
| Pediatric Hematology/Oncology | 4.5 | 4.7 | 4.7 | 4.2 |
| Adult Infectious Disease | 0.4 | 0.4 | 0.3 | 0.6 |
| Pediatric Infectious Disease | 2.3 | 4.5 | 2.6 | 1.6 |
| Adult Nephrology | 0.3 | 0.1 | 0.2 | 0.5 |
| Pediatric Nephrology | 2.2 | 2.4 | 2.1 | 2.4 |
| Medical Subspecialty | Use Rate per 1,000 Children Insured by Medicaid/CHIP | Use Rate per 1,000 Children Insured by Medicaid/CHIP, by Age | ||
|---|---|---|---|---|
| Age: All <19 Years | < 1 Year | 1–11 Years | 12–18 Years | |
| Adult Pulmonology | 0.2 | 0.1 | 0.2 | 0.3 |
| Pediatric Pulmonology | 5.1 | 3.6 | 6.1 | 3.6 |
| Adult Rehabilitation Medicine | 1.1 | 0.3 | 0.9 | 1.6 |
| Pediatric Rehabilitation Medicine | 0.4 | 0.2 | 0.4 | 0.3 |
| Adult Rheumatology | 0.2 | <0.1 | 0.1 | 0.3 |
| Pediatric Rheumatology | 0.9 | 0.5 | 0.7 | 1.2 |
| Adult Transplant Hepatology | <0.1 | <0.1 | <0.1 | <0.1 |
| Pediatric Transplant Hepatology | <0.1 | <0.1 | <0.1 | <0.1 |
| Adult Sleep Medicine | 0.8 | 0.4 | 0.8 | 0.7 |
| Pediatric Sleep Medicine | 0.3 | 0.3 | 0.3 | 0.2 |
| Adult Sports Medicine | 2.8 | 2.0 | 1.9 | 4.5 |
| Pediatric Sports Medicine | 1.1 | 0.8 | 0.9 | 1.5 |
NOTES: T-MSIS is a national dataset of Medicaid/CHIP claims. Annual subspecialist use rates were computed as the number of beneficiaries less than 19 years old insured by Medicaid/CHIP with one or more evaluation and management visits to a pediatric subspecialist per 1,000 beneficiaries less than 19 years old insured by Medicaid/CHIP.
All datasets used in these analyses are national in scope, but none were fully nationally representative. Furthermore, they were intentionally chosen to provide a set of complementary approaches for understanding patterns of subspecialist use. Carelon Research included data from one multistate health insurance company and was restricted to beneficiaries with commercial insurance. PEDSnet included patients insured by different commercial insurance plans as well as beneficiaries with Medicaid/CHIP insurance, but the analysis was limited to patients within eight large, pediatric academic medical centers. T-MSIS includes only the population insured by Medicaid/CHIP.
There are several reasons why the subspecialty use rates were lower in the Carelon Research and T-MSIS cohorts compared with the PEDSnet cohort. First, Carelon Research and T-MSIS were based on children enrolled in health plans, which included both users and non-users of health care, while PEDSnet was a use-based cohort that did not contain information
on primary or specialty care that occurred outside the academic medical care system. Second, Carelon Research and T-MSIS included children who sought care from all types of settings, both community and academic institutions, while PEDSnet included children obtaining care from academic medical centers only. Children receiving care in academic medical centers may have higher acuity and thus more intense service use. Third, PEDSnet has devoted extensive effort to validating physician subspecialty, working with each member institution to examine and improve the quality of this data element. It is possible that Carelon Research’s rates were lower because some subspecialty care may have been billed as a pediatric medical group rather than a specific subspecialty group practice. The T-MSIS analysis relied on primary specialty in the National Plan and Provider Enumeration System dataset, which may not fully capture physician subspecialties. Fourth, Carelon Research data just include beneficiaries with commercial insurance only and T-MSIS only includes beneficiaries insured by Medicaid/CHIP, while PEDSnet patients are not limited based on insurance type (with 40 percent having Medicaid/CHIP coverage). Finally, the T-MSIS data are also limited in the years of available data, from 2016 through 2019.
As diagnoses seen by subspecialties are often those that can be managed to some extent by primary care, innovations to improve the primary care-subspecialty interface might be promoted and incentivized as a way to improve access to appropriate care for these problems. (See Chapter 7 for more on the pediatric primary–subspecialty care interface, including optimizing referrals.)
KEY FINDINGS AND CONCLUSIONS
Key Findings
Finding 3-1: Each year about 10 to 20 percent of children less than 21 years of age obtain care from a pediatric medical subspecialist.
Finding 3-2: Although the rates of subspecialist use in academic medical centers remained constant, the absolute number of children seeing a subspecialist increased markedly because of the larger total population of children cared for in these institutions.
Finding 3-3: Overall annual rates of use of multiple types of subspecialists (i.e., patients seeing more than one type of subspecialist) increased in pediatric academic medical centers.
Finding 3-4: The change in subspecialist use rates between 2011 and 2021 varied by type of pediatric medical subspecialist.
Finding 3-5: Within academic medical center practices, children insured by Medicaid/CHIP insurance were more likely to have at least one pediatric medical subspecialty visit than those with commercial insurance. For the general population with Medicaid/CHIP insurance, use rate varied across the pediatric subspecialties.
Finding 3-6: For many pediatric medical subspecialties, the most commonly managed health conditions are those that may be able to be managed in primary care settings.
Finding 3-7: The data across the three analyses showed similar variations in use of different types of pediatric medical subspecialties.
Finding 3-8: Adult subspecialists provide a share of health care services to the pediatric population with Medicaid/CHIP insurance. More adult subspecialists see adolescent age patients than younger children.
Conclusions
Conclusion 3-1: The share of children using pediatric medical subspecialty care increased somewhat from 2011 to 2021, but temporal trends varied significantly by subspecialty type and payer.
Conclusion 3-2: In a select group of the nation’s large pediatric academic medical centers, growth in the number of children cared for increased markedly from 2011 to 2021, although the share of children requiring pediatric medical subspecialty care remained constant.
Conclusion 3-3: In a select group of the nation’s large pediatric academic medical centers, children enrolled in Medicaid/CHIP compared with those who are commercially insured had a higher use of pediatric medical subspeciality care.
Conclusion 3-4: Some portion of subspecialty use may be amenable to substitution with primary care services.
Conclusion 3-5: Adult subspecialists are important parts of the workforce that provide care to the pediatric population.
REFERENCE
Yoon, P., J. Hall, J. Fuld, S. L. Mattocks, B. C. Lyons, R. Bhatkoti, J. Henley, A. D. McNaghten, D. Daskalakis, and S. K. Pillai. 2021. Alternative methods for grouping race and ethnicity to monitor COVID-19 outcomes and vaccination coverage. Morbidity and Mortality Weekly Report 70:1075-1080.


